ISSN: 1449-2288International Journal of Biological Sciences

Int J Biol Sci 2009; 5(7):679-685. doi:10.7150/ijbs.5.679 This issue Cite
Research Paper
Proteome Changes in Thai Indigenous Chicken Muscle during Growth Period
Tawatchai Teltathum1,2, Supamit Mekchay2,3 ![]()
1. Human and Animal Biotechnology Program, Graduate School, Chiang Mai University, Chiang Mai, 50200, Thailand
2. Center for Agricultural Biotechnology: AG-BIO/PERDO-CHE, Thailand
3. Department of Animal Science, Faculty of Agriculture, Chiang Mai University, Chiang Mai, 50200, Thailand
Abstract
Proteomic profiling of the pectoralis muscle of Thai indigenous chickens during growth period was analyzed using two-dimensional gel electrophoresis (2-DE) and matrix assisted laser desorption ionization time of flight mass spectrometry (MALDI-TOF/MS). A total of 259, 161, 120 and 107 protein spots were found to be expressed in the chicken pectoralis muscles at 0, 3, 6 and 18 weeks of age, respectively. From these expressed proteins, five distinct protein spots were significantly associated with chicken age. These protein spots were characterized and showed homology with phosphoglycerate mutase 1 (PGAM1), apolipoprotein A1 (APOA1), triosephosphate isomerase 1 (TPI1), heat shock protein 25 kDa (HSP25) and fatty acid binding protein 3 (FABP3). These five protein spots were categorized as follows: (i) the expression levels of PGAM1 and TPI1 proteins were positively correlated with chicken aging (p<0.05), (ii) the expression levels of APOA1 and FABP3 proteins were negatively correlated with chicken aging (p<0.05) and (iii) the expression levels of the HSP25 protein were up- and down-regulated during growth period. Moreover, the mRNA expression levels of the FABP3 and HSP25 genes were significantly decreased in muscle during the growth period (p<0.05), whereas no significant changes of the PGAM1, TPI1 and APOA1 gene expression from the chicken muscle was observed. The identified proteins were classified as metabolic and stress proteins. This demonstrates a difference in energy metabolism and stress proteins between age groups and shows that proteomics is a useful tool to uncover the molecular basis of physiological differences in muscle during the growth period.
Keywords: chicken, gene expression, growth, muscle, proteome
INTRODUCTION
Thai indigenous chickens have a unique taste, tough and strong muscles. Such meat is very popular among consumers and the market price is two or three times higher than the commercial broiler chicken (1). Thai indigenous chickens have a slow growth rate and contain low fat. The chemical composition, color, texture and structure of the Thai indigenous and commercial broiler chicken meat have been characterized (1,2). Thai indigenous chicken has a firmer texture and more flavor than the commercial broiler chicken (1).
Proteomic technology is a powerful method to identify proteins that play a major role in the mechanism for controlling meat quality traits. The proteomics approach has been successful in discovering the protein markers associated with meat quality traits in several livestock species such as cattle (3), sheep (4) and pigs (5-7). Moreover, the proteome of muscle growth and development has been characterized in chicken and pigs (8,9). However, information on molecular markers for muscle development of Thai indigenous chickens is limited. The aim of this study was to analyze proteome changes in Thai indigenous chicken during the growth period. Moreover, the expression levels of these target genes were then further validated by quantitative real-time PCR.
EXPERIMENTAL PROCEDURES
Animals
Twenty mixed-sex Thai indigenous chickens (named “Pradhuhangdum”) were obtained from the Livestock Breeding and Research center, Sanpatong, Chiang Mai and reared under the same conditions at the research farm of the Department of Animal Science, Chiang Mai University. The pectoralis muscles were collected from 5 individual chickens (3 females and 2 males) at 0, 3, 6 and 18 weeks of age. The tissue samples were kept at -80 oC for proteomic and quantitative gene expression analysis.
Two-dimensional gel electrophoresis
To prepare protein extracts, pectoralis muscle samples were homogenized in 1.5 ml of lysis buffer (8M urea, 4% CHAPS, 40 mM Tris-HCL pH 8.8 and 0.5% IPG buffer pH 3-10). The extracted protein was cleaned using a 2-D clean up kit (Amersham Biosciences, Thailand) according to the manufacturer's procedure. The concentration of the purified protein was then determined using a 2-D Quant kit (Amersham Biosciences, Thailand). Proteomic analysis was performed using two-dimensional gel electrophoresis (2-DE). Briefly, 10 µg of the protein was diluted with 125 µl of rehydration buffer (8M urea, 4% CHAPS, 60 mM DTT, 0.5% IPG buffer and 0.002% bromophenol blue) and applied to the Immobiline DryStrips (pH 3-10, 7 cm, Amersham Biosciences, Thailand). The strips were rehydrated at 20 oC for 12 hours and one-dimensional, isoelectric focusing (IEF) was carried out on an Ettan IPGphor II, IEF system (Amersham Biosciences, Thailand) using 300 V for 150Vh, 1,000 V for 300 Vh, 5,000 V for 4,000 Vh and 5,000 V for 500 Vh, 50 µA at 20 oC. The strips were then subjected to two step equilibration in 5 ml of SDS equilibration buffer containing 6M urea, 75 mM Tris-HCL pH 8.8, 29.3% glycerol, 2% SDS and 0.002% bromophenol blue, 50 mg DTT for 15 min at room temperature for the first step and 125 mg iodoacetamide for the second step. The strips were then applied to 18.75% SDS polyacrylamide gel electrophoresis. The gels were silver and Coomassie blue stained for protein expression analysis and protein characterization, respectively. The protein spots were scanned and the intensity of spots was analyzed using the Dymension Revolutionary 2-DE software version 2.05a (Syngene, UK).
Protein identification
The protein spots of interest were excised from the gels using pipette tips and subjected to in-gel tryptic digestion, which was performed in an Ettan Spot Handling workstation (Amersham Biosciences, Thailand). Matrix-assisted laser desorption ionization time of flight mass spectrometry (MALDI-TOF/MS) was performed at the Genome Institute, National Science and Technology Development Agency, Pathumthani, Thailand. The supernatant containing the peptide was mixed with α-cyano-4-hydroxycinnamic acid (CCA). Peptides were analyzed by a MALDI-TOF with the model reflex IV (Bruker Daltonics, Germany). Calibration was performed using the peptide standard (P/N 206195, Bruker Daltonik, Bremen, Germany). The spectra were acquired in the mass range 900-3500 amu summing 50 laser shots for each sample and an m/z error of ± 20 ppm. Proteins were identified from their peptide mass fingerprints, searching on the NCBI (National Center for Biotechnology Information, http://www.ncbi.nlm.nih.gov) and Swiss-prot databases (www.expasy.org). Both of these databases contain publically accessible protein sequence which can be checked using the MASCOT software (http://www.matrixscience.com). The initial search parameters allowed a single trypsin missed cleavage, carbamido-methylation of cystein and partial oxidation of methionine. Database searches were performed using parameter mass tolerances of ± 1 Da for peptide mass ions.
Quantitative Real-Time PCR
To validate the results of the differential proteome analysis of chicken muscles at mRNA level, real time quantitative PCR was performed using cDNA from pectoralis muscles of Thai indigenous chickens at 0, 3, 6 and 18 weeks of age. Total RNA was isolated from the pectoralis muscles using Trizol reagent (Invitrogen, USA) according to the manufacturer's procedure and treated with DNase I (Promega, USA) for 1 h at 37 oC. RNA purification was performed using an RNeasy mini Kit (Qiagen, Germany). Total RNA samples were reverse transcribed in 10 μl reaction volume containing 1 μg of total RNA, 100 pmol of oligo (dT)12 primers, heated for 5 min at 70 oC and placed on ice for 3 min. Then 10 μl of mixture components of 1x first strand buffer, 10 μM dNTPs, 10 mM DTT, 10 units RNase inhibitor (Promega, USA) and 200 units of SuperScript III reverse transcriptase (Invitrogen, USA) were added, incubated at 50 oC for 60 min and finally heated to stop reaction at 70 oC for 15 min and stored at -20 oC until analyzed.
The expression levels of the target genes were determined on a Chromo 4 Real-Time PCR Detector (MJ Research PTC-200). The PCR reactions were performed in 20 µl reaction volume containing 10 µl 2x QuantiTech SYBR Green master mix (Qiagen, Germany), 2 µl of muscle cDNA sample and forward and reverse primers (Table 1) in optimal combinations of concentrations (4 µM). The target genes were amplified in duplicate at the following conditions: an initial denaturing at 95oC for 15 min, 45 cycles of 95 oC for 15 sec, 58-62 oC for 30 sec, 72 oC for 1 min. The expressed target genes in muscles were reported as relative gene expression or n-fold difference to calibrator cDNA using the comparative threshold cycle (CT) method (2-ΔΔCT) (10).
Primers used for the quantification of target genes.
| Target genes | Sequence | GenBank accession no. | Annealing temperature (°C) | Amplicon size (bp) |
|---|---|---|---|---|
| PGAM1 | 5'-CCTGCCCTTCTGGAATGAG-3' 5'-TGGGCTTCAGGTTCTTGTCC-3' | NM_001031556 | 62 | 191 |
| APOA1 | 5'- ATGCCATCGCCCAGTTCG -3' 5'- GAGCCTCGGTGTCCTTCA -3' | M17961 | 58 | 162 |
| TPI1 | 5'-CTTGCCTATGAGCCAGTTTG-3' 5'-GTTCCTTACAGTTGCCACCA-3' | NM_205451 | 60 | 175 |
| HSP25 | 5'- TGCTTCACCCGCAAATACAC -3' 5'- TCTTGGCTGGTTCTTCCTTC -3' | BM488075 | 60 | 175 |
| FABP3 | 5'-GACCAAACCCACCACCATCA-3' 5'-CTCCTTCCCATCCCACTTCT-3' | NM_001030889 | 62 | 199 |
| GAPDH | 5'- CGTGTTATCATCTCAGCTCC-3' 5'- ACCCTCCACAATGCCAAAGT-3' | NM_204305 | 60 | 168 |
Statistics
The data were analyzed using the SAS package software, version 6.08 (SAS Institute, Inc., Carry, NC). The difference in protein spot intensity and relative mRNA expression of four age groups were analyzed using the proc GLM procedure. Moreover, correlation coefficients of the mRNA and their protein expression levels were calculated. Differences were considered significant at p<0.05.
RESULTS
Proteomic analysis
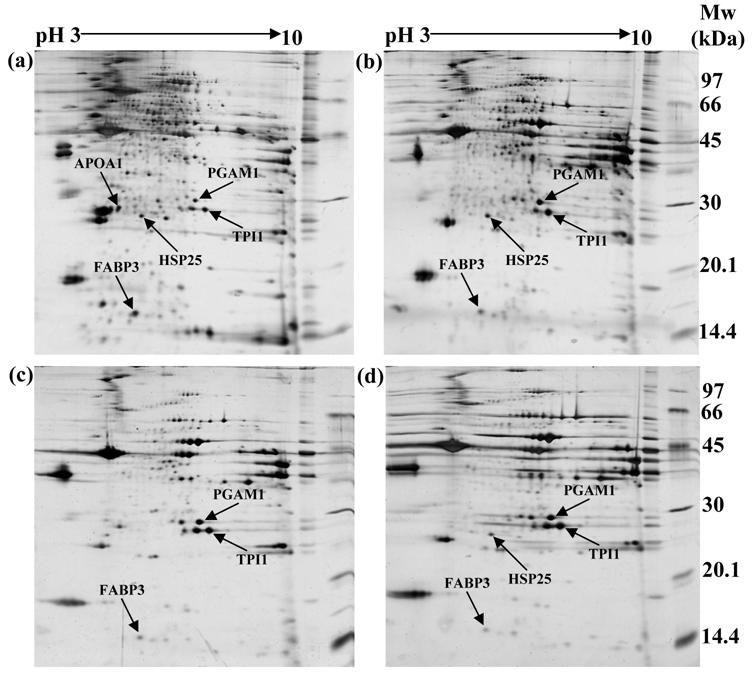
In order to identify differentially expressed proteomes in Thai indigenous chicken muscle during the growth period, the proteome profiles of chicken muscle were compared at 0, 3, 6 and 18 weeks of age using the 2-DE and MALDI-TOF/MS approaches. A total of 259, 161, 120 and 107 protein spots were found in chicken pectoralis muscles at 0, 3, 6 and 18 weeks of age, respectively. A representative example of the proteome profiles in chicken muscle is shown in Figure 1. Forty-six protein spots were found differentially expressed during the growth period. For these proteomes, five protein spots showed well-resolved spots and were selected for further protein characterization. These protein spots showed homology with phosphoglycerate mutase 1 (PGAM1), apolipoprotein A1 (APOA1), triosephosphate isomerase 1 (TPI1), heat shock protein 25 kDa (HSP25) and fatty acid binding protein 3 (FABP3). Table 2 summarizes the mowse scores, estimated molecular weights (Mw), isoelectric points (pI), estimated minimum sequence coverage and matched peptides of the individual spots.
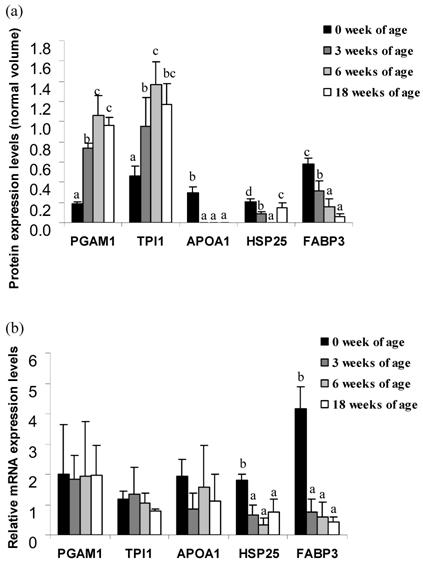
The expression levels of the protein spots between 0 and 18 weeks of age from Thai indigenous chicken muscle are indicated in Figure 2a. The expression levels of PGAM1 and TPI1 proteins were positively correlated with chicken aging (p<0.05). PGAM1 was expressed 3.9-fold at 3 weeks, 5.6-fold at 6 weeks and 5.1-fold at 18 weeks as compared to 0 weeks of age. TPI1 was expressed 2.1-fold at 3 weeks, 3.0-fold at 6 weeks and 2.5-fold at 18 weeks as compared to the levels at 0 weeks of age, whereas the expression levels of APOA1 and FABP3 proteins were negatively correlated with chicken aging (p<0.05). The APOA1 protein was only expressed 0.30±0.05 unit at 0 weeks of age. The FABP3 protein was expressed 0.5-fold at 3 weeks, 0.3-fold at 6 weeks and 0.1-fold at 18 weeks as compared to 0 weeks of age. The expression levels of the HSP25 protein were both up- and down-regulated during the growth period. This protein spot was expressed 0.4-fold at 3 weeks and 0.7-fold at 18 weeks as compared to 0 weeks of age, while no expression of HSP25 protein in week 6 was observed.
Representation of two-dimensional electrophoresis (2-DE gel) profiles of pectoralis muscle of Thai indigenous chickens at (a) 0, (b) 3, (c) 6 and (d) 18 weeks of age, respectively (arrows indicate the target proteins).
Identification of proteome changes in Thai indigenous chicken pectoralis muscle.
| Experimental | From databases | ||||||
|---|---|---|---|---|---|---|---|
| Protein identification | Accession number | Mowse Scorea | Sequence Coverageb (%) | Mwc (kDa) | pId | Mw (kDa) | pI |
| PGAM1 | NP_990800 | 79 | 49 | 33.34 | 7.33 | 28.92 | 7.21 |
| APOA1 | NP_990856 | 82 | 33 | 31.23 | 5.28 | 30.66 | 5.58 |
| TPI1 | P84174 | 116 | 84 | 31.12 | 7.55 | 26.70 | 6.79 |
| HSP25 | NP_990621 | 74 | 43 | 29.98 | 5.91 | 21.72 | 5.77 |
| FABP3 | NP_001026060 | 70 | 43 | 14.49 | 5.71 | 14.81 | 5.92 |
Phosphoglycerate mutase 1 (PGAM1), apolipoprotein A1 (APOA1), triosephosphate isomerase 1 (TPI1), heat shock protein 25 kDa (HSP25) and fatty acid binding protein 3 (FABP3). aMowse scores greater than or equal to 69 are significant (p<0.05). bpercentage of coverage of the entire amino acid sequence. cMolecular weight of spot. dIsoelectric point of spot.
Quantitative gene expression analysis
To confirm differential expression of the muscle proteome in the Thai indigenous chicken, quantitative real-time PCR of individual mRNA from chicken muscle at 0, 3, 6 and 18 weeks of age was performed. The relative expression levels of the target genes are indicated in Figure 2b. Significant expressions of the HSP25 and FABP3 genes were observed. The HSP25 gene was expressed 0.4-fold in 3 weeks, 0.2-fold in 6 weeks and 0.4-fold in 18 weeks as compared to 0 week of age. The FABP3 gene was expressed 0.2-fold in 3 weeks, 0.1-fold in 6 weeks and 0.1-fold in 18 weeks as compared to 0 week of age. Whereas, no significant difference of the PGAM1, APOA1 and TPI1 genes were found among of age groups.
Normal volume intensity (a) protein and (b) relative mRNA expression levels of PGAM1, APOA1, TPI1, HSP25 and FABP3 genes of Thai indigenous chicken during the growth period (0, 3, 6 and 18 weeks of age). Each bar represents the mean ± S.E.M. of each protein or mRNA. a-dMeans with differing superscripts in the same protein/gene are significantly different (p<0.05).
DISCUSSION
Understanding the molecular mechanism of muscle development in Thai indigenous chickens can be investigated by studying the proteome profile during the growth period to identify the important proteins that regulate this trait. In the present study, the proteome profiles from pectoralis muscles of Thai indigenous chickens at 0, 3, 6 and 18 weeks of age were investigated. These results were then further validated using quantitative real-time PCR. Five protein spots showed altered expression among age groups of Thai indigenous chicken. These proteins included the metabolic proteins (PGAM1, TPI1, APOA1 and FABP3) and the stress protein (HSP25). Thai indigenous chickens were found to have higher levels of the PGAM1 and TPI1 proteins in older than in younger chicken. This indicates that the differential expression, of these proteins, is related to chickens age. These results are consistent with previous studies which found that the PGAM1 and TPI1 proteins expression levels of layer chicken were positively correlated to the growth period (8) as well as the TPI1 protein expression levels in pigs which were associated with age (9). PGAM1 and TPI1 are glycolysis enzymes which play an important role in energy generation for muscle cells (11,12). Several studies have found glycolytic proteins responsible for energy metabolism in muscle to be closely related to meat tenderness and toughness traits (6,13-15). This may reflect a higher glycolytic activity in older chicken.
In contrast, Thai indigenous chickens have lower levels of the APOA1 and FABP3 in the older than in the younger chicken. This result is consistent with previous studies in layer chicken (8) which indicated that the animals aging had an effect on the expression levels of APOA1 and FABP proteins. Furthermore, the FABP3 protein was found to be associated with muscle growth in commercial pig breeds (9). The APOA1 protein is a main component of high density lipoprotein (HDL) in plasma which delivers cholesterol into cells (16). The fatty acid binding proteins (FABPs) play a role in the transfer of fatty acid into cells and delivering the inner cellular fatty acid to combust in mitochondria (17). Our results indicate that the APOA1 and FABP3 play an important function in the early stage of muscle development in Thai indigenous chicken. The expression levels of the small heat shock protein (HSP25) fluctuated during the growth period. Similarly, the small heat shock protein (HSP27) was found to be associated with breed characteristics of pigs (9) and meat quality of beef (18,19). In addition, a previous study (8) found that the large heat shock protein (HSP90) was related to the growth period in layer chicken.
The mRNA expression levels of five genes (PGAM1, TPI1, APOA1, HSP25 and FABP3) were evaluated. The expression levels of HSP25 and FABP3 genes are in agreement with the results obtained by proteomic analysis and tended toward an association with their protein expression levels (r=0.88, p<0.11; r=0.92, p<0.07, respectively). Whereas, no correlation between the expressions levels of the PGAM1, TPI1 and APOA1 genes and their proteins expression levels were found. It has been reported that there is no correlation between some mRNA expression levels and their protein expression in yeast or human liver (20,21). Genes may be present but not transcribed and the number of mRNA copies does not always reflect the number of functional proteins present (22). Protein levels are also regulated by posttranscriptional mechanisms, including transcript localization and stability, translational regulation, and protein degradation (23). A further validation of these proteomic results should be performed with Western blot analysis.
In conclusion a proteomic analysis, of the pectoralis muscle in Thai indigenous chicken, found five marker proteins (PGAM1, TPI1, APOA1, HSP25 and FABP3) which are associated with aging during the growth period and influenced muscle development. These results indicate that the metabolic energy and stress protein are important for muscle development of chicken. Further studies are needed to compare the muscle proteome characteristics of Thai indigenous and commercial broiler chickens and to find further protein markers for muscle development and meat quality.
Acknowledgements
This research was partially supported by the Center for Agricultural Biotechnology, Postgraduate Education and Research Development Office, Commission on Higher Education (CHE), Ministry of Education and the Thai Research Fund (TRF)-CHE (MRG 5080077) as well as The Graduate School of Chiang Mai University and Department of Livestock Development, Ministry of Agricultural and Cooperative, Thailand. We would like to thank Asst. Prof. Dr. Sutkhet Nakasathien, Department of Agronomy, Faculty of Agriculture, Kasetsart University for his excellent suggestions in this research.
Conflict of Interest
The authors have declared that no conflict interest exists.
References
1. Wattanachant S, Benjakul S, Ledward DA. Composition, color and texture of Thai indigenous and broiler chicken muscles. Poult Sci. 2004;83:123-128
2. Wattanachant S, Benjakul S, Ledward DA. Microstructure and thermal characteristics of Thai indigenous and broiler chicken muscles. Poult Sci. 2005;84:328-336
3. Bouley J, Meunier B, Chambon C. et al. Proteomic analysis of bovine skeletal muscle hypertrophy. Proteomics. 2005;5:490-500
4. Hamelin M, Sayd T, Chambon C. et al. Proteomic analysis of ovine muscle hypertrophy. J Anim Sci. 2006;84:3266-3276
5. Lametsch R, Bendixen E. Proteome analysis applied to meat science: Characterizing post mortem changes in porcine muscle. J Agric Food Chem. 2001;49:4531-4537
6. Lametsch R, Karlsson A, Rosenvold K. et al. Postmortem proteome changes of porcine muscle related to tenderness. J Agric Food Chem. 2003;51:6992-6997
7. Sayd T, Morzel M, Chambon C. et al. Protein analysis of sarcoplamic fraction of pig semimembranosus muscle: Implications on meat color development. J Agric Food Chem. 2006;54:2732-2737
8. Doherty MK, McLean L, Hayter JR. et al. The proteome of chicken skeletal muscle: Changes in soluble protein expression during growth in a layer strain. Proteomics. 2004;4:2082-2093
9. Hollung K, Grove H, Faergestad EM. et al. Comparison of muscle proteome profile in Norwegian Lanndrace, Duroc and Hampsire at three different ages. Meat Sci. 2009;81:487-492
10. Livak KJ, Schmittgen TD. Analysis of relative gene expression data using real-time quantitative PCR and the 2-ΔΔCT method. Method. 2001;25:402-408
11. Qiu H, Zhao S, Xu X. et al. Assignment and expression patterns of patterns of porcine muscle-specific isoform of phosphoglycerate mutase gene. J Genet Genomics. 2008;35:257-260
12. Solem C, Koebmann B, Jensen PR. Control analysis of the role of triosephosphate isomerase in glucose metabolism in Lactococcus lactis. IET Syst Biol. 2008;2:64-72
13. Lametsch R, Roepstorff P, Bendixen E. Identification of protein degradation during post-martem stronge of pig meat. J Agric Food Chem. 2002;50:5508-5512
14. Jia X, Ekman M, Grove H. et al. Proteome changes in bovine longissimus thoracis muscle during the early postmortem storage period. J Proteome Res. 2007;6:2720-2731
15. Hwang IH, Park BY, Kim JH. et al. Assessment of postmortem proteolysis by gel-based proteome analysis and its relationship to meat quality traits in pig longissimus. Meat Sci. 2005;69:79-91
16. Barter P. The role of HDL-cholesterol in preventing atherosclerotic disease. Eur Heart J Suppl. 2005;7:F4-F8
17. Carey JO, Neufer PD, Farrar RP. et al. Transcriptional regulation of muscle fatty acid-binding protein. Biochem J. 1994;298:613-617
18. Bernard C, Cassar-Malek I, Le Cunff M. et al. New indicators of beef sensory quality revealed by expression of specific genes. J Agric Food Chem. 2007;55:5229-5237
19. Pulford DJ, Fraga Vazquez S, Frost DF. et al. The intracellular distribution of small heat shock proteins in post-mortem beef is determined by ultimate pH. Meat Sci. 2008;79:623-630
20. Gygi SP, Rochon Y, Franza BR. et al. Correlation between protein and mRNA abundance in yeast. Mol Cell Biol. 1999;19:1720-1730
21. Anderson L, Seilhamer J. A comparison of selected mRNA and protein abundances in human liver. Electrophoresis. 1997;18:533-537
22. Celis JE, Kruhoffer M, Gromova I. et al. Gene expression profiling: monitoring transcription and translation products using DNA microarrays and proteomics. FEBS Lett. 2000;480:2-16
23. Kuo YM, Shiue YL, Chen CF. et al. Proteomic analysis of hypothalamic proteins of high and low egg production strains of chickens. Theriogenology. 2005;64:1490-1502
Author contact
![]() Correspondence to: Supamit Mekchay, Department of Animal Science, Faculty of Agriculture, Chiang Mai University, Chiang Mai, 50200, Thailand. Tel: +66-5394-4092 Ext.34, Fax: +66-5322-5221, E-mail: agismkchac.th
Correspondence to: Supamit Mekchay, Department of Animal Science, Faculty of Agriculture, Chiang Mai University, Chiang Mai, 50200, Thailand. Tel: +66-5394-4092 Ext.34, Fax: +66-5322-5221, E-mail: agismkchac.th
Received 2009-6-20
Accepted 2009-10-10
Published 2009-10-28