ISSN: 1449-2288International Journal of Biological Sciences
- Current issue
- Volume 20; 2024
- Volume 19; 2023
- Volume 18; 2022
- Volume 17; 2021
- Volume 16; 2020
- Archive
- Advance articles
- Cover images
- Index & coverage
- Cover suggestion
- Special issues
Introduction
Materials and Methods
Results
Discussion
Supplementary Material
Abbreviations
Acknowledgements
References

Int J Biol Sci 2016; 12(9):1129-1139. doi:10.7150/ijbs.16319 This issue Cite
Research Paper
Selection of Reference Genes for Expression Studies of Xenobiotic Adaptation in Tetranychus urticae
Mariany Ashanty Morales1,2, Bianca Marie Mendoza1, Laura Corley Lavine1, Mark Daniel Lavine1, Douglas Bruce Walsh2, Fang Zhu1,2 ![]()
1. Department of Entomology, Washington State University, Pullman, WA 99164, USA;
2. Irrigated Agriculture Research and Extension Center, Washington State University, Prosser, WA 99350, USA.
Abstract

Quantitative real-time PCR (qRT-PCR) is an extensively used, high-throughput method to analyze transcriptional expression of genes of interest. An appropriate normalization strategy with reliable reference genes is required for calculating gene expression across diverse experimental conditions. In this study, we aim to identify the most stable reference genes for expression studies of xenobiotic adaptation in Tetranychus urticae, an extremely polyphagous herbivore causing significant yield reduction of agriculture. We chose eight commonly used housekeeping genes as candidates. The qRT-PCR expression data for these genes were evaluated from seven populations: a susceptible and three acaricide resistant populations feeding on lima beans, and three other susceptible populations which had been shifted host from lima beans to three other plant species. The stability of the candidate reference genes was then assessed using four different algorithms (comparative ΔCt method, geNorm, NormFinder, and BestKeeper). Additionally, we used an online web-based tool (RefFinder) to assign an overall final rank for each candidate gene. Our study found that CycA and Rp49 are best for investigating gene expression in acaricide susceptible and resistant populations. GAPDH, Rp49, and Rpl18 are best for host plant shift studies. And GAPDH and Rp49 were the most stable reference genes when investigating gene expression under changes in both experimental conditions. These results will facilitate research in revealing molecular mechanisms underlying the xenobiotic adaptation of this notorious agricultural pest.
Keywords: xenobiotics adaptation, reference gene, constitutive expression, qRT-PCR, analysis parameters.
Introduction
The two-spotted spider mite, Tetranychus urticae Koch (Acari: Tetranychidae) is the first species with a completely sequenced genome in the subphylum Chelicerata, which incorporates the second largest group of animals on the earth [1, 2]. As one of the most polyphagous herbivores, T. urticae has an extremely broad host range on > 1,100 plant species in more than 250 families [1, 3, 4]. Many of its host plants are economically important crops, ornamentals, fruits and vegetables [4]. The damage caused by T. urticae on these crops leads to a significant reduction in yield [5]. To suppress mite populations, growers often apply numerous acaricides [6]. T. urticae exhibits remarkable capabilities to quickly develop resistance to all of these chemicals, including 95 unique insecticide/acaricide active ingredients in 498 cases worldwide (http://www.pesticideresistance.org/, accessed on June 28th, 2016), and is ranked as the most resistant arthropod pest in the world [1, 2, 7].
From an ecological perspective, pesticides may not be the sole factor that drives the evolution of resistance in herbivore arthropods [8, 9]. Recent studies propose that there is a close link between host plant adaptation and development of pesticide resistance in a specialist [10] and several generalist herbivores, including T. urticae [11, 12]. Because many synthetic pesticides are derived from plant allelochemicals used to defend against herbivores, it is not surprising that the herbivores utilize similar strategies to adapt to both pesticides and chemical defenses of host plants [9-11, 13-16]. T. urticae, as a generalist, is an excellent model to study the relationship between pesticide resistance and host plant adaptation. In a recent study, the transcriptional profiles of T. urticae shifting host from lima bean to tomato resembled transcriptional profiles of multi-pesticide-resistant T. urticae populations, suggesting that shared repertoires of detoxification genes are contributing to the defense against plant chemicals and pesticides [11]. Additionally, the feeding of T. urticae on tomato plants increased resistance to several unrelated pesticide classes [11]. Moreover, in the field, herbivore pests have to cope with chemical pressures from both pesticides and a myriad of toxic plant compounds in their diets simultaneously [15]. Therefore, in order to investigate molecular mechanisms of chemical adaptation in a systematic way, in many circumstances, pesticide resistance should be considered in concert with the adaptation to host plants.
Quantitative real-time PCR (qRT-PCR) is an extensively used approach to analyze transcriptional expression of genes involved in all biological processes [17-19]. Compared with other conventional techniques such as northern blotting and in situ hybridization, qRT-PCR has significant advantages including being less labor-intensive, more sensitive, and higher-throughput. For example, qRT-PCR requires much less RNA and has higher sensitivity than northern blotting. Therefore, qRT-PCR remains one of few methods to measure in vivo expression reliably for many tiny organisms (e.g. T. urticae) and genes that have very low transcript expression levels [20]. However, the accuracy of qRT-PCR is influenced by numerous factors, such as integrity of the RNA, variation in efficiency of reverse transcription, efficiency of PCR amplification, and normalization [20]. To avoid potential bias and enhance the reliability and reproducibility of qRT-PCR, it is necessary to design an appropriate normalization strategy for analyzing target genes with the most stable reference gene(s) across various experimental conditions [18, 20]. The reference genes, known as housekeeping genes, are involved in basic, ubiquitous cellular functions and presumed to be expressed in uniform levels under different experimental conditions [21]. However, accumulated evidences have shown that there is no single 'universal' reference gene having stable expression in all cell types in each experimental condition [17, 21-25]. Therefore, the stability of reference genes must be validated for each specific experimental condition in each species. It has also been documented that the normalization using an inappropriate single reference gene may lead to substantial errors [19, 20, 22, 25]. Two to several validated stable reference genes are often recommended for the most accurate qRT-PCR normalization.
In this study, we evaluated and identified the most reliable reference genes for qRT-PCR analysis of xenobiotic adaptation in T. urticae. We chose eight commonly used housekeeping genes as candidates. The qRT-PCR data for these genes were evaluated from seven populations: a susceptible population feeding on lima beans, three resistant populations selected from the susceptible population with abamectin, bifenazate, or bifenthrin, and three other susceptible populations shifted host from lima beans to peppers, roses, or potatoes. The stability of the candidate reference genes was assessed with four algorithms, the comparative ΔCt method, geNorm, NormFinder, and Bestkeeper. Additionally, we used the online web-based tool RefFinder [26] to assign an overall final rank for each candidate gene.
Materials and Methods
Mite rearing and selection for acaricide resistance
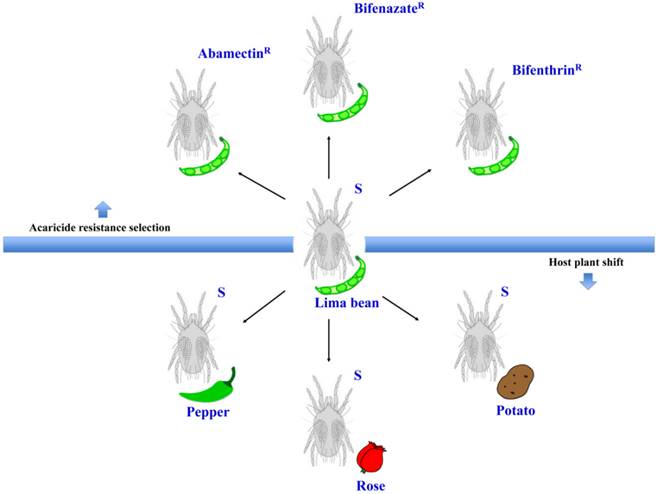
Mites were reared on lima bean plants (Phaseolus lunatus L.) at 25 ± 2°C, 70 ± 5% RH, and a photoperiod of 16:8 (L:D) h in a fine mesh BugDorm insect cage (MegaView Science Co., Ltd., Taiwan, China) inside an isolated walk-in growth chamber at Washington State University in Pullman, WA. New, healthy, 2-week post-germination lima bean plants were provided for the spider mites every 14 days. The susceptible strain was originally collected from weeds in Montana in 1995 [6] and has been maintained in laboratory ever since. We used these susceptible mites to select for populations that are resistant to three acaricides: abamectin, bifenazate, and bifenthrin (Figure 1). Selection occurred from October 2013 to September 2015. About 150 lima bean leaves with feeding mites were dipped into commercial formulations of each acaricide (diluted in distilled water) for 5 seconds. The commercial formulations of these acaricides were Epi-mek® 0.15 EC (2% a.i. Abamectin, Syngenta Crop Protection), Acramite® 50WS (50% a.i. Bifenazate, Chemtura Agro Solutions), and Bifenture® EC (25.1% a.i. Bifenthrin, United Phosphorus). Leaves were then carefully drained of surplus liquid and air-dried on paper towels for about 10 minutes before being moved into plastic containers. After 24 h, the surviving mites were transferred to new lima bean plants in a clean BugDorm insect cage to initiate a new population. This selection procedure was performed every 1-2 months, using increasing concentrations of acaricide that each resulted in approximately 70%-90% mite mortality. The acaricide concentrations for final rounds of selection were 690 mg a.i./L (abamectin), 899 mg a.i./L (bifenazate) and 1200 mg a.i./L (bifenthrin). Bioassays for these acaricide resistant mite populations were performed as described in our previous studies [6]. In brief, leaf disc bioassays were used to calculate the LC50s of abamectin and bifenazate resistant populations. The sticky tape method was used for estimating the LC50 of the bifenthrin resistant population due to the repellent effects of bifenthrin on mites. In the leaf disc bioassay, ten female adult spider mites were located on the abaxial surface of a bean leaf disc (2 cm diameter) with a fine brush. Four leaf discs (2.1 cm diameter) were arranged on water-saturated cotton in a single petri dish (9 cm diameter, 1.5 cm height; Alkali Scientific, Pompano Beach, FL). The perimeter of the leaf disc was surrounded by water-saturated cotton to prevent mites from walking off the disc. In the sticky tape method, ten female adult spider mites were placed abdominal side up on a piece of double-sided sticky Scotch® tape (3 cm x 1.2 cm) sticking on a glass slide (7.5 cm x 2.5 cm). Four to six concentrations of acaricide solutions were serially diluted in distilled water. Leaf discs or glass slides were sprayed with 2 ml of each acaricide solution using a Potter spray tower (Burkard Manufacturing, Richmansworth, Herts, UK). The tower was calibrated to 1.1 kg/cm2 with 2.0 ± 0.1 mg/cm2 spray fluid for each treatment. Spray of distilled water only was used as a control. The treated mites were maintained at 25 ± 2°C, 70 ± 5% RH, and 16:8 (L:D) h for 24 h before recording the mortality. The mites that were not responsive after being touched with a fine camel-hair paintbrush were counted as dead. LC50 values were corrected against the control with Abbott's formula [27] and calculated by log-dose probit analysis (POLO Probit 2014). The resistance ratios were calculated by dividing the LC50 values of the resistant populations by that of the susceptible population toward the same acaricide. Each bioassay was replicated 4-8 times for each acaricide concentration.
Host plant shift
The susceptible T. urticae reared on lima beans (Phaseolus lunatus L.) were transferred to new and healthy pepper (Capsicum annuum; Poblano/Ancho, Bonnie Plants™), rose (Rosa hybrid; mini rose, Por La Mar® Nursery), or potato (Solanum tuberosum L.; Russet Burbank variety) plants (Figure 1). Each new population was kept in a fine mesh BugDorm insect cage. New plants were provided for these populations every 14 days. After 5 generations (about 1.5-2 months), the female adults were collected for RNA extraction.
The experimental conditions for this study. Schematic representation of the different populations generated from the susceptible strain (S) under two different experimental conditions: acaricide resistance selection and host plant shift.
RNA extraction and cDNA synthesis
Total RNA from 300-400 T. urticae female adults per population (Figure 1) was extracted using TRIZOL reagent (Invitrogen) following manufacturer's protocol. RNA integrity was evaluated by gel electrophoresis and spectrometry analysis (NanoDrop 2000, Thermo Scientific). Only RNA with a 260/280nm absorbance ratio between 1.8 and 2.2 was used for further analysis. DNase I (Ambion Inc., Austin, TX) was used to total RNA to remove contaminating DNA. DNA-free RNA was then used as a template for cDNA synthesis by M-MLV reverse transcriptase (Promega, Madison, WI). For each sample, 3 µg DNA-free RNA was used in a 20 µL reaction.
Candidate housekeeping genes
Eight commonly used housekeeping genes were chosen as candidates (Table 1). Primers for qRT-PCR were designed based on the sequences extracted from Online Resource for Community of Annotation of Eukaryotes (http://bioinformatics.psb.ugent.be/orcae/, accessed on June 28th 2016). The cDNA from the susceptible strain (feeding on lima beans) was used as a template for PCR that was performed in a Peltier-Effect thermal cycler (MJ Research, Inc., Canada). PCR was performed using Phusion High-Fidelity DNA Polymerase (Thermo Scientific, Pittsburgh, PA) under the following cycling parameters: 94°C for 3 min 50 s, 35 cycles of 94°C for 30 s, 60°C for 30 s, and 72°C for 1 min, with final extension for 10 min at 72°C. PCR products were purified with DNA Clean & Concentrator (Zymo Research, Irvine, CA) following the manufacturer's protocol. Each individual PCR product was sequenced using ABI BigDye Terminator Version 3.1 cycle sequencing kit (Applied Biosystems, Foster City, CA) on an ABI 3730 at the Molecular Biology and Genomics Core at Washington State University. The obtained sequences were analyzed with BioEdit 7.0.1 software (Ibis Biosciences, Carlsbad, CA) to confirm sequence identities.
Quantitative real-time PCR (qRT-PCR)
qRT-PCR was performed on a CFX96™ Real-Time PCR Detection System (Bio-Rad Laboratories, Hercules, CA). Each reaction contained 5.0 μL iQ™ 2 x SYBR Green Supermix (Bio-Rad Laboratories, Hercules, CA), 1.0 μL of cDNA, 3.6 μL ddH2O, and 0.4 μL forward and reverse primers (Table 1, 10 μM). An optimized program was used: initial incubation of 95°C for 3 min, 40 cycles of denaturation at 95°C for 10 s, annealing/extension at 60°C for 30 s, and followed by a final melting curve cycle of 95°C for 10 s, 65°C for 5 s, and 95°C for 10 s. The reactions were set up in a 96-well full-skirted PCR plate (USA Scientific, Ocala, FL) with three technical replicates and three or four biological replicates. Three negative (no-template) controls were included in each plate.
The standard curve for each gene was generated from a linear regression equation with a slope and square of the correlation coefficient (R2) through serial five-fold dilutions of cDNA from the susceptible population (feeding on lima beans). The PCR efficiency (E) for each primer set was determined based on the slope of the standard curve with the equation: E%= (10[-1/slope] -1) x 100%. Both PCR efficiency and R2 values were taken into consideration in evaluating the primers. Primer pairs with PCR efficiency lower than 94% or higher than 110%, or R2 values < 0.99, were excluded from further analysis.
Statistical analysis
The threshold cycle numbers (Ct values) of selected candidate housekeeping genes under experimental conditions were analyzed and evaluated for stability across experimental conditions using the following algorithms: the comparative ΔCt method [24], geNorm [22], NormFinder [23], and BestKeeper [28]. The comparative ΔCt method is used to identify useful housekeeping genes by comparing the relative expression of gene pairs within each sample [24]. The most stable reference genes are associated with the lowest standard deviations of ΔCt when these genes are compared with the other reference genes. The geNorm algorithm calculates an expression stability value (M) for each gene based on geometric mean. The genes with the lowest M values have the most stable expression [22]. The geNorm 3.5 used in this study is an Excel-based software that requires Microsoft Excel version 2000, XP or 2003 on a Windows platform. To load the expression data matrix, the Ct values were transformed to quantities in a linear value using the formula 2ΔCt, where ΔCt = the minimum Ct value - Ct value of samples in the experiment following the geNorm manual (http://medgen.ugent.be/~jvdesomp/genorm/geNorm_manual.pdf, accessed on June 28th, 2016). Currently, a much improved geNorm module is incorporated into qbase+ software for qRT-PCR data analysis (https://genorm.cmgg.be, accessed on June 28th, 2016). Additionally, the geNorm program calculates the optimal number of reference genes for valid normalization of qRT-PCR by performing a pair-wise comparison (Vn/n+1) between two sequential normalization factors (NFn and NFn+1) of samples within or between experimental conditions. A large variation (Vn/n+1 >0.15) suggests that the added gene is required for reliable normalization. If the Vn/n+1 value is lower than the 0.15 cut-off value, an additional reference gene will not significantly improve the normalization [22]. The strategy of NormFinder algorithm is based on a mathematical model of gene expression and a solid statistical analysis to estimate gene expression stability by considering both intragroup and intergroup variations [23]. The NormFinder_0953.xla is an Excel Add-In that introduces the NormFinder function into Microsoft Excel software package (http://moma.dk/normfinder-software, accessed on June 28th, 2016). To input the expression data for NormFinder analysis, the Ct values were transformed to quantities using the formula 2ΔCt. The most stable genes within and between groups are genes with the lowest stability values. NormFinder software also identifies the best combination of two reference genes under different experimental conditions [23]. The BestKeeper program is an Excel-based tool using pairwise correlations (http://www.gene-quantification.com/bestkeeper.html, accessed on June 28th, 2016) [28]. The Ct values and PCR efficiency were loaded into the program directly following the user manual.
The results of these analyses were then evaluated using the online web-based tool RefFinder (http://fulxie.0fees.us/?type=reference, accessed on June 28th, 2016) [26] to assign an overall final rank for each primer set according to geometric means of weight of an individual candidate gene from each program above.
Results
Laboratory-selection for resistance to three acaricides
Three acaricide resistant populations were established through exposure of the susceptible mite population to increasing levels of acaricides during a 2-year period. The abamectin resistant population (AbamectinR) exhibited 1539-fold higher resistance to Epi-Mex than the susceptible strain (Table 2). The bifenazate resistant population (BifenazateR) exhibited 189-fold higher resistance to Acramite than the susceptible strain (Table 2). The bifenthrin resistant population (BifenthrinR) exhibited 253-fold higher resistance to Bifenthrin than the susceptible strain (Table 2).
Candidate housekeeping gene selection
The PCR efficiency and R2 (square of the correlation coefficient) value of 8 housekeeping genes were evaluated (Table 1). The primer pair Rps18 was excluded from further analysis because it had a PCR efficiency higher than 110% and R2 value < 0.99 (see Materials and Methods). The PCR products of the seven other selected housekeeping genes were amplified under conditions as described in Materials and Methods and resolved on an agarose gel (Supplementary Material: Figure S1A). These amplified PCR products were then sequenced, and all showed 100% identity with the corresponding sequences deposited in the T. urticae genome database (http://bioinformatics.psb.ugent.be/orcae/, accessed on June 28th 2016). The melting curve of each of these seven genes showed a single peak (Supplementary Material: Figure S1B), indicating there was not any non-specific amplification of these primer sets under our PCR conditions.
Primer information for qRT-PCR analysis.
| Gene symbol | Gene name | Gene ID | Primer sequence (5'→ 3') | Amplicon (bp) | E (%) | R2 |
|---|---|---|---|---|---|---|
| Actin | Actin | tetur03g09480 | F: GCCATCCTTCGTTTGGATTTGGCT R: TCTCGGACAATTTCTCGCTCAGCA | 113 | 98 | 0.99 |
| Rp49 | Ribosomal protein 49 | tetur18g03590 | F: CTTCAAGCGGCATCAGAGC R: CGCATCTGACCCTTGAACTTC | 105 | 97 | 0.99 |
| GAPDH | Glyceraldehyde-3-phosphate dehydrogenase | tetur25g00250 | F: AAACATTATCCCTGCCGCTAC R: AGGAACTGGAACACGGAAAGC | 103 | 97 | 0.99 |
| Rps18 | 28S ribosomal protein S18b, mitochondrial precursor | tetur01g03280 | F: AACTGGCGCCTAGTATTGATGC R: CTCCACTCGCATCGACTTCTTC | 120 | 184 | 0.87 |
| TUB | α-tubulin | tetur03g00230 | F: GGTCAAGCTGGTGTCCAAATG R: AGGCATTTGACCATCAGGTTG | 84 | 101 | 0.99 |
| CycA | Cyclophilin A | tetur01g12670 | F: CTTCAAGGCGGTGACTTTACC R: CCATTGAAAGGATACCTGGTCC | 118 | 96 | 1.00 |
| Ef1α | Elongation factor 1-alpha | tetur08g02980 | F: AAGGTTCCTTCAAGTATGCCTGG R: GTGACCAGGAGCATCAATAACGG | 134 | 94 | 1.00 |
| Rpl18 | Ribosomal protein L18 | tetur31g00160 | F: CTTGCAAACACTTTGGTCCAGCTC R: TAACCACGACTGGCTCTTCGTC | 115 | 94 | 0.99 |
Baseline toxicity of acaricides in three T. urticae populations selected from a susceptible population.
| Population | Field rate (mg a.i./L) | N | LC50 (mg a.i./L) | 95% CI | Slope±SEM | Bioassay method | χ2 | df | LC50 of Susceptiblea) (mg a.i./L) | RRb) |
|---|---|---|---|---|---|---|---|---|---|---|
| AbamectinR | 23 | 389 | 354 | 226-1254 | 1.93±0.27 | Leaf disc | 2.39 | 2 | 0.23 | 1539 |
| BifenazateR | 899 | 526 | 155 | 83-280 | 1.22±0.10 | Leaf disc | 14.80 | 5 | 0.82 | 189 |
| BifenthrinR | 120 | 180 | 4539 | 3263-6150 | 2.08±0.31 | Sticky tape | 1.03 | 2 | 17.97 | 253 |
a)The baseline toxicity of the susceptible population was reported in Piraneo et al. 2015 [6]
b)RR- resistance ratio
Expression profiles of selected candidate housekeeping genes
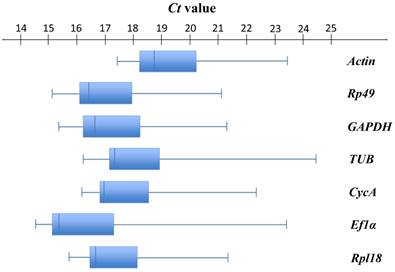
As shown in Figure 2, seven selected candidate housekeeping genes had a narrow range of Ct values across all samples with the median Ct values varying from 15.42 (Ef1α) to 18.70 (Actin). Among these genes, Ef1α (median Ct = 15.42) was the most abundantly expressed gene, followed by Rp49 (median Ct = 16.41). The least expressed gene was Actin (median Ct = 18.70) (Figure S1, Table S1). Actin had the least variable expression reflected by the lowest SD value (1.41). Ef1α had the most variable expression (SD = 2.31) (Table S1).
Expression profiles of candidate housekeeping genes in T. urticae. Box-and-whisker plots show the expression levels of 7 candidate housekeeping genes in the total 84 samples documented in terms of the cycle threshold number (Ct value). The box represents the interquartile range (25th-75th percentiles). The line within a box stands for the median. The left and right whiskers on each box represent the lowest and the highest values, respectively.
Rank of selected candidate housekeeping genes
ΔCt analysis
The comparative ΔCt method was used to identify the most stable reference genes that had the lowest standard deviations of Ct values among populations [24]. Examining the effects of acaricide resistance selection alone, the order of gene expression stability from the most to the least stable reference gene was: CycA > GAPDH > Rp49 > Rpl18 > TUB > Actin > Ef1α (Table 3, Table S2). Among mite populations feeding on different host plants and across both experimental conditions, the order of gene expression stability was: GAPDH > CycA > Rp49 > Rpl18 > TUB > Ef1α > Actin (Table 3, Table S2). Across both experimental conditions, the ΔCt method indicated that GAPDH was the most stable reference gene (Table 3, Table S2). The second most stable reference gene was CycA followed by Rp49, Rpl18, and TUB. Ef1a and Actin were the two least stable reference genes (Table 3, Table S2).
geNorm analysis
The geNorm algorithm was used to calculate the average of expression stability (M) values for each selected candidate housekeeping gene based on the geometric means under different experimental conditions. All tested genes exhibited high expression stability with M < 1.05, which is below the default threshold (M < 1.5) recommended by Vandesompele et al [22] (Table 3). With the lowest M value (M = 0.20), Rp49 and Rpl18 were ranked as the most stable reference genes across all experimental conditions. Among diverse acaricide resistance populations, the order of gene expression stability was: Rp49 = Rpl18 > GAPDH > CycA > TUB > Actin > Ef1α. Across mite populations feeding on different host plants and both experimental conditions, the order of gene expression stability was: Rp49 = Rpl18 > CycA > GAPDH > TUB > Ef1α > Actin (Table 3). In all conditions, both Actin and Eflα were identified as the least stable reference genes (Table 3).
NormFinder analysis
The NormFinder method estimated the gene expression stability [Stability Value (SV)] according to both intragroup and intergroup variations of each gene [23]. This method shows less sensitivity to the correlated expression of candidate genes with similar functions than the geNorm method, which tends to select genes with similar expression patterns [22]. Across mite populations with different acaricide resistance, the NormFinder algorithm identified CycA (SV = 0.10) as the most stable reference gene, followed by GAPDH (SV = 0.15). The order of gene expression stability was: CycA > GAPDH > Rp49 > Rpl18 > TUB > Actin > Ef1α (Table 3). Among mite populations feeding on different host plants, GAPDH (SV = 0.20) was ranked as the most stable reference gene, followed by CycA (SV = 0.44). The order of gene expression stability was: GAPDH > CycA > Rp49 > Rpl18 > TUB > Ef1α > Actin (Table 3). Across both experimental conditions, the overall stability rank from the most to the least stable was: GAPDH > CycA > Rp49 > Rpl18 > TUB > Ef1α > Actin (Table 3).
BestKeeper analysis
BestKeeper calculates expression stability of each housekeeping gene and inter-housekeeping gene relations through numerous pair-wise correlation analyses [28]. The most stable reference genes are considered to be those with the highest Pearson correlation coefficients or lowest standard deviations. Across all samples, GAPDH had the highest Pearson correlation coefficient and was identified as the most stable reference gene by BestKeeper (Table 3). Among mite populations with different acaricide resistance, the order of gene expression stability was: GAPDH > CycA > Rp49 > Actin > Rpl18 > TUB > Ef1α (Table 3, Table S3). Across mite populations feeding on different host plants, the order of gene expression stability was: GAPDH > Ef1α > CycA > TUB > Rp49 > Rpl18 > Actin (Table 3, Table S3). Across both experimental conditions, the overall order of gene expression stability from the most to the least stable reference gene was GAPDH > CycA > Ef1α > Rp49 > Rpl18 > TUB > Actin (Table 3, Table S3).
Comprehensive ranking of RefFinder
The online web-based tool RefFinder was used to assign the overall final rank through calculating the geometric means of weight of an individual candidate gene from each program above [26]. The Ct values were directly loaded into the RefFinder program. According to RefFinder, GAPDH (GM = 2.11) was the most stable reference gene across both experimental conditions, which was consistent with the rankings from comparative ΔCt, NormFinder, and BestKeeper methods. Ef1α (GM = 6.24) was ranked as the least stable reference gene (Table 3). Across populations with different acaricide resistance, the order of gene expression stability was: CycA > Rp49 > GAPDH > Rpl18 > TUB > Ef1α > Actin (Table 3). Across populations feeding on different host plants, the order of gene expression stability was: GAPDH > Rp49 > Rpl18 > CycA > Actin > TUB > Ef1α (Table 3). The comprehensive ranking of candidate reference genes (from the most to the least stable) was: GAPDH > Rp49 > Rpl18 > CycA > Actin > TUB > Ef1α (Table 3).
Rank of the candidate housekeeping genes of T. urticae under different experimental conditions.
| Experimental condition | Rank | RefFinder | ΔCt | geNorm | NormFinder | BestKeeper | |||||
|---|---|---|---|---|---|---|---|---|---|---|---|
| Gene | GMa) | Gene | SDb) | Gene | Mc) | Gene | SVd) | Gene | re) | ||
| Acaricide resistance selection | 1 | CycA | 1.86 | CycA | 0.27 | Rp49/Rpl18 | 0.20 | CycA | 0.10 | GAPDH | 0.911 |
| 2 | Rp49 | 2.56 | GAPDH | 0.28 | - | - | GAPDH | 0.15 | CycA | 0.894 | |
| 3 | GAPDH | 2.63 | Rp49 | 0.29 | GAPDH | 0.21 | Rp49 | 0.19 | Rp49 | 0.858 | |
| 4 | Rpl18 | 3.13 | Rpl18 | 0.32 | CycA | 0.22 | Rpl18 | 0.24 | Actin | 0.828 | |
| 5 | TUB | 3.34 | TUB | 0.34 | TUB | 0.27 | TUB | 0.26 | Rpl18 | 0.790 | |
| 6 | Ef1α | 5.12 | Actin | 0.37 | Actin | 0.30 | Actin | 0.31 | TUB | 0.504 | |
| 7 | Actin | 6.24 | Ef1α | 0.37 | Ef1α | 0.32 | Ef1α | 0.31 | Ef1α | 0.332 | |
| Host plant shift | 1 | GAPDH | 2.00 | GAPDH | 0.82 | Rp49/Rpl18 | 0.10 | GAPDH | 0.20 | GAPDH | 0.989 |
| 2 | Rp49 | 2.06 | CycA | 0.87 | - | - | CycA | 0.44 | Ef1α | 0.980 | |
| 3 | Rpl18 | 2.63 | Rp49 | 0.87 | CycA | 0.34 | Rp49 | 0.62 | CycA | 0.973 | |
| 4 | CycA | 2.78 | Rpl18 | 0.88 | GAPDH | 0.42 | Rpl18 | 0.65 | TUB | 0.963 | |
| 5 | Actin | 4.30 | TUB | 1.16 | TUB | 0.75 | TUB | 0.93 | Rp49 | 0.953 | |
| 6 | TUB | 5.23 | Ef1α | 1.26 | Ef1α | 0.90 | Ef1α | 1.08 | Rpl18 | 0.949 | |
| 7 | Ef1α | 6.24 | Actin | 1.36 | Actin | 1.03 | Actin | 1.16 | Actin | 0.838 | |
| Both conditions | 1 | GAPDH | 2.11 | GAPDH | 0.61 | Rp49/Rpl18 | 0.21 | GAPDH | 0.22 | GAPDH | 0.987 |
| 2 | Rp49 | 2.28 | CycA | 0.62 | - | - | CycA | 0.29 | CycA | 0.984 | |
| 3 | Rpl18 | 2.38 | Rp49 | 0.64 | CycA | 0.31 | Rp49 | 0.42 | Ef1α | 0.979 | |
| 4 | CycA | 2.63 | Rpl18 | 0.67 | GAPDH | 0.35 | Rpl18 | 0.47 | Rp49 | 0.973 | |
| 5 | Actin | 4.30 | TUB | 0.82 | TUB | 0.56 | TUB | 0.63 | Rpl18 | 0.969 | |
| 6 | TUB | 5.23 | Ef1α | 0.92 | Ef1α | 0.67 | Ef1α | 0.79 | TUB | 0.967 | |
| 7 | Ef1α | 6.24 | Actin | 1.00 | Actin | 0.76 | Actin | 0.86 | Actin | 0.901 | |
a)GM: Geometric Mean; b) SD: Standard Deviation of comparative ΔCt; c) M: Average of expression stability values; d) SV: Stability Value; e) r: Pearson's correlation coefficient.
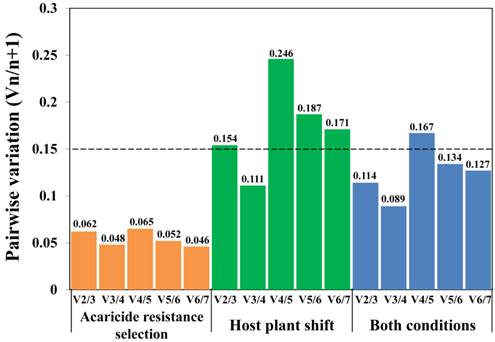
Determination of the optimal number of reference genes for qRT-PCR normalization. Pairwise variation (Vn/n+1) was determined by geNorm program under different experiment conditions. The cut-off value (dashed line), defined as 0.15, indicates whether or not inclusion of additional reference genes would significantly improve the reliability of the normalization factor.
Optimal number of reference genes for qRT-PCR normalization
In order to quantify gene expression levels more accurately, it has been strongly suggested to normalize qRT-PCR data by multiple validated reference genes rather than only a single reference gene [22]. The geNorm program can provide the optimal number of reference genes under each experimental condition through calculating the pairwise variation (Vn/n+1) values [22]. As shown in Figure 3, when analyzing diverse acaricide resistance populations alone, and when all populations were analyzed simultaneously, the V2/3 values were lower than the 0.15 cut-off value, indicating that two reference genes are adequate for accurate qRT-PCR normalization under these conditions. However, the V2/3 value was 0.154 (> 0.15, a cut-off value [22]) when analyzing the host-plant shift populations alone (Figure 3), suggesting the addition of a third reference gene may improve the reliability of normalization.
Discussion
Valid reference gene selection is highly important for accurate and reliable qRT-PCR normalization. Use of a single housekeeping gene without validation of its stability can lead to a greater than 20-fold error in calculations of gene expression [22]. During recent years, a growing number of studies of reference gene suitability have been conducted in humans [29-31], other mammals [32, 33], plants [34-38] as well as arthropods (Table S4). With more and more genomes and transcriptomes available for arthropods, there are at least 45 arthropod species that have been investigated for reference gene identification and selection under diverse experimental conditions. These arthropods consist of various agricultural and urban pests [39-50], beneficial predators [51, 52], pollinators [53-56], and other economically important insects such as silkworm [57] (also see Table S4). Most of these studies compared gene expression across several biotic or abiotic variables, such as developmental stage, tissues type, pesticide exposure, and temperature stress. However, there is no research focusing on the reliable reference genes selection under adaptation to both pesticides and host plant allelochemicals (Table S4). Our study, for the first time, evaluates and identifies the most stable reference genes for populations under xenobiotic stresses from different sources (commercial acaricides vs the effects of feeding on different host plants with unique allelochemical arrays). Among seven candidate housekeeping genes, our study found that CycA and Rp49 were the most stable genes for investigating gene expression in acaricide resistant vs susceptible populations of T. urticae. GAPDH, Rp49, and Rpl18 were found to be the most stable reference genes when evaluating host plant variation. And GAPDH and Rp49, were found to be the best reference genes in investigation of gene expression across both experimental conditions.
The most stable reference genes identified in our study are not the same as those used in previous studies in T. urticae. For example, Actin has been used as a reference gene for gene expression normalization in many studies [6, 11, 58-61]. However, we found Actin expression was highly variable under both experimental conditions (Table 3). Similarly, Actin was never ranked as a suitable reference gene across different developmental stages in T. urticae [62], or across different developmental stages and abiotic stresses in other mite species T. cinnabarinus [63] and Panonychus citri [64]. Actin also showed extreme variation in expression throughout developmental stages of the silkworm Bombyx mori [57], and in different physiological conditions in the whitefly Bemisia tabaci [65]. In contrast, RP49, which has also been used in previous studies, was ranked as the second most stable reference gene across all experimental conditions in our study (Table 3). Lourenco et al. and van Heil et al. also identified RP49 as the most reliable reference gene in Apis mellifera [54] and Schistocera gregaria [39].
Our study identified GAPDH as one of the most stable reference genes (Table 3). However, GAPDH has never been used as a reference gene in previous studies of T. urticae gene expression [6, 11, 58-61]. GAPDH was identified as one of the most stably expressed reference genes in several other arthropod species, including Bombus terrestris and Bombus lucorum [56], P. citri [64], A. mellifera [55], Spodoptera litura [66], Hippodamia convergens [51], and Helicoverpa armigera [50]. In this study, CycA was identified as the most stable reference gene across populations with different levels of acaricide resistance, but it was not among the top three candidates across host plant shifts, or across both conditions (Table 3). CycA has also been identified as the most reliable reference gene in other animal [67] and human [68-70] experiments.
Based on our results, the rankings of the candidate reference genes are very similar under the acaricide resistance selection, host plant shift condition, and a combination of both conditions according to the comparative ΔCt method, geNorm, and NormFinder (Table 3). Among seven tested housekeeping genes, Rp49, Rpl18, GAPDH, and CycA were ranked as the four most stable genes by the comparative ΔCt method, geNorm, and NormFinder, although the orders exhibited slight differences from method to method. These three programs also provided a similar rank for the least reliable reference genes under all three conditions: TUB, Ef1α, and Actin. However, BestKeeper recommended a different rank for these candidate reference genes, highlighting the difference in the BestKeeper algorithm [24, 50]. By assessing an appropriate weight of each candidate gene and calculating the geometric means of their weights, the RefFinder program provided a final rank for the seven candidate reference genes. Interestingly, except for a slight difference in the order of the most and least stable reference genes in acaricide resistance selection, the orders of stability of these genes shares a high similarity across all experimental conditions, further suggesting the potential correlation between pesticide resistance and host plant adaptation.
Recently, increasing evidence has suggested that there are no universal reference genes that are suitable for all experimental conditions in all species. In the same species, the best reference gene sets can vary significantly under different biotic and abiotic conditions [46, 65]. Even under a single experimental condition (e.g. insecticide treatment), different stable reference genes may be selected among intra- and inter-classes of insecticides [71], indicating the necessity of identifying appropriate reference genes for each experimental condition in each species. However, in some circumstances, it may be useful to identify reference genes that are stable across a range of conditions. For example, in order to monitor the acaricide resistance in T. urticae in the field, different field populations may have developed resistance to different acaricides [6, 11], as well as having undergone different host plant shifts among various crops prior to being collected. Therefore, in order to accurately calculate the transcriptional expression of genes involved in chemical adaptation in the field, the stability of reference genes to both pesticide exposure and host plant shift should be evaluated.
In conclusion, our study selected the best reference genes under conditions of acaricide selection pressure and host plant shifting. These data will allow accurate qRT-PCR normalization in expression studies of genes involved in adaptation of T. urticae to xenobiotics, and will certainly facilitate molecular mechanisms and functional genomics research of this notorious agricultural pest.
Supplementary Material
Supplementary tables and figures.
Abbreviations
qRT-PCR: Quantitative Real-Time PCR; R: Correlation coefficient; E: PCR efficiency; GM: Geometric Mean; SV: Stability Value.
Acknowledgements
We are grateful to Dr. Hiroki Gotoh, Danielle Jackson, and Christina Nguyen (Washington State University) for their technical assistance. We thank Timothy W. Moural (Washington State University) for his help on English editing. Special thanks go to the editor and three anonymous reviewers for their constructive suggestions on the manuscript. This work was supported by USDA/SCRI (2014-51181-22381), Hop Research Council, and Washington State Commission on Pesticide Registration.
Competing Interests
The authors have declared that no competing interest exists.
References
1. Grbic M, Van Leeuwen T, Clark RM, Rombauts S, Rouze P, Grbic V. et al. The genome of Tetranychus urticae reveals herbivorous pest adaptations. Nature. 2011;479:487-492
2. Van Leeuwen T, Dermauw W, Grbic M, Tirry L, Feyereisen R. Spider mite control and resistance management: does a genome help?. Pest Manag Sci. 2013;69:156-159
3. Agrawal AA. Host-range evolution: adaptation and trade-offs in fitness of mites on ternative hosts. Ecology. 2000;81:500-508
4. Van Leeuwen T, Tirry L, Yamamoto A, Nauen R, Dermauw W. The economic importance of acaricides in the control of phytophagous mites and an update on recent acaricide mode of action research. Pestic Biochem Physiol. 2015;121:12-21
5. Walsh DB, Zalom FG, Shaw DV, Larson KD. Yield reduction caused by twospotted spider mite feeding in an advanced-cycle strawberry breeding population. J Am Soc Hortic Sci. 2002;127:230-237
6. Piraneo TG, Bull J, Morales MA, Lavine LC, Walsh DB, Zhu F. Molecular mechanisms of Tetranychus urticae chemical adaptation in hop fields. Sci Rep. 2015;5:17090
7. Van Leeuwen T, Vontas J, Tsagkarakou A, Dermauw W, Tirry L. Acaricide resistance mechanisms in the two-spotted spider mite Tetranychus urticae and other important Acari: a review. Insect Biochem Mol Biol. 2010;40:563-572
8. Nkya TE, Akhouayri I, Kisinza W, David JP. Impact of environment on mosquito response to pyrethroid insecticides: facts, evidences and prospects. Insect Biochem Mol Biol. 2013;43:407-416
9. Zhu F, Cui Y, Lavine LC, Walsh DB. Application of RNAi toward insecticide resistance management. Chandrasekar R, Tyagi BK, Gui Z, Reeck GR, eds. Manhattan: Academic Publisher. 2014:595-619
10. Zhu F, Moural TW, Nelson DR, Palli SR. A specialist herbivore pest adaptation to xenobiotics through up-regulation of multiple Cytochrome P450s. Sci Rep. 2016;6:20421
11. Dermauw W, Wybouw N, Rombauts S, Menten B, Vontas J, Grbic M. et al. A link between host plant adaptation and pesticide resistance in the polyphagous spider mite Tetranychus urticae. Proc Natl Acad Sci U S A. 2013;110:E113-E122
12. Tao XY, Xue XY, Huang YP, Chen XY, Mao YB. Gossypol-enhanced P450 gene pool contributes to cotton bollworm tolerance to a pyrethroid insecticide. Mol Ecol. 2012;21:4371-4385
13. Liu N, Zhu F, Xu Q, Pridgeon JW, Gao XW. Behavioral change, physiological modification, and metabolic detoxification: mechanisms of insecticide resistance. Acta Entomol Sin. 2006;49:671-679
14. Schuler MA. The role of cytochrome P450 monooxygenases in plant-insect interactions. Plant Physiol. 1996;112:1411-1419
15. Despres L, David JP, Gallet C. The evolutionary ecology of insect resistance to plant chemicals. Trends Ecol Evol. 2007;22:298-307
16. Brattsten LB. Potential role of plant allelochemicals in the development of insecticide resistance. Barbosa P, Letourneau DK, eds. New York, Chichester, Brisbane, Toronto, Singapore: A Wiley-Interscience Publication. 1988:313-348
17. Pfaffl MW. A new mathematical model for relative quantification in real-time RT-PCR. Nucleic Acids Res. 2001;29:e45
18. Bustin SA. Quantification of mRNA using real-time reverse transcription PCR (RT-PCR): trends and problems. J Mol Endocrinol. 2002;29:23-39
19. Bustin SA, Benes V, Garson JA, Hellemans J, Huggett J, Kubista M. et al. The MIQE guidelines: minimum information for publication of quantitative real-time PCR experiments. Clin Chem. 2009;55:611-622
20. Huggett J, Dheda K, Bustin S, Zumla A. Real-time RT-PCR normalisation; strategies and considerations. Genes Immun. 2005;6:279-284
21. Thellin O, Zorzi W, Lakaye B, De Borman B, Coumans B, Hennen G. et al. Housekeeping genes as internal standards: use and limits. J Biotechnol. 1999;75:291-295
22. Vandesompele J, De Preter K, Pattyn F, Poppe B, Van Roy N, De Paepe A. et al. Accurate normalization of real-time quantitative RT-PCR data by geometric averaging of multiple internal control genes. Genome Biol. 2002;3:Research0034
23. Andersen CL, Jensen JL, Orntoft TF. Normalization of real-time quantitative reverse transcription-PCR data: a model-based variance estimation approach to identify genes suited for normalization, applied to bladder and colon cancer data sets. Cancer Res. 2004;64:5245-5250
24. Silver N, Best S, Jiang J, Thein SL. Selection of housekeeping genes for gene expression studies in human reticulocytes using real-time PCR. BMC Mol Biol. 2006;7:33
25. Bustin SA, Benes V, Nolan T, Pfaffl MW. Quantitative real-time RT-PCR - a perspective. J Mol Endocrinol. 2005;34:597-601
26. Xie F, Xiao P, Chen D, Xu L, Zhang B. miRDeepFinder: a miRNA analysis tool for deep sequencing of plant small RNAs. Plant Mol Biol. 2012;80:75-84
27. Abbott WS. A method of computing the effectiveness of an insecticide. J Econ Entomol. 1925;18:265-267
28. Pfaffl MW, Tichopad A, Prgomet C, Neuvians TP. Determination of stable housekeeping genes, differentially regulated target genes and sample integrity: BestKeeper - Excel-based tool using pair-wise correlations. Biotechnol Lett. 2004;26:509-515
29. Zhang X, Ding L, Sandford AJ. Selection of reference genes for gene expression studies in human neutrophils by real-time PCR. BMC Mol Biol. 2005;6:4
30. Coulson DT, Brockbank S, Quinn JG, Murphy S, Ravid R, Irvine GB. et al. Identification of valid reference genes for the normalization of RT qPCR gene expression data in human brain tissue. BMC Mol Biol. 2008;9:46
31. Jacob F, Guertler R, Naim S, Nixdorf S, Fedier A, Hacker NF. et al. Careful selection of reference genes is required for reliable performance of RT-qPCR in human normal and cancer cell lines. PloS One. 2013:8
32. Boda E, Pini A, Hoxha E, Parolisi R, Tempia F. Selection of reference genes for quantitative real-time RT-PCR studies in mouse brain. J Mol Neurosci. 2009;37:238-253
33. An Y, Reimers K, Allmeling C, Liu J, Lazaridis A, Vogt PM. Validation of differential gene expression in muscle engineered from rat groin adipose tissue by quantitative real-time PCR. Biochem Biophys Res Commun. 2012;421:736-742
34. Jian B, Liu B, Bi Y, Hou W, Wu C, Han T. Validation of internal control for gene expression study in soybean by quantitative real-time PCR. BMC Mol Biol. 2008;9:59
35. Paolacci AR, Tanzarella OA, Porceddu E, Ciaffi M. Identification and validation of reference genes for quantitative RT-PCR normalization in wheat. BMC Mol Biol. 2009;10:11
36. Wan H, Zhao Z, Qian C, Sui Y, Malik AA, Chen J. Selection of appropriate reference genes for gene expression studies by quantitative real-time polymerase chain reaction in cucumber. Anal Biochem. 2010;399:257-261
37. Gimeno J, Eattock N, Van Deynze A, Blumwald E. Selection and validation of reference genes for gene expression analysis in switchgrass (Panicum virgatum) using quantitative real-time RT-PCR. PLoS One. 2014;9:e91474
38. Long X, He B, Gao X, Qin Y, Yang J, Fang Y. et al. Validation of reference genes for quantitative real-time PCR during latex regeneration in rubber tree. Gene. 2015;563:190-195
39. Van Hiel MB, Van Wielendaele P, Temmerman L, Van Soest S, Vuerinckx K, Huybrechts R. et al. Identification and validation of housekeeping genes in brains of the desert locust Schistocerca gregaria under different developmental conditions. BMC Mol Biol. 2009;10:56
40. Nijhof AM, Balk JA, Postigo M, Jongejan F. Selection of reference genes for quantitative RT-PCR studies in Rhipicephalus (Boophilus) microplus and Rhipicephalus appendiculatus ticks and determination of the expression profile of Bm86. BMC Mol Biol. 2009;10:112
41. Lord JC, Hartzer K, Toutges M, Oppert B. Evaluation of quantitative PCR reference genes for gene expression studies in Tribolium castaneum after fungal challenge. J Microbiol Methods. 2010;80:219-221
42. Bai H, Zhu F, Shah K, Palli SR. Large-scale RNAi screen of G protein-coupled receptors involved in larval growth, molting and metamorphosis in the red flour beetle. BMC Genomics. 2011;12:388
43. Zhu F, Xu J, Palli R, Ferguson J, Palli SR. Ingested RNA interference for managing the populations of the Colorado potato beetle, Leptinotarsa decemlineata. Pest Manag Sci. 2011;67:175-182
44. Majerowicz D, Alves-Bezerra M, Logullo R, Fonseca-de-Souza AL, Meyer-Fernandes JR, Braz GR. et al. Looking for reference genes for real-time quantitative PCR experiments in Rhodnius prolixus (Hemiptera: Reduviidae). Insect Mol Biol. 2011;20:713-722
45. Zhu F, Sams S, Moural T, Haynes KF, Potter MF, Palli SR. RNA interference of NADPH-cytochrome P450 reductase results in reduced insecticide resistance in the bed bug, Cimex lectularius. PloS One. 2012;7:e31037
46. Li R, Xie W, Wang S, Wu Q, Yang N, Yang X. et al. Reference gene selection for qRT-PCR analysis in the sweetpotato whitefly, Bemisia tabaci (Hemiptera: Aleyrodidae). PloS One. 2013;8:e53006
47. Fu W, Xie W, Zhang Z, Wang S, Wu Q, Liu Y. et al. Exploring valid reference genes for quantitative real-time PCR analysis in Plutella xylostella (Lepidoptera: Plutellidae). Int J Biol Sci. 2013;9:792-802
48. Rodrigues TB, Khajuria C, Wang H, Matz N, Cunha Cardoso D, Valicente FH. et al. Validation of reference housekeeping genes for gene expression studies in western corn rootworm (Diabrotica virgifera virgifera). PLoS One. 2014;9:e109825
49. Yang C, Li H, Pan H, Ma Y, Zhang D, Liu Y. et al. Stable reference gene selection for RT-qPCR analysis in nonviruliferous and viruliferous Frankliniella occidentalis. PLoS One. 2015;10:e0135207
50. Zhang S, An S, Li Z, Wu F, Yang Q, Liu Y. et al. Identification and validation of reference genes for normalization of gene expression analysis using qRT-PCR in Helicoverpa armigera (Lepidoptera: Noctuidae). Gene. 2015;555:393-402
51. Pan H, Yang X, Siegfried BD, Zhou X. A comprehensive selection of reference genes for RT-qPCR analysis in a predatory lady beetle, Hippodamia convergens (Coleoptera: Coccinellidae). PLoS One. 2015;10:e0125868
52. Yang C, Pan H, Noland JE, Zhang D, Zhang Z, Liu Y. et al. Selection of reference genes for RT-qPCR analysis in a predatory biological control agent, Coleomegilla maculata (Coleoptera: Coccinellidae). Sci Rep. 2015;5:18201
53. Scharlaken B, de Graaf DC, Goossens K, Brunain M, Peelman LJ, Jacobs FJ. Reference gene selection for insect expression studies using quantitative real-time PCR: The head of the honeybee, Apis mellifera, after a bacterial challenge. J Insect Sci. 2008;8:33
54. Lourenco AP, Mackert A, Cristino AD, Simoes ZLP. Validation of reference genes for gene expression studies in the honey bee, Apis mellifera, by quantitative real-time RT-PCR. Apidologie. 2008;39:372-U333
55. Reim T, Thamm M, Rolke D, Blenau W, Scheiner R. Suitability of three common reference genes for quantitative real-time PCR in honey bees. Apidologie. 2013;44:342-350
56. Hornakova D, Matouskova P, Kindl J, Valterova I, Pichova I. Selection of reference genes for real-time polymerase chain reaction analysis in tissues from Bombus terrestris and Bombus lucorum of different ages. Anal Biochem. 2010;397:118-120
57. Wang GH, Xia QY, Cheng DJ, Duan J, Zhao P, Chen J. et al. Reference genes identified in the silkworm Bombyx mori during metamorphism based on oligonucleotide microarray and confirmed by qRT-PCR. Insect Sci. 2008;15:405-413
58. Van Leeuwen T, Demaeght P, Osborne EJ, Dermauw W, Gohlke S, Nauen R. et al. Population bulk segregant mapping uncovers resistance mutations and the mode of action of a chitin synthesis inhibitor in arthropods. Proc Natl Acad Sci U S A. 2012;109:4407-4412
59. Wybouw N, Balabanidou V, Ballhorn DJ, Dermauw W, Grbic M, Vontas J. et al. A horizontally transferred cyanase gene in the spider mite Tetranychus urticae is involved in cyanate metabolism and is differentially expressed upon host plant change. Insect Biochem Mol Biol. 2012;42:881-889
60. Riga M, Tsakireli D, Ilias A, Morou E, Myridakis A, Stephanou EG. et al. Abamectin is metabolized by CYP392A16, a cytochrome P450 associated with high levels of acaricide resistance in Tetranychus urticae. Insect Biochem Mol Biol. 2014;46:43-53
61. Riga M, Myridakis A, Tsakireli D, Morou E, Stephanou EG, Nauen R. et al. Functional characterization of the Tetranychus urticae CYP392A11, a cytochrome P450 that hydroxylates the METI acaricides cyenopyrafen and fenpyroximate. Insect Biochem Mol Biol. 2015;65:91-99
62. Yang C, Pan H, Liu Y, Zhou X. Stably expressed housekeeping genes across developmental stages in the two-spotted spider mite, Tetranychus urticae. PLoS One. 2015;10:e0120833
63. Sun W, Jin Y, He L, Lu WC, Li M. Suitable reference gene selection for different strains and developmental stages of the carmine spider mite, Tetranychus cinnabarinus, using quantitative real-time PCR. J Insect Sci. 2010:10
64. Niu JZ, Dou W, Ding TB, Yang LH, Shen GM, Wang JJ. Evaluation of suitable reference genes for quantitative RT-PCR during development and abiotic stress in Panonychus citri (McGregor) (Acari: Tetranychidae). Mol Biol Rep. 2012;39:5841-5849
65. Su Y, He WB, Wang J, Li JM, Liu SS, Wang XW. Selection of endogenous reference genes for gene expression analysis in the Mediterranean species of the Bemisia tabaci (Hemiptera: Aleyrodidae) complex. J Econ Entomol. 2013;106:1446-1455
66. Lu YH, Yuan M, Gao XW, Kang TH, Zhan S, Wan H. et al. Identification and validation of reference genes for gene expression analysis using quantitative PCR in Spodoptera litura (Lepidoptera: Noctuidae). PloS One. 2013:8
67. Nelissen K, Smeets K, Mulder M, Hendriks JJ, Ameloot M. Selection of reference genes for gene expression studies in rat oligodendrocytes using quantitative real time PCR. J Neurosci Methods. 2010;187:78-83
68. Koppelkamm A, Vennemann B, Fracasso T, Lutz-Bonengel S, Schmidt U, Heinrich M. Validation of adequate endogenous reference genes for the normalisation of qPCR gene expression data in human post mortem tissue. Int J Legal Med. 2010;124:371-380
69. Chechi K, Gelinas Y, Mathieu P, Deshaies Y, Richard D. Validation of reference genes for the relative quantification of gene expression in human epicardial adipose tissue. PLoS One. 2012;7:e32265
70. Swijsen A, Nelissen K, Janssen D, Rigo JM, Hoogland G. Validation of reference genes for quantitative real-time PCR studies in the dentate gyrus after experimental febrile seizures. BMC Res Notes. 2012;5:685
71. Liang P, Guo Y, Zhou X, Gao X. Expression profiling in Bemisia tabaci under insecticide treatment: indicating the necessity for custom reference gene selection. PLoS One. 2014;9:e87514
Author contact
![]() Corresponding author: Dr. Fang Zhu, Department of Entomology, Washington State University, Pullman, WA, 99164 USA. Phone: +1- 509-335-0480 Fax: +1- 509-335-1009 Email: fang.zhuedu.
Corresponding author: Dr. Fang Zhu, Department of Entomology, Washington State University, Pullman, WA, 99164 USA. Phone: +1- 509-335-0480 Fax: +1- 509-335-1009 Email: fang.zhuedu.
Received 2016-5-29
Accepted 2016-7-8
Published 2016-8-8