ISSN: 1449-2288International Journal of Biological Sciences

Int J Biol Sci 2018; 14(10):1256-1267. doi:10.7150/ijbs.27100 This issue Cite
Research Paper
TIMMDC1 Knockdown Inhibits Growth and Metastasis of Gastric Cancer Cells through Metabolic Inhibition and AKT/GSK3β/β-Catenin Signaling Pathway
Yuan Liu1, Yuyan Huang1, Jingjing Zhang1, Cao Pei1, Jiahui Hu1, Jianxin Lyu1,2 ![]() , Yao Shen1
, Yao Shen1 ![]()
1. Key Laboratory of Laboratory Medicine, Ministry of Education, and Zhejiang Provincial Key Laboratory of Medical Genetics, School of Laboratory Medicine and Life sciences, Wenzhou Medical University, Wenzhou, China, 325035
2. Laboratory Medicine College, Hangzhou Medical College, Hangzhou, Zhejiang 310053, P. R. China
Abstract

TIMMDC1 (C3orf1), a predicted 4-pass membrane protein, which locates in the mitochondrial inner membrane, has been demonstrated to have association with multiple member of mitochondrial complex I assembly factors and core mitochondrial complex I subunits. The expression level of TIMMDC1 in highly-metastatic tumor cells is higher than that in lowly- metastatic tumor cells. However, the role of TIMMDC1 in human gastric cancer progression is unclear. In this study, human gastric cancer cells SGC-7901 and BGC-823 cells were used, and TIMMDC1 was knockdown with small interfering RNA. The data showed that TIMMDC1 knockdown caused inhibitory effects on the cell proliferation in vitro and tumor progression in vivo. Knockdown of TIMMDC1 significantly and exclusively reduced the activity of mitochondrial complex I but not complex II~ IV, and caused an obvious inhibition in mitochondrial respiration and ATP-linked oxygen consumption. Besides, the glycolysis pathway was also attenuated by TIMMDC1 knockdown, and the ATP content in the group of shTIMMDC1 cells was significantly lower than that in the shCont cells. The expression levels of phosphoylated AKT(Ser473) and GSK-3β (Ser9), as well as the downstream protein β-catenin and c-Myc were also markedly reduced in the group of shTIMMDC1 cells. Taken together, these findings suggest that TIMMDC1 may play an important role in human gastric cancer development, and its underlying mechanism is not only associated with mitochondrial complex I inhibition and reduced mitochondrial respiration, but is also associated with reduced glycolysis activity and the AKT/GSK3β/β-catenin signaling pathways.
Keywords: Human gastric cancer cells, TIMMDC1, Complex, Mitochondrial respiration, Glycolysis, AKT
Introduction
Although many cancer cells exhibit enhanced Warburg effect, which is a high rate of glycolysis followed by lactic acid fermentation in the cytosol even in the presence of ample oxygen, mitochondrial metabolism is also essential for cancer proliferation [1]. Studies also provided powerful evidences that mitochondrial metabolism is important for tumorigenesis and metastasis [2,3]. In breast cancer cells, mitochondrial content and oxidative phosphorylation level are found to be markedly increased [3]. Switching of bioenergetics from aerobic glycolysis to mitochondrial oxidative phosphorylation increases tumor resistance to apoptosis [4] and radiation [5]. Thus, inhibiting the mitochondrial respiration together with aerobic glycolysis can enhance the efficiency of current anti-cancer therapy.
TIMMDC1 (also named C3orf1), a predicted 4-pass membrane protein, belongs to the TIM17-TIM22-TIM23 family which mediates the transport of nuclear-encode proteins across and into inner mitochondrial membranes. Recent studies found that TIMMDC1 is associated with multiple members of mitochondrial complex I assembly (MCIA) factor and core complex I subunits. Depletion of TIMMDC1 resulted in decreased stability of several complex I subunits, complex I activity and cellular respiration in HeLa cells [6,7]. Up-regulation of TIMMDC1 expression has been reported in some cancer cell lines with high metastatic potential [8]. In some recent studies, investigators have observed an association between mitochondrial complex I and tumorigenesis. Inhibition of complex I leads to a reduction in the efficiency of the electron transport chain and oxidative mitochondrial metabolism, and then results in an inhibition of tumor growth [9]. Recent studies suggest that the anti-diabetic drug metformin prevents cancer progression, and the underlying mechanism may be due to its inhibitory action on mitochondrial complex I activity and cellular respiration [10]. Thus, it seems that mitochondrial complex I and TIMMDC1 may be potential therapeutic targets for cancer treatment. However, the role of TIMMDC1 in the progression of human gastric cancer and its underlying mechanism remain unclear.
Therefore, this study was designed to explore the role of TIMMDC1 in the growth and metastasis of human gastric cancer and its underlying mechanisms. Our data showed that downregulation of TIMMDC1 decreases the activity of mitochondrial complex I and mitochondrial respiration, as well as glycolytic activity. Downregulation of TIMMDC1 also reduced ROS production and inactivated the AKT/GSK3β signaling leading to β-catenin degradation. This study provides in vitro as well as in vivo evidences that TIMMDC1 knockdown inhibits human gastric cancer cells growth and metastasis.
Materials and Methods
Reagents
Rotenone, carbonyl cyanide ptrifluoromethoxyphenyl- hydrazone (FCCP), oligomycin, and 2-deoxy-D-glucose (2-DG) were from Sigma (St Louis, MO). Dulbecco's modified Eagle's medium (DMEM) was from Gibco (USA). Fetal bovine serum (FBS) was from NATOCOR (Argentina). Cell Counting Kit-8 (CCK-8), BCA protein assay kit, ATP assay kit, ROS assay kit and crystal violet dye were obtained from Beyotime Institute of Biotechnology (Nanjing, China). XF assay medium and XF calibrant solution were obtained from Seahorse Bioscience (USA). RNA Extraction Kit, PrimeScript RT reagent kit, and SYBR Premix Ex Taq were from TakaRa Biotechnology (Dalian) Co, Ltd (Dalian, China).
Animals
All experiments using animals were performed in accordance with the National Institutes of Health Guide for the Care and Use of Laboratory Animals. Male nude mice of the age of 3-4 weeks (10-12g) were used, and they were purchased from Shanghai SLAC Laboratory Animal Co., Ltd (Shanghai, China, approval No. SCXK 2012-0002). The animals had access to standard chow and received water ad libitum.
Cell culture and transfections
Human gastric cancer cell line SGC-7901 and BGC-823 were obtained from the Institute of Cell Biology, Chinese Academy of Sciences (Shanghai) and China Center for Type Culture Collection, CCTCC (Wuhan), respectively. Cells were cultured in DMEM supplemented with 10% FBS and antibiotics (100 U/mL penicillin G and 100 μg/mL streptomycin) at 37°C in a humidified atmosphere of 5% CO2. The cell lines SGC-7901 and BGC-823 were transfected with small interfering (si) RNAs (TIMMDC1-siRNA or nonsilencing control siRNA) using Lipofectamine 3000 (Invitrogen) according to manufacturer's instructions.
Quantitative real-time polymerase chain reaction (PCR)
Total RNA was isolated with Trizol reagent according to the manufacturer's guidelines and was quantified by Nanodrop spectrophotometry. cDNA was synthesized from 2 μg total RNA using the PrimeScript RT reagent kit according to the manufacturer's instructions. Real-time quantification PCRs of TIMMDC was performed using SYBR Premix Ex Taq. All expression values of target genes were calculated using the 2-ΔΔCt method [11,12]. The primers used for the experiment were as follows: TIMMDC1 (Fw: 5'-AGTTACTGAGCACCTCCCT-3'; Rev: 5'-GCATTCAT CGGACATGGCAG-3'), β-actin (Fw: 5'-CCCTGGCACCCAGC AC-3'; Rev: 5'-GCC GATCCACACGGAGTAC-3').
Western blot analysis
The cells were collected and lysed in Western and IP lysis buffer containing PMSF for 5 min on ice, followed by centrifugation at 13,000 × g for 25 min at 4°C. The supernatant was harvested, and the protein concentration was quantified using a BCA protein assay kit. Western blot analysis was carried out by standard protocol. The following antibodies were used: rabbit anti-TIMMDC1 antibody (1:1000), rabbit anti-Phospho-AKT antibody (1:1000), rabbit anti-Phospho-GSK-3β antibody (1:1000), rabbit anti-β-catenin antibody (1:1000), rabbit anti-AKT antibody (1:1000), rabbit anti-GSK-3β (1:1000), rabbit anti-c-Myc antibody (1:1000) were from Abcam Inc. Mouse anti-β-actin antibody (1:1000, AA128), HRP-labeled goat anti-rabbit IgG (1:500, A0208), and HRP-labeled goat anti-mouse IgG (1:500, A0216) were from Beyotime Institute of Biotechnology (Nanjing, China).
Cell proliferation assay
SGC-7901 and BGC-823 cells in the control, shCont and shTIMMDC1 group were plated onto 96-well plates at a equal density of 3 × 10³ cells/well. From the second day after plating, the Cell Counting Kit-8 (CCK-8) was used to examine cell proliferation once daily for 6 days according to the manufacturer's protocol.
Wound healing assay
SGC-7901 and BGC-823 cells were seeded in 6-well plates with a density of 90% confluent. The resulting confluent cell monolayers were scratched with a sterile 200µl-pipette tip. After scratching, cells were washed 3 times with PBS. The plates were filled with culture medium supplemented with 2% serum to induce cell migration. The cells were photographed for quantification of closure of the exposed area. Every 24 h, the cell migration was observed by microscope.The denuded area closure was calculated by (Denuded distance 0 h - Denuded distance Endpoint) /Denuded distance 0 h.
Cell migration and invasion assay
Cell invasion assay was performed using BD Biocoat Matrigel Invasion Chambers (BD Biosciences, Bedford, MA) following the manufacturer's recommendations. Briefly, SGC-7901cells and BGC-823 cells were trypsinized and resuspended in serum-free DMEM medium and placed in the upper chamber of transwell inserts (5×10⁴ cells/well). DMEM medium containing 10% FBS was placed in the lower chamber. Cells were incubated for 48 h in a humidified atmosphere with 95% air and 5% CO2 at 37°C. Invasive cells were fixed and stained with crystal violet dye. Noninvasive cells in the upper chamber were removed by wiping with a cotton swab. Cells on the lower surface of the insert that had penetrated. Matrigel were counted in five randomly selected high-power fields via a light microscope. Each experiment was performed in triplicate. Cell migration assays using BD Biocoat Matrigel Invasion Chambers were also performed with SGC-7901cells and BGC-823 cells, but without the Matrigel inserts.
In vivo cell growth and metastasis assay
For the cancer cell growth assay, SGC-7901 cells infected with shTIMMDC1 plasmid and corresponding mock plasmid were transplanted into node mice (5 node mice per group, 2 ×10⁶ cells for each mouse) subcutaneously. Xenografts were measured three times a week and the tumor volume was calculated by 0.5 × L × W2 (L, length; W, width). The mice were sacrificed after three weeks. For metastasis assays, SGC-7901 cells infected with shTIMMDC1 plasmid and corresponding mock plasmid were transplanted into node mice (5 per group, 2 ×10⁶ cells for each mouse) through the lateral tail vein. After 4 weeks, mice were sacrificed and their lungs were removed and subjected to hematoxylin and eosin (HE) staining, Metastatic lung nodules were counted and were further confirmed by using a dissecting microscope.
Determination of ATP production
The ATP assay was performed according to the instruction of ATP assay kit. In brief, the cells were harvested and lysed with a lysis buffer, followed by centrifugation at 10 000 × g for 2 minutes at 4 °C. In 96-well plates, the level of ATP was determined by mixing 20 µl of the supernatant with 100 µl of luciferase reagent, which catalyzed the light production from ATP and luciferin. Luminance was measured by a monochromator microplate reader. Standard curves were also generated and the protein concentration of each treatment group was determined using the BCA protein assay kit. Total ATP levels were expressed as nmol/mg protein.
Isolation and purification of mitochondria
The cells were collected and homogenized in precooled homogenization buffer (0.25 M sucrose, 10 mM HEPES-NaOH, pH 7.4, 1 mM EDTA). Crude mitochondria were enriched by differential centrifugation and were further purified by centrifugation in a 30% to 55% sucrose density gradient at 135 000 × g for 15 minutes. Mitochondria fraction was collected at the interface of 40%/55% density and resuspended in mitochondria extraction buffer. An additional centrifugation at 12, 000 × g for 30 minutes was carried out to get the final purified mitochondria pellet [13].
Mitochondrial electron transport chain (ETC) complexes activity assays
Mitochondrial respiratory chain enzymatic activities (complexes I-IV) were assessed as previously described [14] with slight modification:
Complex I activity: Prepared mitochondria (2 µl; 2 μg/µl) were added to the assay medium and the baseline was read at 340 nm for 2 minutes. Ubiquinone 1 (1µl; 5 mM) was applied and the decrease in absorbance was recorded at 340 nm for 2 minutes. In parallel, the same quantity of reagents and samples but with the addition of rotenone solution (1µl; 1 mM) was used.
Complex II activity: Prepared mitochondria (2 µl; 2 μg/µl) were added to the assay medium and the mixture was incubated at 37°C for 8 minutes and then the baseline was recorded at 600 nm for 2 minutes. Then DUB (1µl;5 mM) was applied and the decrease in absorbance at 600 nm was recorded for 2 minutes. In parallel, malonate (1µl; 1 M) was used.
Complex III activity: Prepared mitochondria (2µl; 2 μg/μL) were added to the assay medium. After reading the baseline at 550 nm for 2 minutes, decylubiquinol (1µl;5 mM) was used and then the increase in absorbance at 550 nm was recorded for 2 minutes. In parallel, the same quantity of reagents and samples with the addition of antimycin A (1µl; 1 mg/ml) were used.
Complex IV activity: Reduced cytochrome c (5 µl; 1 mM) was added to the assay medium. The baseline activity was recorded at 550 nm for 2 minutes. Then the prepared mitochondria (2 µl; 2 μg/µl) were added and the decrease in absorbance at 550 nm was recorded for 2 minutes. The specificity of complex IV activity was checked in parallel experiment, in which NaN3(1µl; 0.5 M) was added. The enzymatic activities for each mitochondrial enzyme should be calculated according to the following equation: Enzyme activity (nmol min-1 mg-1) = (∆Absorbance/min × 1,000)/[(extinction coefficient × volume of sample used in ml) × (sample protein concentration in mg ml-1)].
Seahorse XF96 Flux Analyzer
The Seahorse XF96 Flux Analyzer (Seahorse Bioscience, Billerica, MA) was used to determine the metabolic profiles of the cultured SGC-7901and BGC-823 cells as previously described [15]. A total of 1.0 ×10⁴ cells/well were seeded into XF96 microplates and incubated at 37°C for 24 hours. After treatment the cells were switched to unbuffered DMEM supplemented with 2 mM sodium pyruvate 1 hour prior to the beginning of the assay and maintained at 37°C. After baseline measurements, oxygen consumption rates (OCRs) were measured after sequentially adding to each well 20 μL of oligomycin FCCP and rotenone to reach working concentrations of 1 μg/ml, 1 μM, and 1 μM, respectively. Each parameter, including ATP-linked OCR, proton leak, mitochondrial respiration OCR, and non-mitochondrial respiration OCR. Extracelluar acidification rates (ECARs) were also assayed. A total of 1.0 ×10⁴ cells/well were seeded into XF96 microplates and incubated at 37°C for 24 hours. After treatment the cells were switched to unbuffered DMEM supplemented with glutamine 1 hour prior to the beginning of the assay and maintained at 37°C. After baseline measurements, ECARs were measured after sequentially adding to each well glucose, oligomycin and 2-deoxyglucose to reach working concentrations of 1 μM, 1 μM, and 1 μM, respectively. OCR is reported in the unit of picomoles per minute per mg protein, and ECAR is reported in milli-pH units (mpH) per minute per mg protein.
ROS assessment
The shCont and shTIMMDC1 cells of SGC-7901 and BGC-823 were plated onto 96-well plates at equal densities. The fluorescence probe DCFDA was used to measure intracellular ROS following the manufacturer's instructions. After treatment, cells were washed with HBSS, followed by incubation with DCFDA (10 μM/L)-containing DMEM for 20 min at 37 ºC in the dark. Cells were washed and green fluorescence was measured with a Synergy HT microplate reader (BioTek) at 488/525 nm.
Statistical Analysis
All data represent three or more independent experiments. Data were expressed as mean ± SD. Statistical analyses were conducted by SPSS 11.5 for Windows. One-way ANOVA (analysis of variance) followed by LSD (least significant difference) or Dunnett's T3 post hoc test (where equal variances were not assumed) was applied for multiple comparisons, whereas Student's t-test was used for comparisons between 2 groups. P < 0.05 was considered statistically significant.
Results
Knockdown of TIMMDC1 inhibited gastric cancer cell growth in vitro and in vivo
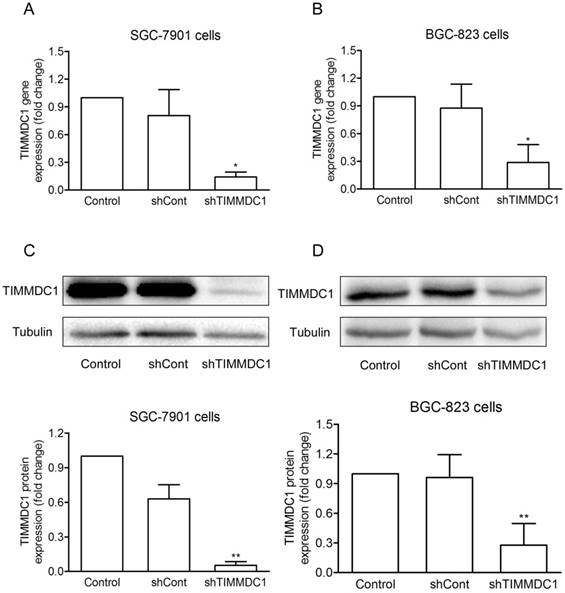
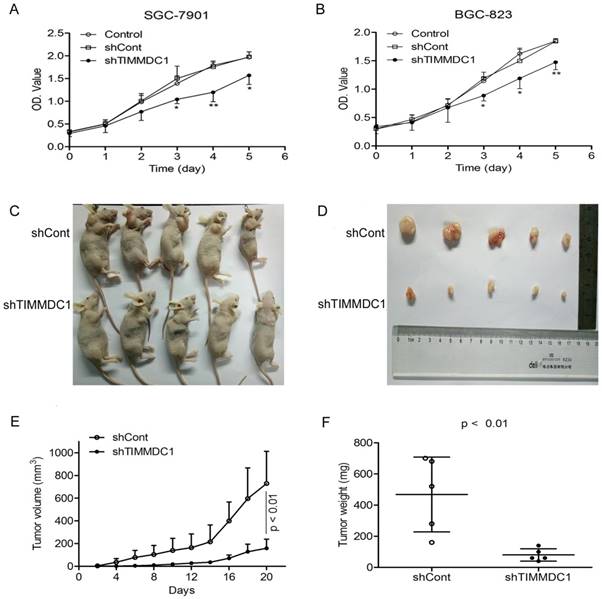
To investigate the potential role of TIMMDC1 in gastric adenocarcinoma, TIMMDC1 was knockdown in SGC-7901 and BGC-823 cells. Low expression of TIMMDC1 was confirmed by quantitative real-time polymerase chain reaction (qRT-PCR) and western blot (Fig. 1). The in vitro experiment showed that the growth rate of the shTIMMDC1 cells was markedly inhibited when compared with that of the control and shCont cells both in SGC-7901 and BGC-823 cells (Fig. 2A,B). In order to verify whether TIMMDC1 affects gastric tumour growth in vivo, age-matched male node mice (5 weeks of age) were used. 2 ×10⁶ cells of shCont and shTIMMDC1 of SGC-7901 cells were resuspended in 0.2 ml of PBS and injected into the subcutaneous of the mice, respectively. The cells were allowed to grow in vivo for three weeks. As shown in Fig. 2C-F, knockdown of TIMMDC1 significantly inhibited the subcutaneous tumour development as the tumor volume and tumor weight in shTIMMDC1 group were significantly decreased (78.26% and 82.9% decrease, respectively) when compared with those in shCont group. Thus, TIMMDC1 may play a certain role in the growth of gastric cancer.
The effiency of siRNA was evaluated by real-time and western blotting after siRNA transfection in SGC-7901 and BGC-823 cells. Real-time PCR analysis of the mRNA expression with shRNA-mediated silencing of TIMMDC1 gene in SGC-7901 cells and in BGC-823 cells (A, B) . Results were expressed as mean ± SD. n = 3. *P < 0.05 vs. control group.Western blot and densitometric analysis of bands for relative TIMMDC1 expression in SGC-7901 and BGC-823 cells (C, D). Results were expressed as mean ± S.D. n = 3. *P < 0.05, **P < 0.01 vs. control group.
Knockdown of TIMMDC1 decreased gastric cancer cell migration, invasion and metastasis in vitro and in vivo
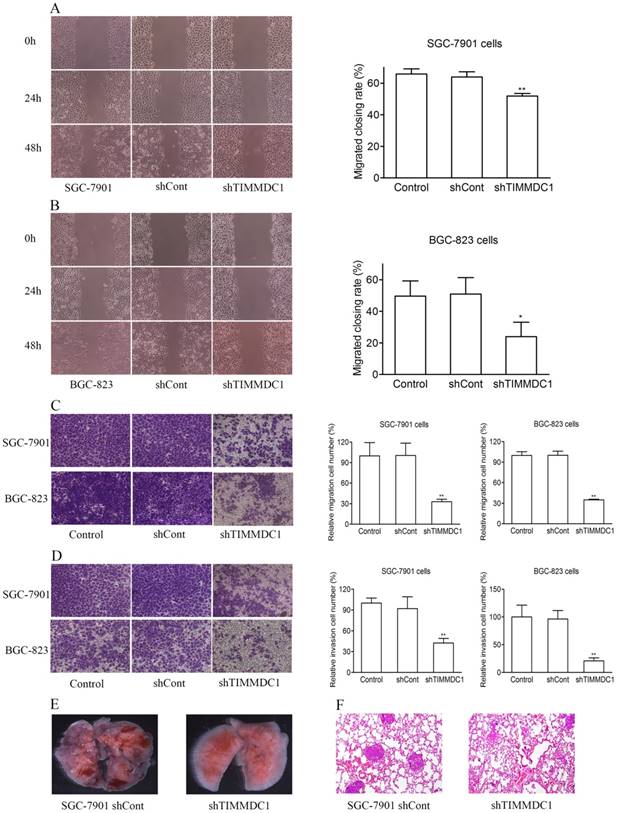
In order to explore the effect of TIMMDC1 on the migration and invasion capacities of gastric adenocarcinoma cells, the wound healing assay and transwell migration and invasion experiments were used. As the results showed in Figure 3, knockdown of TIMMDC1 decreased the migration and invasion abilities of the gastric cancer cells. In the wound healing assay, the migrated closing rate in shTIMMDC1 group was significantly lower than that in shCont group both in the SGC-7901 and BGC-823 cells (SGC-7901 cells: shCont: 63.9 ± 3.3; shTIMMDC1: 51.9 ± 1.6, P < 0.01, Fig 3A; BGC-823 cells: shCont: 51.0 ± 10.4; shTIMMDC1: 24.0 ± 10.4 ± 9.1; P < 0.01, Fig 3B). In transwell migration experiment, the relative migration cell number in shTIMMDC1 group was markedly decreased than that in shCont group both in SGC-7901 and BGC-823 cells (67.2% and 65.0% decrease, respectively, P < 0.01; Fig 3C). The data acquired in cell invasion assay also showed that the relative invasion cell number in shTIMMDC1 group was much less than that in shCont group both in SGC-7901 and BGC-823 cells (54.0% and 78.4% decrease, respectively, P < 0.01, Fig 3D). Here we also evaluated the role of TIMMDC1 in gastric adenocarcinoma metastasis in vivo. 2 ×10⁶ shCont and shTIMMDC1 cells of SGC-7901 cells were resuspended in 0.2 ml of PBS and injected into the lateral tail vein of the nude mice, respectively. Metastatic lung nodules were counted and were further confirmed via HE staining using a dissecting microscope.We found that the lung metastasis nodules in the shCont group were much more than that in the shTIMMDC1 group (Fig 3E,F). Taken together, knockdown of TIMMDC1 decreases the migration, invasion and metastasis abilities of SGC-7901 and BGC-823 cells both in vitro and in vivo.
Knockdown of TIMMDC1 reduced both mitochondrial energy metabolism and glycolysis activity in SGC-7901 and BGC-823 Cells
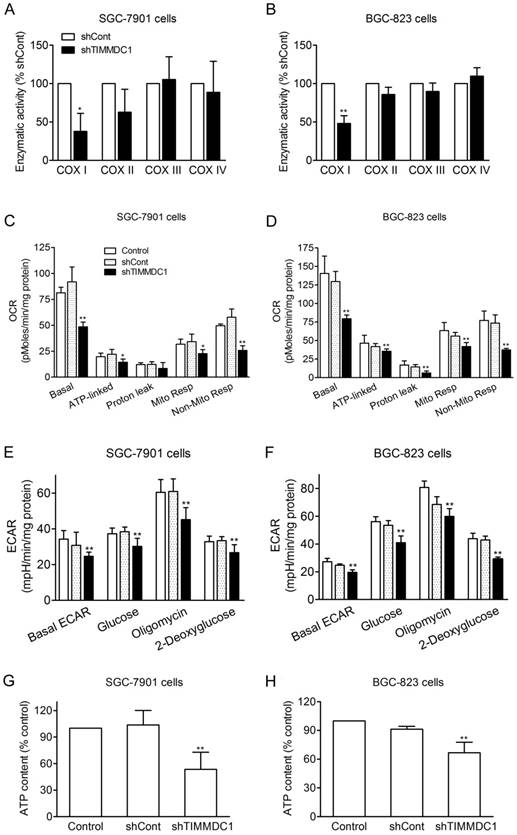
It has been reported that TIMMDC1 is the assembly factor of mitochondrial electron transfer chain complex, and TIMMDC1 deficiency will affect the integrity of the electron transport chain. Our results showed that knockdown of TIMMDC1 decreased the activity of complexe I but it has no inhibitory effect on the activity of complex II, III and IV (Fig 4A,B). We also investigated the effects of TIMMDC1 deficiency on the oxygen consumption rate (OCR) and extracellular acidification rate (ECAR) in cultured SGC-7901 and BGC-823 cells. The data in Fig 4C,D showed that knockdown of TIMMDC1 reduced the basal OCR to 48.49 ± 4.48 pMoles/min/mg protein (53% of shCont) in SGC-7901 cells, and to 79.3 ± 5.0 pMoles/min/mg protein (62% of shCont) in BGC-823 cells. The ATP-linked respiration and mitochondrial respiration rate were also markedly reduced to 65% and 66% of shCont in SGC-7901 cells and to 85% and 75% of BGC-823 cells, respectively. TIMMDC1 deficiency also markedly reduced the basal ECAR both in the SGC-7901 and BGC-823 (Fig 4E,F). When glucose was added into the culture medium, the ECARs were increased 10.4 and 6.2 mpH/min/mg protein in shCont and shTIMMDC1 groups of SGC-7901 cells, respectively, and increased 28.8 and 20.7 mpH/min/mg protein in shCont and shTIMMDC1 groups of BGC-823 cells, respectively. The ECARs were further increased 22.5, 14.9, 27.3 and 19.3 mpH/min/mg protein when the mitochondrial complex V was blocked by oligomycin in the shCont and shTIMMDC1 groups of SGC-7901 and BGC-823 cells, respectively. When 2-DG was applied to inhibit glycolysis in those system, the ECARs were decreased 31.0, 21,8, 38.0 and 29.6 mpH/min/mg protein in the shCont and shTIMMDC1 groups of SGC-7901 and BGC-823 cells, respectively. In addition, knockdown of TIMMDC1 markedly reduced the cellular ATP content both in SGC-7901 and BGC-823 cells (Fig 4G,H). All the data indicates that TIMMDC1 deficiency may be related with both mitochondrial bioenergetics and glycolysis pathway in the SGC-7901 and BGC-823 cells.
Knockdown of TIMMDC1 inhibits gastric cancer cells growth both in vitro and in vivo. ShRNA mediated silencing of the TIMMDC1 gene suppressed the growth rate of the cultured SGC-7901 and BGC-823 cells in vitro (A, B) . The cells in the control, shCont and shTIMMDC1 groups were grown in 96-well plates at the same density, and the growth rate was measured by CCK8 assay. Results were expressed as mean ± SD. n = 4. *P < 0.05, **P<0.01 vs. control group. Knockdown of TIMMDC1 inhibits gastric cancer cells growth in vivo. The tumor size was measured three times a week and calculated by 0.5 × L × W2 (L, length; W, width, C-E). The tumor weight was measured at the end of the experiment (F). Results were expressed as mean ± SD. n = 5. **P < 0.01 vs. shCont group.
Knockdown of TIMMDC1 reduced ROS production in SGC-7901 and BGC-823 Cells
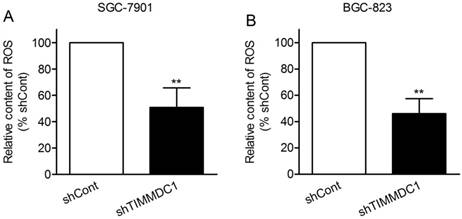
Reactive oxygen species (ROS) are mainly derived from mitochondrial electron transport complexes I and complex III, and the nicotinamide adenine dinucleotide phosphate (NADPH) oxidase family. Because of the inhibition in assembly and integrity of complex I, we speculated that knockdown of TIMMDC1 may reduce ROS production. As expected, we found that the production of ROS in shTIMMDC1 group was markedly decreased than that in shCont group both in SGC-7901 and BGC-823 cells (49.2% and 54.0% decrease, respectively, P < 0.01; Fig 5).
Knockdown of TIMMDC1 decreased gastric cancer cell migration, invasion and metastasis in vitro and in vivo. Scratch test (A,B) and transwell migration assay (C) were used to explore the effect of TIMMDC1 on the migration activity of SGC-7901 and BGC-823 cells. Results were expressed as mean ± SD. n = 3. *P < 0.05, **P < 0.01 vs. control group. Transwell invasion assay was used to investigate whether TIMMDC1 can also influence the invasion capacity of SGC-7901 and BGC-823 cells. Results were expressed as mean ± SD. n = 3. **P < 0.01 vs. control group. The representative images of pulmonary metastasis in the nude mice (E). HE tests showed that knockdown of TIMMDC1 significantly inhibit the metastases in the lung of nude mice (F).
Knockdown of TIMMDC1 regulated AKT/GSK3β/β-catenin signaling pathway in SGC-7901 and BGC-823 Cells
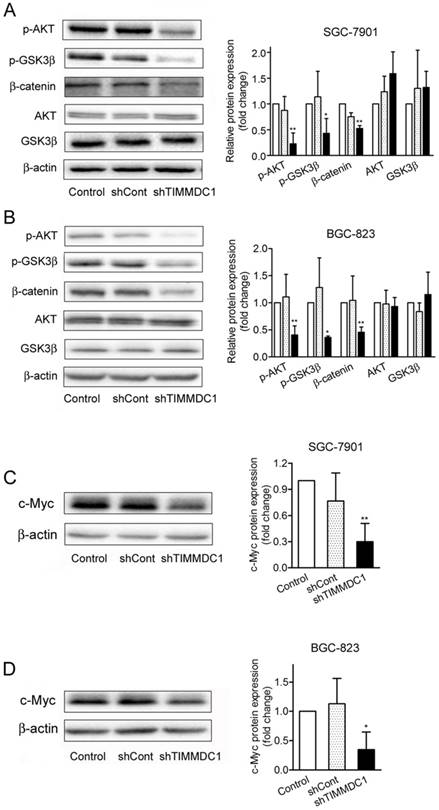
β-Catenin is a major component of both Wnt signaling and cell-cell adhesion, playing a central role in cancer cell proliferation, invasion and metastasis [16,17]. We questioned whether downregulation of TIMMDC1 modulates β-catenin expression. The data showed that TIMMDC1 knockdown significantly decreased the expression level of β-catenin in SGC-7901 and BGC-823 cells (Fig. 6A,B). Unlike most kinases, GSK-3β catalytically active in resting cells. GSK3β enzymatic activity is inhibited by phosphorylation leading to modulation of downstream targets [18,19]. We investigated whether GSK3β is involved in the TIMMDC1 deficiency induced degradation of β-catenin. As shown in Fig 6, TIMMDC1 knockdown resulted in markedly decreased phosphorylation of GSK3β (Ser9). Studies in different cells have suggested that AKT phosphorylates GSK3β rendering it inactive [20]. So we asked whether TIMMDC1 deficiency-mediated decreased phosphorylation of GSK3β (Ser9) involved AKT. As expected, p-AKT was constitutively expressed in a high level, and downregulation of TIMMDC1 decreased phosphorylation of AKT (Ser473) in SGC-7901 and BGC-823 cells (Fig. 6A,B). The expression level of downstream target protein c-myc in β-Catenin pathway also decreased both in SGC-7901cells and in BGC-823 cells (Fig.6 C,D).Thus, the data indicates that TIMMDC1 may be a regulator of AKT/GSK-3β/β-catenin signal pathway in SGC-7901 and BGC-823 cells.
Effects of TIMMDC1 on mitochondrial respiration and glycolysis in cultured SGC-7901 and BGC-823 cells. Downregulation of TIMMDC1 suppressed the activity of mitochondrial respiratory chain of the cultured SGC-7901 and BGC-823 cells (A, B). The activity of ETC complex I, complex II, complex III, and complex IV was measured by spectrophotometry. Results were expressed as percentage of control, and were showed as mean ± SD. n= 3, *P < 0.05, **P < 0.01 vs. shCont group. Real-time analysis of oxygen consumption rates (OCR) in cultured SGC-7901 and BGC-823 cells (C, D). Oligomycin (O, 1 µM), FCCP (F, 1 µM), and rotenone (R, 1 µM) were injected sequentially into each well containing SGC-7901 and BGC-823 cells after baseline rate measurement, Basal OCR, ATP-linked OCR, proton leak, mitochondrial respiration OCR, non-mitochondrial respiration OCR are shown. Each data represents mean ± SD. n = 3. *P < .05, **P < .01 versus control group. Real-time analysis of extracellular acidification rates (ECARs) in cultured SGC-7901 and BGC-82 (E, F). Glucose (1 μM), Oligomycin (1 μM) and 2-Deoxyglucose (1 μM) were injected sequentially into each well containing SGC-7901 and BGC-823 cells after baseline rate measuremen. Data were expressed as mean ± S.D. n = 3. **P < 0.01 vs. control group. Downregulation of TIMMDC1 reduced the content of ATP production in the cultured SGC-7901 and BGC-823 cells (G,H). Data were expressed as mean ± S.D. n = 3. **P < 0.01 vs. control group.
ShRNA mediated silencing of the TIMMDC1 gene suppressed the production of ROS in the cultured SGC-7901 and BGC-823 cells (A, B). Results were expressed as percentage of control, and were expressed as mean ± SD. n = 3. **P < 0.01 vs. control group.
ShRNA mediated silencing of the TIMMDC1 gene inactivates the Akt/GSK-3β/β-Catenin of the cultured SGC-7901 and BGC-823 cells (A, B). Results were expressed as percentage of control, and were expressed as mean ± SD. n = 3. *P < 0.05, **P < 0.01 vs. control group. ShRNA mediated silencing of the TIMMDC1 gene suppressed the expression of c-Myc in the cultured SGC-7901 and BGC-823 cells (C, D). Results were expressed as percentage of control, and were expressed as mean ± SD. n = 3.*P < 0.05, **P < 0.01 vs. control group.
Discussion
The role of mitochondrial metabolism in cancer growth and metastasis is controversial and the underlying mechanism is not fully understood. In this study, we found that TIMMDC1 knockdown by TIMMDC1-siRNA markedly inhibited the human gastric cancer cell growth and metastasis in vitro and in vivo. TIMMDC1 knockdown significantly and exclusively reduced the activity of mitochondrial complex I and mitochondrial respiration as well as glycolysis activity of cultured SGC-7901 and BGC-823 cells. TIMMDC1 knockdown also reduced the production of ROS and regulated AKT/GSK-3β/β-catenin signal pathway.
TIMMDC1 is a membrane-embedded mitochondrial complex I assembly factor through association with the MCIA complex. A research found that nineteen of 34 complex I core subunits or assembly factors displayed a reduction in abundance ranging from 10% to 45% under conditions where TIMMDC1 was depleted by 90% [7]. Clinical trials also found that in patients with mitochondrial disease caused by TIMMDC1 deletion, the complex I was deficiency in muscle and the levels of complex I subunits in fibroblasts were globally decreased. However, re-expression of TIMMDC1 in these cells increased the levels of complex I subunits, which is consistent with the described function of TIMMDC1 as a respiratory chain complex I assembly factor [21]. In order to explore the role of TIMMDC1 in gastric cancer cells, we knockdown TIMMDC1 by small interfering (si) RNAs in SGC-7901 cells and BGC-823 cells. Our results are consistent with previous studies that TIMMDC1 knockdown significantly and exclusively reduced the activity of mitochondrial complex I but not complex II~ IV. The data from the Seahorse analysis was showed markedly decreased mitochondrial respiration and ATP-linked oxygen consumption, indicating that TIMMDC1 knockdown reduces the efficiency of the mitochondrial electron transport chain and ultimately affects mitochondrial respiration.
In this study, we found the basal ECAR was also significantly reduced in the shTIMMDC1 group as compared with the shCont group. So we asked whether TIMMDC1 knockdown also affect the glycolysis pathway. Interestingly, when we added glucose and oligomycin (which blocks the mitochondrial complex V, where the electron chain is coupled to ATP synthesis) into the culture medium, the increased ECARs in control and shCont groups were obviously higher than that in shTIMMDC1 group in both SGC-7901 and BGC-823 cells. Moreover, when 2-DG was added into the culture medium to inhibit the glycolytic acidification, the ECARs in control and shCont groups were dropped much more significantly than that in shTIMMDC1 group both in SGC-7901 and BGC-823 cells. Thus, the data indicate that TIMMDC1 knockdown also affects the glycolytic capacity of the cells, and the reduced basal ECAR maybe partly due to the reduced glycolytic acidification. Related to the underlying mechanism for TIMMDC1 deficiency induced inhibition in glycolytic activity, we also speculated that it may be due to the decreased level of AKT phosphorylation (Fig 6A,B). AKT phosphorylation was reported to be directly correlated with the phosphofructokinase 1 (PFK1) protein expression level, and inhibition of AKT by MK-2206, a selective AKT1/2/3 inhibitor blocks PFK expression [22]. In the glycolytic pathway, PFK1 catalyzes one of the key regulatory and rate-limiting steps of glycolysis by converting fructose 6-phosphate and ATP to fructose 1,6-bisphosphate and ADP. A reduction in PFK expression impaired glucose uptake, lactate production and cell proliferation [23,24]. So, we speculated that the decreased mitochondrial respiration, glycolytic activity and ATP supply might at least partially contribute to the decreased cell proliferation in vitro and tumor progression in vivo in shTIMMDC1 group of human gastric cancer. Our results are consistent with some recent reports demonstrating mitochondrial complex I inhibition can reduce tumorigenesis and progression [9,25].
To data, very few pathways have been established directly from mitochondrial respiration and tumor progression. In this study, one important finding is the role of AKT inactivation in mediating the signal from TIMMDC1 knockdown to human gastric cancer growth and metastasis inhibition. The AKT signaling pathway is one of the major survival gateways of tumor cells. Hyperactivation of AKT is observed in a high proportion of human cancers, including gastric cancer [26]. Our results showed that the level of p-AKT was decreased after TIMMDC1 knockdown. In addition, the phosphorylation level of GSK-3β was decreased significantly, suggesting that GSK-3β was activated in the gastric cancer cells with TIMMDC1 knockdown. Our result also showed that β-catenin level was also markedly decreased after TIMMDC1 knockdown. Thus, the activated GSK-3β phosphorylates the N-terminal domain of β-catenin leading to β-catenin degradation, and then resulted in the decreased expression of c-Myc. It has been reported that overproduction of mitochondrial ROS activates PI3K/Akt signaling pathways [27]. Thus, we speculated that TIMMDC1 knockdown inactivates AKT/GSK-3β/β-catenin signaling pathway may be related to the inhibition of ROS production. Taken together, downregulation of TIMMDC1 inactivated the AKT/GSK-3β/β-catenin signaling pathway, exerting an inhibitory effect on cancer cells proliferation, survival and migration.
Controversial effects have also been reported for mitochondrial complex I and mitochondrial metabolism induced tumor progression. Some studies reported that mitochondrial complex I dysfunction caused by mtDNA mutations, enhanced tumorigenic and metastatic potential in a ROS-dependent manner [27,28]. Other studies reported that specific enhancement of mitochondrial complex I activity inhibited tumor growth and metastasis in breast cancer and the underlying mechanisms maybe related with the tumor cell NAD+/NADH redox balance, mTORC1 activity, and autophagy [29]. The contradictory findings existing in the present and other studies may be due to some reasons listed below: (1) different cancer types and cancer cell lines; (2) different extents of inhibition in mitochondrial complex I activity induced by different methods (such as mtDNA mutations), as studies indicated that mtDNA mutations may display diverse impact on tumorigenic potential depending on the type and severity of the resulting oxidative phosphorylation dysfunction [30]; (3) different signal transduction pathways were activated/inactivated in different studies; (4) some side effects beside mitochondrial complex I inhibition induced by the exactly method used in the studies, such as the glycolytic activity was inhibited by TIMMDC1 knockdown in the present study. Of cause, the exact mechanism underlying need to be further studied.
Conclusion
In summary, our study showed that TIMMDC1 knockdown significantly inhibited the cell proliferation in vitro and tumor progression in vivo in human gastric cancer. The underlying mechanism is not only associated with mitochondrial complex I inhibition and reduced mitochondrial respiration, but is also associated with reduced glycolysis activity and the AKT/GSK3β/β-catenin signaling pathways. These findings underscore the potential of TIMMDC1 as a molecular target for the treatment of human gastric cancer.
Acknowledgements
This work was supported by the Wenzhou City Science and Technology Project (Y20170014), and Key Discipline of Zhejiang Province in Medical Technology (First Class, Category A).
Author contribution
Yao Shen and Jianxin Lyu conceived and designed the experiments; Yuan Liu and Yao Shen wrote the manuscript; Yuan Liu, Yuyan Huang, Jingjing Zhang, Cao Pei and Jiahui Hu performed experiments and analyzed the data.
Competing Interests
The authors have declared that no competing interest exists.
References
1. Ahn CS, Metallo CM. Mitochondria as biosynthetic factories for cancer proliferation. Cancer Metab. 2015;3(1):1
2. Barbi de Moura M, Vincent G, Fayewicz SL, Bateman NW, Hood BL, Sun M. et al. Mitochondrial respiration-an important therapeutic target in melanoma. PLoS One. 2012;7(8):e40690
3. Sotgia F, Whitaker-Menezes D, Martinez-Outschoorn UE, Flomenberg N, Birbe RC, Witkiewicz AK. et al. Mitochondrial metabolism in cancer metastasis: visualizing tumor cell mitochondria and the "reverse Warburg effect" in positive lymph node tissue. Cell Cycle. 2012;11(7):1445-54
4. Robinson GL, Dinsdale D, Macfarlane M, Cain K. Switching from aerobic glycolysis to oxidative phosphorylation modulates the sensitivity of mantle cell lymphoma cells to TRAIL. Oncogene. 2012;31(48):4996-5006
5. Lu CL, Qin L, Liu HC, Candas D, Fan M, Li JJ. Tumor cells switch to mitochondrial oxidative phosphorylation under radiation via mTOR-mediated hexokinase II inhibition-a Warburg-reversing effect. PLoS One. 2015;10(3):e0121046
6. Guarani V, Paulo J, Zhai B, Huttlin EL, Gygi SP, Harper JW. TIMMDC1/C3orf1 functions as a membrane-embedded mitochondrial complex I assembly factor through association with the MCIA complex. Mol Cell Biol. 2014;34(5):847-61
7. Andrews B, Carroll J, Ding S, Fearnley IM, Walker JE. Assembly factors for the membrane arm of human complex I. Proc Natl Acad Sci USA. 2013;110(47):18934-9
8. Wu H, Wang W, Xu H. Depletion of C3orf1/TIMMDC1 inhibits migration and proliferation in 95D lung carcinoma cells. Int J Mol Sci. 2014;15(11):20555-71
9. Birsoy K, Sabatini DM, Possemato R. Untuning the tumor metabolic machine: Targeting cancer metabolism: a bedside lesson. Nat Med. 2012;18(7):1022-3
10. Wheaton WW, Weinberg SE, Hamanaka RB, Soberanes S, Sullivan LB, Anso E. et al. Metformin inhibits mitochondrial complex I of cancer cells to reduce tumorigenesis. Elife. 2014;3:e02242
11. Schmittgen TD, Livak KJ. Analyzing real-time PCR data by the comparative C(T) method. Nat Protoc. 2008;3:1101-1108
12. Nolan T, Hands RE, Bustin SA. Quantification of mRNA using real-time RT-PCR. Nat Protoc. 2006;1:1559-1582
13. Bao Y, Ding S, Cheng J, Liu Y, Wang B, Xu H. et al. Carnosine Inhibits the Proliferation of Human Cervical Gland Carcinoma Cells Through Inhibiting Both Mitochondrial Bioenergetics and Glycolysis Pathways and Retarding Cell Cycle Progression. Integr Cancer Ther. 2018;17(1):80-91
14. Spinazzi M, Casarin A, Pertegato V, Salviati L, Angelini C. Assessment of mitochondrial respiratory chain enzymatic activities on tissues and cultured cells. Nat Protoc. 2012;7(6):1235-46
15. Shen Y, Tian Y, Yang J, Shi X, Ouyang L, Gao J. et al. Dual effects of carnosine on energy metabolism of cultured cortical astrocytes under normal and ischemic conditions. Regul Pept. 2014;192-193:45-52
16. Bejsovec A. Wingless Signaling: A Genetic Journey from Morphogenesis to Metastasis. Genetics. 2018;208(4):1311-36
17. Yang W, Xia Y, Ji H, Zheng Y, Liang J, Huang W. et al. Nuclear PKM2 regulates beta-catenin transactivation upon EGFR activation. Nature. 2011;480(7375):118-22
18. Jain S, Ghanghas P, Rana C, Sanyal SN. Role of GSK-3beta in Regulation of Canonical Wnt/beta-catenin Signaling and PI3-K/Akt Oncogenic Pathway in Colon Cancer. Cancer Invest. 2017;35(7):473-83
19. Park SY, Lee YK, Lee WS, Park OJ, Kim YM. The involvement of AMPK/GSK3-beta signals in the control of metastasis and proliferation in hepato-carcinoma cells treated with anthocyanins extracted from Korea wild berry Meoru. BMC Complement Altern Med. 2014;14:109
20. Dai P, Mao Y, Sun X, Li X, Muhammad I, Gu W. et al. Attenuation of Oxidative Stress-Induced Osteoblast Apoptosis by Curcumin is Associated with Preservation of Mitochondrial Functions and Increased Akt-GSK3beta Signaling. Cell Physiol Biochem. 2017;41(2):661-77
21. Kremer LS, Bader DM, Mertes C, Kopajtich R, Pichler G, Iuso A. et al. Genetic diagnosis of Mendelian disorders via RNA sequencing. Nat Commun. 2017;8:15824
22. Lee JH, Liu R, Li J, Zhang C, Wang Y, Cai Q. et al. Stabilization of phosphofructokinase 1 platelet isoform by AKT promotes tumorigenesis. Nat Commun. 2017;8(1):949
23. Mor I, Cheung EC, Vousden KH. Control of glycolysis through regulation of PFK1: old friends and recent additions. Cold Spring Harb Symp Quant Biol. 2011;76:211-6
24. Stine ZE, Dang CV. Stress eating and tuning out: cancer cells re-wire metabolism to counter stress. Crit Rev Biochem Mol Biol. 2013;48(6):609-19
25. Calabrese C, Iommarini L, Kurelac I, Calvaruso MA, Capristo M, Lollini PL. et al. Respiratory complex I is essential to induce a Warburg profile in mitochondria-defective tumor cells. Cancer Metab. 2013;1(1):11
26. Cicenas J. The potential role of Akt phosphorylation in human cancers. Int J Biol Markers. 2008;23(1):1-9
27. Sharma LK, Fang H, Liu J, Vartak R, Deng J, Bai Y. Mitochondrial respiratory complex I dysfunction promotes tumorigenesis through ROS alteration and AKT activation. Hum Mol Genet. 2011;20(23):4605-16
28. Koshikawa N, Hayashi J, Nakagawara A, Takenaga K. Reactive oxygen species-generating mitochondrial DNA mutation up-regulates hypoxia-inducible factor-1alpha gene transcription via phosphatidylinositol 3-kinase-Akt/protein kinase C/histone deacetylase pathway. J Biol Chem. 2009;284(48):33185-94
29. Santidrian AF, Matsuno-Yagi A, Ritland M, Seo BB, LeBoeuf SE, Gay LJ. et al. Mitochondrial complex I activity and NAD+/NADH balance regulate breast cancer progression. J Clin Invest. 2013;123(3):1068-81
30. Iommarini L, Kurelac I, Capristo M, Calvaruso MA, Giorgio V, Bergamini C. et al. Different mtDNA mutations modify tumor progression in dependence of the degree of respiratory complex I impairment. Hum Mol Genet. 2014;23(6):1453-66
Author contact
![]() Corresponding authors: Jianxin Luy, Ph.D, Tel.: +86-577-8668 9805; E-mail: jxlu313com and Yao Shen, Ph.D, Tel.: +86-577-86699651; E-mail: yueshen-2002com
Corresponding authors: Jianxin Luy, Ph.D, Tel.: +86-577-8668 9805; E-mail: jxlu313com and Yao Shen, Ph.D, Tel.: +86-577-86699651; E-mail: yueshen-2002com
Received 2018-5-5
Accepted 2018-6-21
Published 2018-7-27