ISSN: 1449-2288International Journal of Biological Sciences

Int J Biol Sci 2018; 14(14):2073-2082. doi:10.7150/ijbs.28757 This issue Cite
Research Paper
TRIM59 Is a Novel Marker of Poor Prognosis and Promotes Malignant Progression of Ovarian Cancer by Inducing Annexin A2 Expression
You Wang1,2*, Zhicheng Zhou3*, Xinran Wang1,2*, Xuping Zhang4,5, Yansu Chen4,5, Jin Bai4,5 ![]() , Wen Di1
, Wen Di1 ![]()
1. Department of Obstetrics and Gynecology, Renji Hospital, School of Medicine, Shanghai Jiao Tong University, Shanghai 200001, China;
2. Shanghai Key Laboratory of Gynecologic Oncology, Focus Construction Subject of Shanghai Education Department, Shanghai;
3. Department of Molecular and Cellular Biology, Baylor College of Medicine, Houston, TX 77030, USA;
4. Cancer Institute, Xuzhou Medical University, Xuzhou 221002, Jiangsu Province, China;
5. Jiangsu Center for the Collaboration and Innovation of Cancer Biotherapy, Cancer Institute, Xuzhou Medical University, Xuzhou 221002, Jiangsu Province, China.
*These authors contributed equally to this work.
Abstract

Ovarian cancer is the fifth common cause of death in woman worldwide. The tripartite motif-containing (TRIM) proteins consist of more than 70 known protein members. Studies have showed that TRIM proteins are involved in cancer and play important roles in cancer cell proliferation, migration, adhesion and metastasis. Recent studies have indicated that TRIM59, as a putative ubiquitin ligase, is up-regulated in some cancers and associated with poor prognosis of gastric cancer. However, the exact roles of TRIM59 in ovarian cancer are still unknown. In this study, we found that TRIM59 expression was increased and positively associated with histological grades (P = 0.000), FIGO stages (P = 0.016), and metastasis (P = 0.027) in ovarian cancer. A integrative data analysis tool revealed that ovarian cancer patients with high TRIM59 expression were correlated with more unfavorable overall and progression-free survival than the rest patients with low TRIM59 expression (P = 0.0024 and P = 7.5×10⁻⁶, respectively). Based on the finding in the clinical data, we performed a series of cell line and animal experiments, and found that TRIM59 knockdown could significantly inhibit the ovarian cancer cell proliferation, clone formation, and invasion in vitro and the ovarian cancer growth of the subcutaneous and orthotopic implantation in vivo. Furthermore, TRIM59 was found to interact with Annexin A2 and induce Annexin A2 expression. Our data imply that TRIM59 can serve as a promising prognostic marker and a potential therapeutic target.
Keywords: TRIMP59, Tissue microarray, Ovarian cancer, Metastasis, Annexin A2
Introduction
Ovarian cancer is a highly aggressive gynecological cancer and the fifth common cause of death in woman worldwide [1]. Due to the development of some treatments and regimens in recent decades, some significant treatment achievements have been made for ovarian cancer patients, however, the 5-year survival rate for the ovarian cancer patients is still only 30% [2]. These high mortality can be mainly explained the fact that 75% of the ovarian cancer patients are at an advanced stage. And the representative characteristics of the advanced ovarian cancer are its rapid growth and wide metastatic diseases within the peritoneal cavity [3]. Therefore, unraveling the factors in the process of the ovarian cancer progression is important for providing novel biomarkers for prognosis and future therapeutic interventions.
The tripartite motif-containing (TRIM) proteins consist of three common N-terminal domains: a really interesting new gene (RING) domain, one or two b-boxes and a coiled-coil domain [4]. The TRIM superfamily includes more than 70 known protein members in human, and increasingly emerging evidences have suggested that some TRIM proteins are involved in cancer and offer some diagnostic biomarkers and new potential therapeutic targets [5-7]. Moreover, studies have showed that TRIM proteins can regulate cancer cell proliferation, migration, apoptosis, adhesion, invasion and metastasis [8-10]. TRIM59, as a cytoplasmic protein, has a specifically increased expression in breast, lung, parotid, gastrointestinal, female genital tract, bladder, head prostate, and neck mucosal tumor area [11]. Recently, our data has showed that both the mRNA and protein levels of TRIM59 are up-regulated in gastric cancer tissues compared with normal gastric tissues and associated with the poor prognosis of gastric cancer patients. Moreover, we also validate that TRIM59, a putative ubiquitin ligase, can interact with p53 promoting its ubiquitination and degradation, and then to induce gastric cancer cell growth and inhibit apoptosis [12, 13]. However, the exact roles of TRIM59 in ovarian cancer are still unknown.
In this study, we investigated the expression of TRIM59 in ovarian cancer and its association with the clinical parameters. We further explored the roles of TRIM59 in ovarian cancer cell proliferation, migration and clone formation in vitro and the growth in vivo. Simultaneously, we also investigate how TRIM59 regulate these cellular functions.
Materials and Methods
Patients and samples
This study was granted by Institutional Review Board of Shanghai Jiao Tong University School of Medicine prior to this study. All subjects provided their written informed consent and were assured of their anonymity and the confidentiality of the data obtained. Three normal ovarian epithelial tissues, four paired fresh ovarian epithelial carcinomas and the matched metastatic ovarian cancer tissues were obtained in surgery by pathology professionals. In addition, we purchased a commercial ovarian cancer tissue microarray (TMA) consisting of 192 ovarian adenocarcinomas, 10 para-carcinomas and 6 normal ovarian tissues (product lot number: OV20810, Xi'an Alenabio Co, Xi'an, China) and their detailed clinicopathological information.
Western blotting
The Western blotting was carried out as described as before [13], and the anti-TRIM59 (Abcam), anti-FLAG (Cell Signaling Technology), anti-Myc (Cell Signaling Technology), and anti- Annexin A2 (Cell Signaling Technology) were used as the primary antibodies. The anti-GAPDH (Epitomics) was used for the protein loading control. Each blotting was repeated three times.
Cell lines, plasmids, transfection and lentivirus production
Ovarian cancer cell lines, ES2, HO8910-PM, HO8910, SKOV3, A2780, OV2008, and OVCAR3 were cultured in DMEM medium (Invitrogen) supplemented with 10% fetal bovine serum, 10 u/mL penicillin G/streptomycin, 2 mM L-glutamine. Cells were maintained at 37°C in a humidified atmosphere containing 5% CO2.
Lentiviral plasmids containing two shRNA sequencesfor TRIM59 and the scramble shRNA fragments were generated in our previous study [13]. The full-length cDNAs for TRIM59 were amplified by PCR and ligated into a PLV.Ex2d.P/puro-EF1A vector that contains three copies of FLAG. All clones were confirmed by DNA sequencing.
The lentiviral plasmids and the packaging vectors pCMV-DR8 and pMD2.2 were transiently co-transfected into 293T cells using the calcium phosphate transfection method. After 48 hours of co-transfection, lentiviral supernatant was harvested to infect cell lines. These infected cells were stably selected with puromycin at a final concentration of 8 mg/ml for 2 weeks.
Immunoflurescence
The immunofluorescence was performed the same as the previous reports [13, 14]. The frozen human ovarian cancer and the normal ovarian tissues were sectioned with a thickness of 10 μm. Primary antibody against TRIM59 (Abcam) were used overnight at 4°C. The cell nucleus was counterstained with 5 μg/ml DAPI (Beyotime). The intracellular distributions of the target proteins were analyzed and photographed using confocal fluorescent microscopy with excitation at 488 nm (for FITC) and 340 nm (for DAPI).
Immunohistochemistry
The standard protocol used for the immunohistochemistry was provided in our previous study [13]. The rabbit polyclonal anti-TRIM59 (diluted at 1:100, Abcam) was incubated as the primary antibody for 1 hour at 37°C. The slide without primary antibody incubation was used as negative control. The nucleus was counterstained with Hematoxylin. The TMA immunostaining images were captured using a Leica DM2500 microscope and analyzed by Image-Pro Plus 6.0 software.
The signals were quantified according to both the intensity and percentage of cells with positive staining. The TRIM59 staining intensity was scored 0 to 3 (0 = negative; 1 = weak; 2 = moderate; 3 = strong). The percentage of TRIM59-positive stained cells was also scored into four categories: 1 (0%-25%), 2 (26%-50%), 3 (51%-75%) and 4 (76%-100%). The level of TRIM59 staining was evaluated by the immunoreactive score (IRS), which is calculated by multiplying the scores of staining intensity and the percentage of positive cells. Based on the IRS, the TRIM59 staining pattern was categorized as negative (IRS: 0), low (IRS: 1-6) and high (IRS: 8-12).
Co-immunoprecipitation
Co-immunoprecipitation was performed according to the procedure described previously [13]. Briefly, cellular lysates were prepared by incubating the cells in lysis buffer. The protein concentration of the lysates was determined using the BCA protein assay kit (Pierce) according to the manufacturer's protocol. About 500 μg protein was incubated with 2 μg specific antibodies for 12 h at 4ºC with constant rotation, then 20 μl 50% protein A or G agarose beads were then added and the incubation was continued for an additional 2 h. Beads were then washed five times using the lysis buffer, the beads were collected by centrifugation at 500 g for 5 min at 4ºC. The precipitated proteins were eluted from the beads by resuspending the beads in 2 × SDS-PAGE loading buffer and boiling for 5 min. At last, the immunoblotting was carried out in consistent with the previous experiment.
Quantitative real-time PCR (RT-PCR)
Total RNAs were extracted from the human ovarian tissues and cell lines using TRIzol reagent (Invitrogen). Then the total RNAs were reversely transcribed to cDNAs using PrimeScript RT reagent Kit with gDNA Eraser (Takara). The cDNAs were amplified with the primers: 5'-CCTGTGTTTGAGATAGATTTAAGAGC-3' (forward) and 5'-GCAACAAGGTGAGACCCAGT-3' (reverse) for TRIM59, 5'-AAATCCCATCACCATCTTCC-3' (forward) and 5'-TCACACCCATGACGAACA-3' (reverse) for GAPDH. The RT-PCR assay was carried out as described previously [13]. TRIM59 mRNA expression was normalized to GAPDH mRNA.
Cell proliferation assay
5×10³ cells were seeded in 96-well plate and cultured for 24, 48 and 72 hours. Then 10 microliter CCK-8 solution (Dojindo Molecular Technology Inc.) was added to each well and incubated at 37°C for 2 hours. Using the microplate reader (Bio-Tek), the absorbance was measured at 450 nm.
The soft agar colony formation assay
Soft-agar was pre-coated with 0.6% agarose in DMEM medium supplemented with 10% FBS in the bottom of the 6-well plates, as described previously [13]. 1.5×10³ cells suspended in 1 ml DMEM complete medium supplemented with 0.3% agar were covered into the pre-coated 6-well plates in triplicate. After 14 d, colonies were stained by 0.005% crystal violet (dissolved in methanol) for 1.5 hours, photographed and counted.
3D matrigel growth assay
50 μl matrigel mixed with cells in 50 μl DMEM media was seeded in 24-well plates at 2.5×10³ cells/well in triplicate and incubated at 37°C for 30 minutes. Then 200 μl DMEM media containing 10% FBS was applied to the 24-well plate. After incubation at 37°C for another 48 hours, photos were taken under a microscope, and the microspheres formed in the matrigel were counted in five random fields.
The invasion assay
The invasion assay was carried out using Costar transwell plates with 8 μm pore size, as described previously [13]. The transwell plate inserts were pre-coated with matrigel and 3×10⁴ cells were seeded in serum-free medium in the upper chamber. After 24 hours incubation at 37°C, cells in the upper chamber were carefully removed with a cotton swab and the cells that had traversed the membrane were fixed in 4% formalin for 15 minutes, stained with Crystal violet (0.1% in water) for 5 minutes, and counted the permeating cells in five random fields of each insert under the inverted microscope and photographed.
In vivo xenograft assay
For the tumor xenograft assay, the nude mice were divided into three groups consisting of 10 mice each. The SKOV3 cells untreated, stably transfected by TRIM59-shRNA or vector lentviruses (1×10⁶) mixed with 100 μl matrigel were subcutaneously injected into the axillary breast fat pad of the 4-week-old female BALB/C nude mice, respectively. The tumor growth was measured by a caliper upon palpable every 5 days. Tumor volume was calculated according to the formula: V= longer dimension ×shorter dimension2 × 0.5. Mice were sacrificed 40 days after injection, and tumors were taken out to photo. Each of tumors was divided for maintaining in liquid nitrogen and fixation in 10% buffered formalin.
The orthotopic implantation model
The SKOV3 cells with TRIM59 shRNA and scramble lentivirus were infected by the lentivirus with luciferase and green fluorescence protein (GFP), the flow cytometry was used to separate the cells with GFP. Then cells with positive GFP were injected subcutaneously with the 1×10⁶ dose into three 4-week-old female BALB/C nude mice. The nude mice were killed to harvest the tumor until the tumor volume was more than 1 cm3. Then, the nude mice intramuscularly anesthetized by ketamine hydrochloride (10 mg/kg). An incision was made through the right lower abdominal para rectal line and peritoneum. The right ovary was exposed, and part of the serosal membrane was scraped with forceps. The 1 mm3 tumor fragments were implanted into the scraped site of the serosal surface with a 5-0 absorbent suture. The ovary was then returned into the peritoneal cavity, and the abdominal wall and skin were closed with 3-0 sutures. The tumor growth was monitored every 5 days, and after 28 days of initial implantation, the mice were anaesthetized and given D-luciferin in PBS. Ten minutes after injection, bioluminescence imaging was conducted using a charge-coupled device camera (IVIS; Xenogen). Then, the mice were killed and tumors were taken out to photo. Each of tumors was divided for maintaining in liquid nitrogen and fixation in 10% buffered formalin.
Immunopurification, Coomassie Staining, and Mass Spectrometry
The 293T cells were transfected with 3×FLAG-TRIM59 for 48 hours, and the cellular lysates were prepared by incubating the cells in lysis buffer containing protease inhibitor cocktail (Roche). Anti-FLAG immunoaffinity columns were prepared using anti-FLAG M2 affinity gel (Sigma) following the manufacturer's suggestions. Cell lysates were applied to an equilibrated FLAG column of 1-ml bed volume to allow for adsorption of the protein complex to the column resin. After binding, the column was washed with cold PBS plus 0.1% Nonidet P-40. FLAG peptide (Sigma) was applied to the column to elute the FLAG protein complex as described by the vendor. Fractions of the bed volume were collected and electrophoresed by 4-20% SDS-PAGE. Separated protein bands were visualized by Coomassie staining.
The entire gel slice was excised into 11 pieces that were analyzed by LC-MS/MS using an LTQ-Orbitrap XL MS (Thermo Scientific, San Jose, CA) with on-line Eksigent NanoLC system (Eksigent, Dublin, CA) as described [15].
Statistical analysis
All the statistical analyses were performed by SPSS 20.0 statistical software package (SPSS Inc., Chicago, IL). The Mann-Whitney U test and Kruskal-Wallis test were implemented to evaluate the relationship between TRIM59 expression and clinicopathological parameters. Data are expressed as the means ± SD. The Dunnett's t-test was used to assess differences within treatment groups. Differences were considered significant when P < 0.05.
Results
TRIM59 expression was up-regulated and positively associated with clinicopathological features in human ovarian cancer
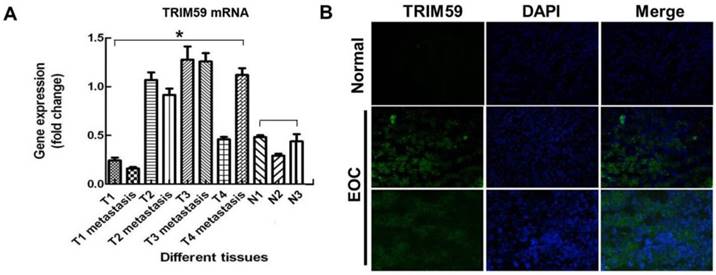
In order to confirm the expression of TRIM59 in human ovarian cancer, we collected 4 pairs of ovarian cancer tissues and metastatic tumors, and 3 normal ovarian epithelial tissues. RT-PCR results showed that TRIM59 mRNA expression was much higher in cancer epithelial tissues than the normal ones (Figure 1A). Simultaneously, using the immunofluorescence technique in the frozen sections of human ovarian cancer tissues and the normal ovarian tissues, we found that TRIM59 was mainly localized in the cytoplasm and nucleus of the ovarian cancer epithelial cells, and the TRIMP59 expression was almost negative in the normal tissues, but positive in the cancers (Figure 1B).
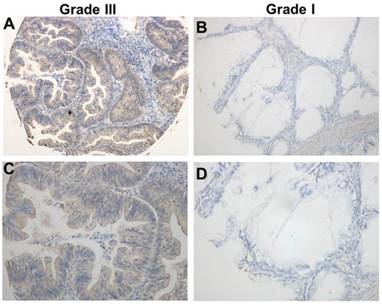
Using the immunohistochemical staining in the TMA including 192 human ovarian cancer tissues, we further explore the association between the expression of TRIM59 and the clinicopathological characters. Our data revealed that TRIM59 staining seemed to be localized in the cytoplasm and nucleus (Figure 2). Moreover, based on the multiplication of the staining intensity and the percentage of positive cells, the TRIM59 expression was classified as negative, low and high group. Using the appropriate statistical methods, we found that the expression of TRIM59 was positively associated with histological grades (P = 0.000), FIGO stages (P = 0.016), and metastasis (P = 0.027) (Table 1). The T stage was marginally correlated with TRIM59 expression (P = 0.073). There was no significant association between TRIM59 expression with age, lymph node and distant metastasis.
TRIM59 expression was correlated with prognosis of ovarian cancer patients
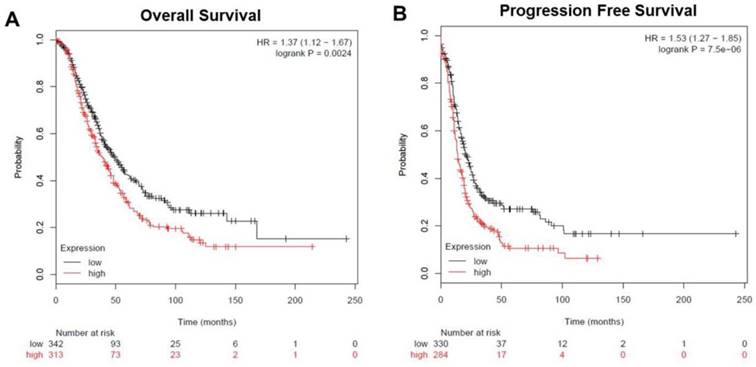
To analyze the prognostic value of TRIM59 in ovarian cancer, we used an integrative data analysis tool to validate the prognostic power of biomarkers identified in the literature. The tool can be accessed online at www.kmplot.com/ovar. The tool divided the patients into two groups according to the expression of TRIM59. These groups were then compared using progression-free survival or overall survival. A Kaplan-Meier survival plot was generated and significance was computed. The data revealed that ovarian cancer patients with high TRIM59 expression were correlated with more unfavorable overall and progression-free survival than the rest patients with low TRIM59 expression (P = 0.0024 and P = 7.5×10⁻⁶, respectively (Figure 3A-B).
TRIM59 immunohistochemical staining in epithelial ovarian cancer tissues. (A, B) Immunohistochemical detected TRIM59 expression in Grade III epithelial ovarian cancer. (C, D) Immunohistochemical detected TRIM59 expression in Grade I epithelial ovarian cancer. A, B: magnification ×100; C, D: magnification ×200.
TRIM59 expression was up-regulated in human ovarian cancer. (A) RT-PCR examined TRIM59 mRNA expression in normal and neoplastic ovarian epithelial tissue samples. T: ovarian cancer tissues; N: normal epithelial tissues. (B) Immunofluorescence detected the expressions of TRIM59 in frozen section of normal and neoplastic ovarian epithelial issue. Results are displayed as means ± SD from experiments in triplicate. *, P < 0.05, T compared with N.
TRIM59 expression promoted ovarian cancer proliferation, clone formation, and invasion in vitro
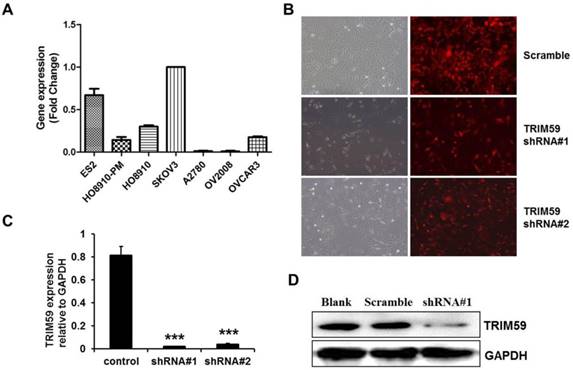
To select a suitable ovarian cancer cell line, we collected 7 ovarian cell lines, ES2, HO8910-PM, HO8910, SKOV3, A2780, OV2008 and OVCAR3 to test the endogenic TRIM59 expression levels. RT-PCR results demonstrated that the SKOV3 cells had the highest endogenic TRIM59 expression in these cell lines (Figure 4A). Then we knocked down TRIM59 expression in SKOV3 cells using the lentivirus to study the biological function of TRIM59 in ovarian cancer. After transfection, both the mRNA level and the protein level of TRIM59 in SKOV3 cells were decreased significantly compared to the control cells (Figure 4B-D).
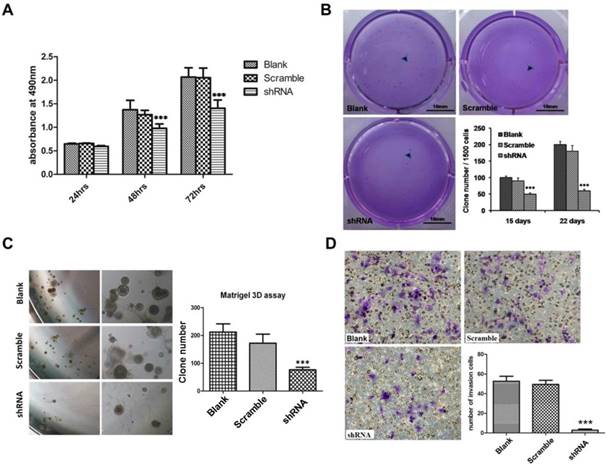
The results of CCK8 assay showed that TRIM59 knockdown significantly reduced the SKOV3 cell proliferation when compared with the paired controls (Figure 5A). Next, the soft agar clone formation assay was carried out to explore cell anchorage independent growth ability. Our data exhibited that the clone formation ratio of SKOV3 cells with TRIM59 knockdown had a significant decrease by about 48% after 15 days and 65% after 22 days as compared with the control ones (Figure 5B). The results of 3D matrigel growth assay showed that the TRIM59 knockdown in SKOV3 cells significantly reduced the number of the microspheres in comparison with the vector-infected cells (Figure 5C). Moreover, the transwell assay was used to assess the impact of TRIM59 on the cell invasion. Our data revealed that the invasion cell number of SKOV3 cells with knocked-down TRIM59 expression significantly decreased when compared with the control (Figure 5D).
TRIM59 staining and clinicopathological characteristics of 192 ovarian cancer patients.
| Variables | TRIM59 staining | ||||||
|---|---|---|---|---|---|---|---|
| Negative No. (%) | Low No. (%) | High No. (%) | Total No. | P | Statistical methods | ||
| Age | |||||||
| <52 years | 11 | 72 | 6 | 89 | 0.846 | Mann-Whitney U test | |
| ≥ 52 years | 9 | 77 | 6 | 92 | |||
| Histological grade | |||||||
| I | 14(33.33) | 26(61.90) | 2(4.76) | 42 | 0.000 | Kruskal-Wallis test | |
| II | 2(2.30) | 75(86.21) | 10(11.49) | 87 | |||
| III | 1(2.44) | 40(97.56) | 0(0.00) | 41 | |||
| FIGO stage | |||||||
| I | 19(14.29) | 107(80.45) | 7(5.26) | 133 | 0.016 | Kruskal-Wallis test | |
| II | 0(0.00) | 22(95.65) | 1(4.35) | 23 | |||
| III | 0(0.00) | 14(87.50) | 2(12.50) | 16 | |||
| IV | 1(11.11) | 6(66.67) | 2(22.22) | 9 | |||
| T status | |||||||
| I | 19(14.39) | 106(80.30) | 7(5.30) | 132 | 0.073 | Kruskal-Wallis test | |
| II | 0(0.00) | 28(96.55) | 1(3.45) | 29 | |||
| III | 1(5.00) | 15(75.00) | 4(20.00) | 20 | |||
| Metastasis | |||||||
| No | 19(14.29) | 107(80.45) | 7(5.26) | 133 | 0.027 | Mann-Whitney U test | |
| Yes | 1(2.08) | 42(87.50) | 5(10.42) | 48 | |||
| Lymph node metastasis | |||||||
| No | 19(11.66) | 135(82.82) | 9(5.52) | 163 | 0.258 | Mann-Whitney U test | |
| Yes | 1(5.56) | 14(77.78) | 3(16.67) | 18 | |||
Some cases were not available for the information.
The expression of TRIM59 related to overall and progression-free survival in patients with ovarian cancer. (A) Kaplan-Meier survival analysis showed that ovarian cancer patients with high TRIM59 expression were correlated with more unfavorable overall survival than the rest patients with low TRIM59 expression (P = 0.0024, log-rank test). (B) Kaplan-Meier survival analysis showed that ovarian cancer patients with high TRIM59 expression were correlated with more unfavorable progression-free survival than the rest patients with low TRIM59 expression (P = 7.5×10⁻⁶, log-rank test).
TRIM59 expression accelerated ovarian cancer growth in vivo
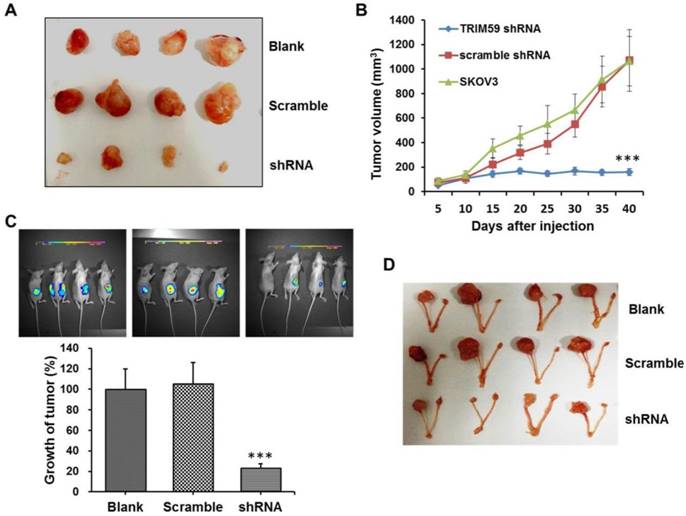
To further investigate the role of TRIM59 in ovarian cancer progression, we performed the xenograft tumor assays. The SKOV3 cells untreated, stably transfected by TRIM59-shRNA or vector lentiviruses were subcutaneously injected into the axillary breast fat pad of the nude mice, respectively. And the tumor size was monitored every five days. Consistent with the findings in vitro, we found that the tumor size was significantly decreased after TRIM59 knockdown when compared with the control (Figure 6A-B).
Simultaneously, to further confirm the finding in vivo, we used the luciferase tagged SKOV3 cells which were stably transfected by TRIM59-shRNA or vector lentiviruses to establish the orthotopic implantation model in nude mice. The small animal living imaging method was used to evaluate and monitor ovarian cancer cell growth. Our results revealed that the orthotopic transplantation ovarian tumor growth significantly reduced in the group with TRIM59 knockdown in comparison with the corresponding control group (Figure 6D-E). These collective data demonstrated that TRIM59 could accelerate the cancer cells growth to promote the ovarian cancer development.
The construction of TRIM59-shRNA-SKOV3 cell line. (A) Real-time PCR examined the expressions of TRIM59 mRNA in 7 ovarian epithelial cell lines. (B) The transfection efficiency of pUCTP-TRIM59-shRNA and pUCTP-scramble plasmids in SKOV3 cell line. (magnification ×200) (C) Real-time PCR identified the knockdown of TRIM59 in SKOV3 cell line. (D) Western blot identified the knockdown of TRIM59 in SKOV3 cell line. Results are displayed as means ± SD from experiments in triplicate. ***, P < 0.001.
TRIM59 expression promoted ovarian cancer proliferation, clone formation, and invasion in vitro. (A) CCK-8 cell proliferation assay showed that knockdown TRIM59 by shRNA inhibits SKOV3 cell proliferation. (B) Clone formation assay showed that knockdown TRIM59 by shRNA inhibits colony forming ability of SKOV3. (C) 3D matrigel growth assay showed that knockdown TRIM59 by shRNA inhibits SKOV3 cell sphere formation. (D) Transwell cell invasion assay showed that the knockdown TRIM59 by shRNA inhibits the invasion of SKOV3 cell. Results are displayed as means ± SD from experiments in triplicate. ***, P < 0.001.
TRIM59 induced Annexin A2 expression
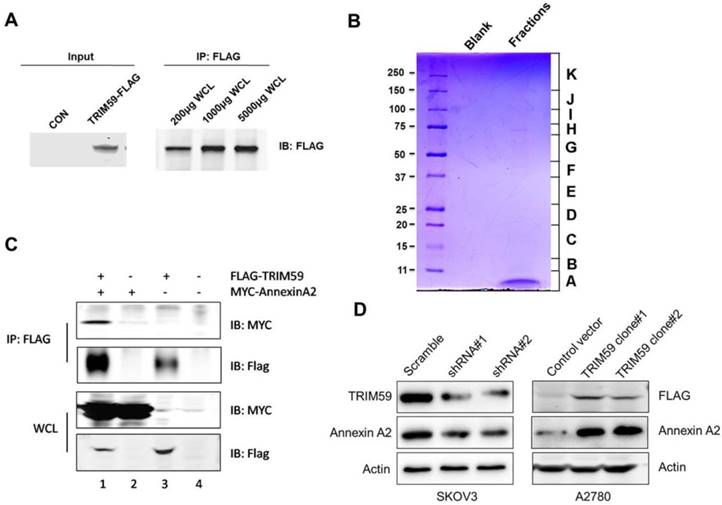
Given the clinical and biological significance of TRIM59 in ovarian cancer, we sought to determine the biochemical mechanism of its action. In order to do so, we generated a lentiviral construct for stable expression in 293T cells (Figure 7A).
To identify the proteins complexes that are binding to FLAG-TRIM59, we next decided to perform mass spectrometric analysis of the protein complexes. The contracted protein pool was loaded into a single well on a gel and subjected to coomassie analysis (Figure 7B). The individually excised protein-containing bands, as visualized in Figure 7B were subjected to mass spectrometry. The results revealed that TRIM59 bound with Annexin A2, Annexin A5, Polyubiquitin-C, MDM2, Rad23b and so on (Table 2).
It was reported that Annexin A2 was overexpressed in ovarian carcinoma tissues and promoted ovarian cancer cell proliferation and invasion [16, 17]. We over-expressed TRIM59 in an ovarian cancer cell line, A2780 cells, and performed the co-immunoprecipitation assay. Our data displayed that TRIM59 was jointed with Annexin A2 (Figure 7C), which was accordant with our results of the protein mass spectrometry analysis in 293T cells. Moreover, TRIM59 knockdown inhibited Annexin A2 protein expression, whereas TRIM59 over-expression up-regulated Annexin A2 expression (Figure 7D).
TRIM59 expression accelerated ovarian cancer growth in vivo. (A, B) In vivo xenograft assay showed that the tumor size was significantly decreased after TRIM59 knockdown when compared with the control. (C, D) The orthotopic implantation model revealed that the orthotopic transplantation ovarian tumor growth significantly reduced in the group with TRIM59 knockdown in comparison with the corresponding control group. n=10; ***, P < 0.001.
A summary of FLAG-TRIM59 mass spectrometry data
| Peptide Count | % Cov | Best Disc Score | Best Expect Val | Protein MW | Species | Protein Name |
|---|---|---|---|---|---|---|
| 7 | 25.1 | 2.61 | 3.40E-05 | 38604.4 | HUMAN | Annexin A2 |
| 6 | 25.6 | 2.83 | 7.50E-06 | 35937.1 | HUMAN | Annexin A5, UV excision repair protein RAD23 |
| 3 | 4.2 | 3.16 | 5.00E-06 | 43171.5 | HUMAN | homolog B |
| 2 | 2.3 | 2.68 | 8.10E-06 | 77039.2 | HUMAN | Polyubiquitin-C |
| 1 | 2.6 | 1.42 | 9.50E-05 | 55233.4 | HUMAN | E3 ubiquitin-protein ligase Mdm2 |
| 12 | 24.1 | 3 | 1.40E-06 | 47114.4 | HUMAN | Tripartite motif-containing protein 59 |
| 4 | 19.2 | 4.98 | 3.20E-08 | 27745.3 | HUMAN | 14-3-3 protein zeta/delta |
| 2 | 11.8 | 3.97 | 7.80E-08 | 27764.5 | HUMAN | 14-3-3 protein theta |
TRIM59 induced Annexin A2 expression in ovarian cancer cell lines. (A) To detect the protein expression of TRIM59-FLAG by Western blot and IP. (B) The coomassie staining result of the pooled fractions. (C) The verification of the interaction between exogenous Annexin A2 and TRIM59. (D) TRIM59 knockdown inhibited Annexin A2 protein expression, whereas TRIM59 over-expression up-regulated Annexin A2 expression in ovarian cancer cell lines.
Discussion
Ovarian cancer is a high life threatens in gynecological disease [1]. The rapid growth and extensive abdominal metastasis of ovarian cancer cells is the main causes of death in ovarian cancer patients [3]. Therefore, it is important to explore the exact molecular mechanisms of ovarian cancer progression in order to discover some promising prognostic biomarkers for ovarian cancer and potential novel treatment targets.
TRIM59 has been showed to play important roles in tumorigenesis and tumor progression [13, 18]. Studies have showed that TRIM59 is up-regulated in the breast, lung, parotid, gastrointestinal, female genital tract, bladder, kidney and prostate cancer, and positively associated with the poor outcome of gastric cancer patients [11, 13]. Despite this, there is no study investigating TRIM59 expression related to the progression of ovarian cancer. In this study, our data showed that TRIM59 expression was increased in ovarian cancer cell lines and tissues when compared with the normal ovarian epithelial cell line and tissues, which was consistent with the previous studies [11, 13]. Moreover, using a well-described ovarian cancer TMA with precise clinical data, we demonstrated that TRIM59 expression was positively associated with histological grades, FIGO stages, and metastasis. These findings indicated that TRIM59 expression may be related to the progression of ovarian carcinomas.
Based on our finding in the clinical data and the consensus that the speed of ovarian cancer progression depends on cancer cell growth and metastasis [3], we performed a series of cell line and animal experiments to investigate the possible roles of TRIM59 in ovarian cancer. In the present study, we found that TRIM59 knockdown in ovarian cancer cells inhibited the cell proliferation, anchorage independent growth, and invasion. Furthermore, TRIM59 expression in ovarian cancer cells negatively regulated the growth of the subcutaneous and orthotopic implantation in vivo. These data were consistent with and explained the results of the population study that TRIM59 expression was positively associated with FIGO stages and metastasis.
Annexins are widely involved in regulating cell membrane construction and material transport [19]. Additionally, Annexin A2 has been indicated to be involved in the development of tumors [20, 21]. It has been demonstrated that Annexin A2 is a potential prognostic factor, and has a stimulatory effect on ovarian cancer [17]. Moreover, Annexin A2 is reported to promote cell proliferation and invasion in ovarian cancer via regulating β-catenin/EMT [16]. In our study, we showed that TRIM59 was jointed with Annexin A2, which was accordant with our results of the protein mass spectrometry analysis in 293T cells. Moreover, TRIM59 knockdown inhibited Annexin A2 protein expression, whereas TRIM59 over-expression up-regulated Annexin A2 expression. These data suggested that TRIM59 may promote malignant progression of ovarian cancer by inducing Annexin A2 expression.
In summary, increased TRIM59 expression in ovarian cancer tissues was positively associated with clinical parameters such as FIGO stages and metastasis due to the enhanced growth and extensive metastasis. Ovarian cancer patients with high TRIM59 expression were correlated with more unfavorable overall and progression-free survival than the rest patients with low TRIM59 expression. TRIM59 could promote malignant progression of ovarian cancer by inducing Annexin A2 expression. Based on this study, we propose that TRIM59 may serve as a promising prognostic marker and a possible treatment strategy for ovarian cancer.
Abbreviations
TRIM: the tripartite motif-containing; FIGO: the International Federation of Gynecology and Obstetrics; RING: a really interesting new gene; TMA: tissue microarray; GFP: green fluorescence protein; FITC: fluorescein isothiocyanate; DAPI: 4',6-diamidino-2-phenylindole; CCK-8: cell counting kit-8; EMT: epithelial-mesenchymal transition.
Acknowledgements
This study was funded by grants from the Shanghai Municipal Commission of Health and Family Planning (No. 20164Y0236), the Medical-Engineering Joint Funds of Shanghai Jiao Tong University (No.YG2016QN50) and the Science and Technology Commission of Shanghai Municipality (No. 17ZR1416700).
Authorship
Wen Di designed the experiments; You Wang, Zhicheng Zhou, Xinran Wang, Xuping Zhang performed the experiments; Yansu Chen and Jin Bai drafted the manuscript.
Competing Interests
The authors have declared that no competing interest exists.
References
1. Siegel R, Naishadham D, Jemal A. Cancer statistics, 2013. CA Cancer J Clin. 2013;63:11-30
2. Rustin G, van der Burg M, Griffin C, Qian W, Swart AM. Early versus delayed treatment of relapsed ovarian cancer. Lancet. 2011;377:380-1
3. Lengyel E. Ovarian cancer development and metastasis. Am J Pathol. 2010;177:1053-64
4. Rajsbaum R, Garcia-Sastre A, Versteeg GA. TRIMmunity: The Roles of the TRIM E3-Ubiquitin Ligase Family in Innate Antiviral Immunity. Journal of Molecular Biology. 2014;426:1265-84
5. Hatakeyama S. TRIM proteins and cancer. Nature Reviews Cancer. 2011;11:792-804
6. Herquel B, Ouararhni K, Khetchoumian K, Ignat M, Teletin M, Mark M. et al. Transcription cofactors TRIM24, TRIM28, and TRIM33 associate to form regulatory complexes that suppress murine hepatocellular carcinoma. Proceedings of the National Academy of Sciences of the United States of America. 2011;108:8212-7
7. Kikuchi M, Okumura F, Tsukiyama T, Watanabe M, Miyajima N, Tanaka J. et al. TRIM24 mediates ligand-dependent activation of androgen receptor and is repressed by a bromodomain-containing protein, BRD7, in prostate cancer cells. Biochimica Et Biophysica Acta-Molecular Cell Research. 2009;1793:1828-36
8. Raheja R, Liu Y, Hukkelhoven E, Yeh N, Koff A. The ability of TRIM3 to induce growth arrest depends on RING-dependent E3 ligase activity. Biochem J. 2014;458:537-45
9. Wang J, Zhu J, Dong M, Yu H, Dai X, Li K. Knockdown of tripartite motif containing 24 by lentivirus suppresses cell growth and induces apoptosis in human colorectal cancer cells. Oncol Res. 2014;22:39-45
10. Uchil PD, Pawliczek T, Reynolds TD, Ding SY, Hinz A, Munro JB. et al. TRIM15 is a focal adhesion protein that regulates focal adhesion disassembly. Journal of Cell Science. 2014;127:3928-42
11. Khatamianfar V, Valiyeva F, Rennie PS, Lu WY, Yang BB, Bauman GS. et al. TRIM59, a novel multiple cancer biomarker for immunohistochemical detection of tumorigenesis. BMJ Open. 2012:2
12. Kondo T, Watanabe M, Hatakeyama S. TRIM59 interacts with ECSIT and negatively regulates NF-kappa B and IRF-3/7-mediated signal pathways. Biochem Biophys Res Commun. 2012;422:501-7
13. Zhou Z, Ji Z, Wang Y, Li J, Cao H, Zhu HH. et al. TRIM59 is up-regulated in gastric tumors, promoting ubiquitination and degradation of p53. Gastroenterology. 2014;147:1043-54
14. Chen Y, Huang Y, Xia X, Zhang J, Zhou Y, Tan Y. et al. JWA suppresses tumor angiogenesis via Sp1-activated matrix metalloproteinase-2 and its prognostic significance in human gastric cancer. Carcinogenesis. 2014;35:442-51
15. Fang L, Kaake RM, Patel VR, Yang Y, Baldi P, Huang L. Mapping the protein interaction network of the human COP9 signalosome complex using a label-free QTAX strategy. Molecular & cellular proteomics: MCP. 2012;11:138-47
16. Liu Y, Li H, Ban Z, Nai M, Yang L, Chen Y. et al. Annexin A2 inhibition suppresses ovarian cancer progression via regulating beta-catenin/EMT. Oncology reports. 2017;37:3643-50
17. Deng Y, Chen C, Hua M, Xi Q, Liu R, Yang S. et al. Annexin A2 plays a critical role in epithelial ovarian cancer. Archives of gynecology and obstetrics. 2015;292:175-82
18. Valiyeva F, Jiang F, Elmaadawi A, Moussa M, Yee SP, Raptis L. et al. Characterization of the Oncogenic Activity of the Novel TRIM59 Gene in Mouse Cancer Models. Mol Cancer Ther. 2011;10:1229-40
19. Liu W, Hajjar KA. The annexin A2 system and angiogenesis. Biological chemistry. 2016;397:1005-16
20. Christensen MV, Hogdall CK, Jochumsen KM, Hogdall EVS. Annexin A2 and cancer: A systematic review. International journal of oncology. 2018;52:5-18
21. Xu XH, Pan W, Kang LH, Feng H, Song YQ. Association of annexin A2 with cancer development (Review). Oncology reports. 2015;33:2121-8
Author contact
![]() Corresponding authors: Wen Di, Department of Obstetrics and Gynecology, Renji Hospital, School of Medicine, Shanghai Jiao Tong University, 160 Pujian Road, Shanghai, 200127, China. E-mail: diwen163com; Jin Bai, Jiangsu Key Laboratory of Biological Cancer Therapy, Xuzhou Medical University, 84 West Huaihai Road, Xuzhou, 221002, Jiangsu Province, China. E-mail: bjedu.cn.
Corresponding authors: Wen Di, Department of Obstetrics and Gynecology, Renji Hospital, School of Medicine, Shanghai Jiao Tong University, 160 Pujian Road, Shanghai, 200127, China. E-mail: diwen163com; Jin Bai, Jiangsu Key Laboratory of Biological Cancer Therapy, Xuzhou Medical University, 84 West Huaihai Road, Xuzhou, 221002, Jiangsu Province, China. E-mail: bjedu.cn.
Received 2018-7-25
Accepted 2018-9-26
Published 2018-11-3