ISSN: 1449-2288International Journal of Biological Sciences
- Current issue
- Volume 20; 2024
- Volume 19; 2023
- Volume 18; 2022
- Volume 17; 2021
- Volume 16; 2020
- Archive
- Advance articles
- Cover images
- Index & coverage
- Cover suggestion
- Special issues
Introduction
Materials and methods
Results
Discussion
Supplementary Material
Acknowledgements
References

Int J Biol Sci 2019; 15(3):587-597. doi:10.7150/ijbs.29737 This issue Cite
Research Paper
TRIB3 Promotes the Proliferation and Invasion of Renal Cell Carcinoma Cells via Activating MAPK Signaling Pathway
Baoan Hong1,2,3,4, Jingcheng Zhou1,2,3,4, Kaifang Ma1,2,3,4, Jiufeng Zhang1,2,3,4, Haibiao Xie1,2,3,4, Kenan Zhang1,2,3,4, Lei Li1,2,3,4, Lin Cai1,2,3,4, Ning Zhang5,6, Zhongyuan Zhang1,2,3,4 ![]() , Kan Gong1,2,3,4
, Kan Gong1,2,3,4 ![]()
1. Department of Urology, Peking University First Hospital, Beijing 100034, P.R. China
2. Hereditary Kidney Cancer Research Center, Peking University First Hospital, Beijing 100034, P.R. China
3. Institute of Urology, Peking University, Beijing 100034, P.R. China
4. National Urological Cancer Center, Beijing 100034, P.R. China
5. Department of Urology, Beijing Cancer Hospital, Beijing 100142, P.R. China
6. Beijing Institute for Cancer Research, Beijing 100142, P.R. China
Abstract

Tribbles pseudokinase 3 (TRIB3) is a member of the mammalian pseudokinase tribbles family and is involved in multiple biological processes. However, the role of TRIB3 in renal cell carcinoma (RCC) remains unclear. In this study, we aimed to elucidate the biological functions of TRIB3 in RCC and explore its underlying mechanisms. TRIB3 expression and its correlation with clinicopathological features was evaluated in 123 patients with RCC. A series of cytological experiments were performed to clarify the biological functions of TRIB3, and potential molecular regulatory mechanisms were explored using transcriptome sequencing. TRIB3 expression was significantly elevated in RCC tissues compared to that in paracancerous tissues, and high expression of TRIB3 was correlated with both advanced tumor stage and unfavorable prognosis. TRIB3 knockdown markedly inhibited RCC cell proliferation, migration and invasion. Furthermore, overexpression of TRIB3 promoted RCC cell proliferation, migration, invasion and xenograft tumor growth. Notably, TRIB3 expression was modulated by hypoxia-inducible factor-1α (HIF-1α), which enhanced cell viability and invasiveness via targeting the MAPK signaling pathway. This study reveals the potential oncogenic role of TRIB3 in RCC pathogenesis and illustrates the mechanisms underlying TRIB3-mediated tumor progression, providing new insight into the development of TRIB3 as a tumor biomarker and therapeutic target.
Keywords: Tribbles pseudokinase 3, renal cell carcinoma, cell proliferation, cell invasion, mitogen-activated protein kinases
Introduction
Tribbles pseudokinase 3 (TRIB3), a member of the tribbles-related family, contains the substrate-binding domains but lacks the conserved amino acid catalytic motifs essential for kinase activity [1, 2]. Despite lacking these catalytic structures, TRIB3 is a key regulator of a variety of cellular functions. TRIB3 can act as a scaffold or adaptor to regulate multiple signal transduction pathways. Interaction partners of TRIB3 include ubiquitin ligase, proteasomal degradation systems, autophagy, transcription factors, and members of the MAPK-ERK, TGF-β, and JAG1/Notch signaling pathways [3-7]. Additionally, TRIB3 regulates a series of cellular processes, such as cellular stress response, cell proliferation and differentiation, glucose and lipid metabolism, and epithelial-to-mesenchymal transition (EMT) [8-13]. As a sensor of cellular stress, TRIB3 expression is upregulated in diverse microenvironments, such as during endoplasmic reticulum stress, hypoxia and nutrient deprivation. Depending on the cell physiological status, TRIB3 maintains cell survival by blunting potentially deleterious stress signals [14-16].
Recently, emerging evidence suggests that TRIB3 is a crucial modulator of tumorigenesis. Several studies have demonstrated that TRIB3 is elevated in multiple cancer cell lines and primary tumors, including colorectal cancer, breast cancer and lung cancer [17-19]. It is involved in tumor progression and related to poor prognosis. Hypoxia and nutrient deficiency occur during the growth of solid tumors [20-22], and these tumor microenvironments activate a variety of cellular stress response pathways, such as unfolded protein responses and endoplasmic reticulum stress, leading to upregulation of TRIB3 expression. Intriguingly, Wennemers et al. [23] reported that high expression of TRIB3 is related to a good prognosis for breast cancer patients. Erazo et al. [24] found that upregulated TRIB3 inhibits the Akt/mTORC1 axis, exerting anti-tumor effects. These studies suggested that TRIB3 may either promote or suppress tumor progression. Therefore, the biological functions and interaction mechanisms of TRIB3 in cancers remain controversial.
Renal cell carcinomas (RCCs) are solid tumors accompanied by microenvironments of hypoxia and nutrient deficiency. Currently, the expression of TRIB3 in RCC and its association with clinicopathological features and prognosis remain unclear. In this study, we evaluated the expression of TRIB3 to clarify the relationship between TRIB3 and clinicopathological features, further illuminating its biological functions and regulatory mechanisms in RCC. Our results found that TRIB3 expression is significantly elevated in RCC tissues compared to that in paracancerous tissues. Furthermore, high expression of TRIB3 was correlated with an advanced tumor stage and unfavorable prognosis in RCC. Notably, TRIB3 expression was modulated by hypoxia-inducible factor-1α (HIF-1α), which mediated RCC cell proliferation, migration and invasion via targeting the MAPK signaling pathway.
Materials and methods
Patients and RCC specimens
Ethical approval was obtained from the Ethics Committee of Peking University First Hospital (Beijing, China). In this study, we recruited 123 RCC patients who underwent surgery at Peking University First Hospital from 2012 to 2013. The mean follow-up time for these patients was 60 ± 15 months. We examined the clinicopathological features, including the gender, age, tumor size, pathology type, tumor stage, tumor grade and prognosis. Both the RCC tissues and paracancerous tissues were collected. Formalin-fixed, paraffin-embedded specimens for tissue microarray construction were reviewed by two professional pathologists (QH and YZ). Fresh RCC and normal renal tissues were preserved at -80 °C.
Immunochemical staining and analyses
Immunochemical staining was performed as previously reported [25]. Primary antibodies included TRIB3 (rabbit monoclonal, 1:250 dilution, #ab137526, Abcam, Cambridge, UK), HIF-1α (rabbit polyclonal, 1:50 dilution, #sc10790, Santa Cruz, Dallas, TX, USA), and HIF-2α (rabbit polyclonal, 1:40 dilution, #ab199, Abcam). The secondary antibody was purchased from OriGene (poly-peroxidase-conjugated anti-rabbit/mouse immunoglobulin G, #PV-9000, OriGene, Beijing, China). The slides were independently assessed by two pathologists. As previously reported, protein expression was semiquantitatively evaluated using an immunoreactive score (IRS) [26]. The percentage of immunostaining was scored as follows: 0 (0), 1 (< 10%), 2 (10-50%), 3 (51-80%) and 4 (> 75%). The staining intensity was defined as 0: no color reaction; 1: mild reaction; 2: moderate reaction; and 3: intense reaction. The two staining scores were multiplied to calculate the expression intensity. IRSs ranged from 0 to 12, which were divided into two grades: low expression (score ≤ 6) and high expression (score > 6).
Cell culture and lentivirus transduction
Five human RCC cell lines (786-O, 769-P, ACHN, A498 and Caki-1) were utilized in this study. HK-2, human normal proximal tubular cell line, was used as the control cell line. They were obtained from the Institute of Urology, Peking University (Beijing, China). The media (Gibco Invitrogen, Carlsbad, CA, USA) were supplemented with 10% fetal bovine serum (FBS, PAN-Biotech GmbH, Adenbach, Germany), penicillin G (100 U/ml) and streptomycin (100 μg/ml). Cells were incubated at 37 °C in a 5% CO2 atmosphere.
The TRIB3 overexpression lentivirus (LV-TRIB3) and its negative control lentivirus (LV-control), the TRIB3 knockdown lentivirus (LV-shTRIB3) and the nontargeting control lentivirus (LV-scrambled), and the HIF-1α overexpression lentivirus (LV-HIF-1α) and its negative control lentivirus (LV-vector) were produced and verified by GeneChem Corporation (Shanghai, China) (Supplement 1). Cells were incubated and transfected with lentivirus and polybrene (5 μg/ml; GeneChem Corporation). Puromycin (1.5 μg/ml) was used to screen stable cell clones. The expression efficiency was verified by quantitative real-time PCR (qRT-PCR) and western blot analysis.
RNA isolation and qRT-PCR
Total RNAs were isolated with Trizol (#15596018, Invitrogen), and their concentrations were measured using the NanoDrop2000 spectrophotometer (Thermo Fisher, Waltham, MA, USA). Superscript II reverse transcriptase (#K1622, Thermo Scientific, Lithuania, EU) was used for reverse transcription, and qRT-PCR was conducted using Power SYBR Green PCR Master Mix (#4472908, Thermo Fisher, Austin, TX, USA) on an Applied Biosystems 7500 instrument (Foster City, CA, USA). Primers for TRIB3 and 18S rRNA were listed as follows: TRIB3, Forward: 5'-TCGCTGACCGTGAGAGGAA-3', Reverse: 5'-GCTTGTCCCACAGGGAATCA-3'; and 18S rRNA, Forward: 5'-CGGACAGGATTGACAGATTGATAGC-3', Reverse: 5'-TGCCAGAGTCTCGTTCGTTATCG-3'.
Western blot analysis
Total protein was extracted, quantified, and loaded onto precast PAGE gels (#KGMG010W10, KeyGEN, Jiangsu, Nanjing). After electrophoresis, proteins were transferred to nitrocellulose membranes and incubated with primary antibodies at 4°C overnight (anti-TRIB3, recombinant rabbit monoclonal, 1:7000 dilution, #ab75846, Abcam; anti-HIF-1α, mouse monoclonal, 1:1000 dilution, #NB100-105, Novus, Littleton, CO, USA; anti-HIF-2α, rabbit polyclonal, 1:1000 dilution, #NB100-122SS, Novus; β-tubulin, Rabbit monoclonal, 1:1000 dilution, #2128, Cell Signaling Technology, Danvers, MA, USA). The secondary antibody (ProteinFind Goat Anti-Rabbit/Mouse IgG(H+L), HRP conjugate, 1:1000 dilution, #HS201, TransGen, Beijing, China) was subsequently added, and immune activity was detected by chemiluminescence.
Cell proliferation assay
RCC cells (5×10³ cells/well) were cultured in 96-well plates. To assess proliferation rates, 10 μl of Cell Counting Kit-8 (#CK04, CCK-8, Dojindo, Japan) was added to each well at 24, 48, 72, 96, or 120 h, and the mixtures were incubated for 1.0 h at 37 °C. The absorbance was detected by a microplate reader at OD450.
Wound healing migration assay
RCC cells (5×10⁵ cells/well) were seeded in 6-well plates and incubated for 24 h. RCC cells were vertically scratched using 200 μl tips and washed with phosphate buffered saline (PBS). Then, serum-free medium was added to incubate the cells. Images were acquired using an inverted microscope at 0 h, 12 h and 24 h to assess cell migration.
Transwell assay
The indicated cells (1×10⁵) were suspended in serum-free media (200 μl) and added into the upper chamber of transwells (#3422, Corning, NY, USA), which were precoated with 60 µl of Matrigel (1:10 dilution, #354234, BD Bioscience, MA, USA). The lower chambers contained 600 μl of media supplemented with 10% FBS. After incubating for 40 h, the RCC cells were fixed with 3.7% paraformaldehyde and stained with 0.5% crystal violet. RCC cells that penetrated through the membrane were imaged using an inverted microscope. Cells were then stained with crystal violet, which was removed with 33% acetic acid, and absorbance was detected at OD570.
Cell migration was assessed using Matrigel-free transwell chambers. All subsequent steps were performed as described above except the cells were incubated for 24 h.
In vivo xenograft assay
The experimental procedures were approved by the Peking University First Hospital Experimental Animal Care Ethics Committee (no. J201756). BALB/c mice (5 weeks old, male, nude; animal certificate no. 11400700276716, Beijing Vital River Laboratory Animal Technology Co., Ltd.) were fed in specific pathogen-free conditions. Briefly, 1×10⁷ TRIB3-overexpressing 786-O cells or control TRIB3 cells suspended in 150 μl of mixture (PBS and Matrigel, 1:1) were subcutaneously injected into the axilla (n = 10 mice per group). Beginning ten days after inoculation, the tumor size was measured twice per week. Tumor volume was calculated in mm3 using the formula as: V = 0.5 a x b2, a and b are the long and short diameters of the xenograft tumors. Four weeks later, the mice were euthanized by cervical dislocation, and the tumors were collected. The implanted tumors were snap frozen and preserved at -80°C for further study.
RNA-sequencing and signaling pathway assays
Total RNA was extracted from RCC cell lines treated with recombinant lentivirus overexpressing TRIB3 or a negative control and quantitated using a NanoDrop-1000 spectrophotometer, and the integrity was subsequently assessed with an Agilent 2100 Bioanalyzer (Agilent Technologies, Santa Clara, CA, USA). RNA-sequencing was performed on an Illumina HiseqX10. Experiments were repeated three times. For detection of differentially expressed genes (DEGs), a fold change ≥ 2 or ≤ 1/2 and a false discovery rate (FDR) < 0.01 were set as the screening criteria. P-values≤0.05 were considered statistically significant. Kyoto Encyclopedia of Genes and Genomes (KEGG) pathway analysis (http://www.kegg.jp/) was used to clarify the physiological functions and signaling pathways related to the DEGs in RCC cell lines.
Cobalt chloride (CoCl2)-mediated hypoxia induction
The indicated cells (2×10⁵ cells/well) were seeded in six-well plates. To imitate hypoxic conditions, CoCl2 (#C8661-25G, Sigma-Aldrich, St Louis, MO, USA) was added to the medium at an appropriate concentration of 150 μM (Figure S1) [27, 28]. Cells were cultured and treated with CoCl2 for 0 h, 2 h, 4 h, 6 h, 12 h, 24 h, 48 h or 72 h. Then, the expression of TRIB3, HIF-1α and HIF-2α was assessed, and β-tubulin was used as an endogenous reference.
Luciferase reporter assay
The HIF-1α promoter region was inserted into a pLVX basic vector. The Dual-Luciferase Reporter Assay System (E1910, Promega, Madison, WI, USA) was used in the luciferase reporter assays. The transfection efficiency was assessed by cotransfection with the Renilla luciferase expression plasmid pRL-CMV (Promega). The Renilla luciferase activity was used to normalize the firefly luciferase activity, which was then rescaled to vector control signals equal to unit 1. Each group had six replicates.
Statistical analysis
In this study, data were presented as the mean ± standard deviation. Student's t-test, ANOVA and the LSD multiple comparison t‑test were used to determine the statistical significance. Relationships between TRIB3 expression and HIF-1α, HIF-2α or other clinicopathological parameters of RCC patients were analyzed with the χ2 test or Yates' continuity-corrected χ2 test. The survival was analyzed with Kaplan-Meier analysis and log-rank tests. Statistical analysis was performed using SPSS 20.0 software, and α (two sides) = 0.05, P < 0.05 was considered statistically significant.
Results
TRIB3 expression in RCC tissues and its correlation with clinicopathological features
In total, 123 RCC patients (85 males and 38 females) were included in this study (Table 1). The mean age of the subjects was 55 ± 12 years, and the mean tumor size was 4.3 ± 1.9 cm. The numbers of patients with TNM stages T1, T2 and T3-4 were 97 (78.9%), 8 (6.5%) and 18 (14.6%), respectively. The numbers of patients with tumor grades 1, 2 and 3-4 were 41 (33.3%), 66 (53.7%) and 16 (13%), respectively. Of these patients, 35 exhibited microvascular invasion in RCC tissues.
Clinicopathological features of the 123 RCC patients and their correlations with TRIB3 expression
| Parameters | N | TRIB3 (n) | χ2 | P-value | |
|---|---|---|---|---|---|
| High | Low/negative | ||||
| Gender | 0.090 | 0.765 | |||
| Male | 85 | 49 | 36 | ||
| Female | 38 | 23 | 15 | ||
| Age (yr) | 0.604 | 0.437 | |||
| ≥55 | 63 | 39 | 24 | ||
| <55 | 60 | 33 | 27 | ||
| Tumor size (cm) | 10.27 | 0.0014** | |||
| ≤4.3 | 67 | 30 | 37 | ||
| >4.3 | 56 | 42 | 14 | ||
| Stage | 12.17 | 0.0023** | |||
| T1 | 97 | 49 | 48 | ||
| T2 | 8 | 7 | 1 | ||
| T3-4 | 18 | 16 | 2 | ||
| Grade | 0.371 | 0.831 | |||
| G1 | 41 | 25 | 16 | ||
| G2 | 66 | 37 | 29 | ||
| G3-4 | 16 | 10 | 6 | ||
| Microvascular invasion | 0.169 | 0.681 | |||
| Yes | 35 | 22 | 13 | ||
| No | 88 | 50 | 38 | ||
| HIF‑1α | 6.673 | 0.0098** | |||
| High | 93 | 61 | 32 | ||
| Low/negative | 30 | 11 | 19 | ||
| HIF‑2α | 2.976 | 0.0845 | |||
| High | 75 | 49 | 26 | ||
| Low/negative | 48 | 23 | 25 | ||
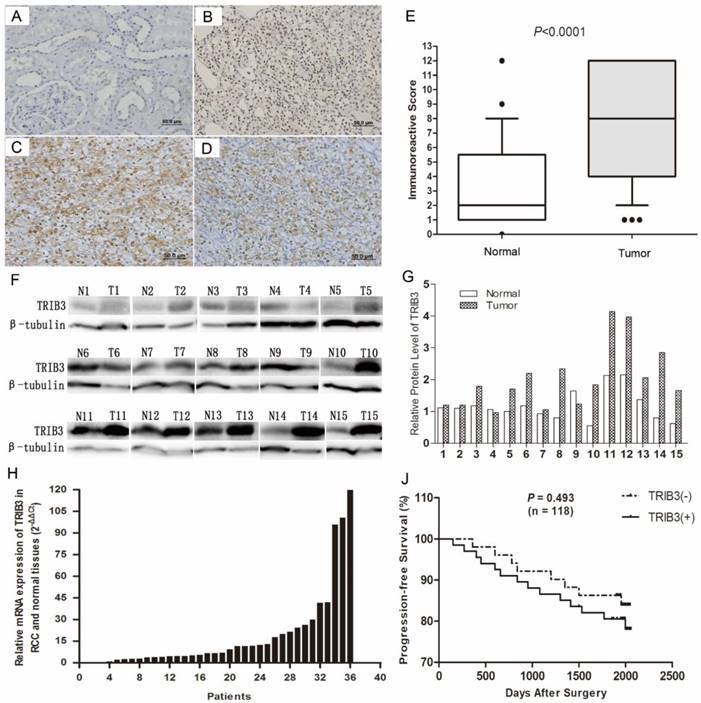
Immunochemical staining indicated that TRIB3 was expressed at higher levels in RCC tissues than in normal paracancerous tissues (Figure 1A/B). TRIB3 expression was localized in nucleus. Furthermore, TRIB3 was also highly expressed in fresh RCC tissues at both the mRNA and protein level (Figure 1F/G/H). Of the 123 patients, 72 showed high TRIB3 expression, while 51 showed little or no TRIB3 expression (Figure 1E, P < 0.0001). Further analysis indicated that high TRIB3 expression was significantly associated with a large tumor size (P = 0.0014) and high tumor T stage (P = 0.0023) (Table 1). However, TRIB3 expression was not correlated with gender (P = 0.765), age (P = 0.437), tumor grade (P = 0.831) or microvascular invasion (P = 0.681) (Table 1). During the follow-up, there were 22 cases of tumor recurrence, metastasis or death. Compared with that of patients in the high TRIB3 expression group, progression-free survival was better for patients in the low/no expression group, although this difference was not statistically significant (Figure 1J, P = 0.493). The median progression-free survival was 66.5 months (range, 12.0-68.6 months) in the low/no TRIB3 expression group and 65.1 months (range, 5.0-68.3 months) in the high TRIB3 expression group.
Correlation of TRIB3 with HIF‑1α and HIF‑2α in RCC tissues
HIF‑1α and HIF‑2α are two important hypoxia-related molecules. Immunohistochemical staining showed that HIF‑1α and HIF‑2α were highly expressed in RCC tissues (Figure 1C/D). Among these 123 patients, HIF‑1α and HIF‑2α were upregulated in 93 (75.6%) and 75 (61.0%), respectively (Table 1). Furthermore, HIF‑1α expression was significantly associated with TRIB3 expression (P = 0.0098, Table 1). However, no significant correlation was observed between HIF‑2α and TRIB3 (P = 0.0845, Table 1).
TRIB3 expression in RCC cell lines and verification of transfection efficiency
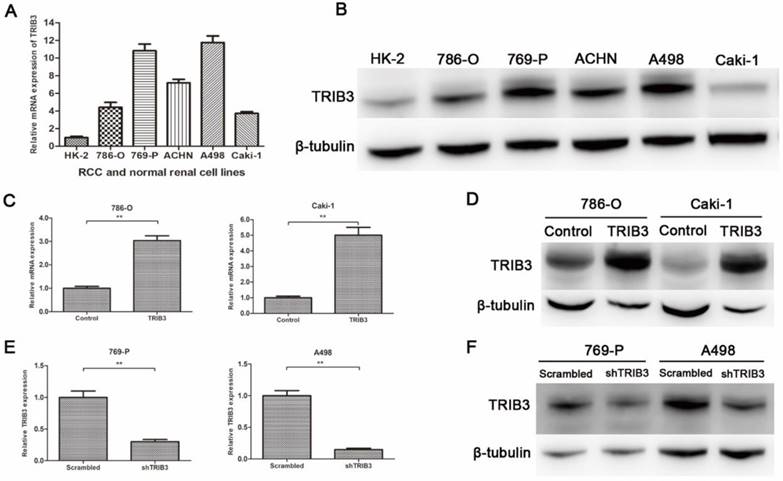
TRIB3 expression was low in HK-2 cells and high in multiple RCC cell lines (Figure 2A/B). To further investigate the biological functions of TRIB3 on RCC, we evaluated the overexpression and knockdown of TRIB3 in RCC cell lines. TRIB3 overexpression cell models were generated with 786-O and Caki-1 cells, which express TRIB3 at relatively low levels (Figure 2C/D). In contrast, TRIB3 knockdown cell models were established in 769-P and A498 cells, which express TRIB3 at relatively high levels (Figure 2E/F). The transfection efficiency was verified at the mRNA and protein levels.
TRIB3 expression in RCC tissues and its correlation with clinicopathological features. A/B/E: Immunochemical staining indicated that TRIB3 expression was higher in RCC tissues than in normal paracancerous tissues. TRIB3 expression was localized in nucleus. C/D: HIF‑1α and HIF‑2α are highly expressed in RCC tissues. F-H: TRIB3 is highly expressed in fresh RCC tissues at both the mRNA and protein level. J: Progression-free survival was better in the TRIB3 low/no expression group than in the high expression group, although this difference was not statistically significant (P = 0.493).
TRIB3 expression in RCC cell lines and verification of transfection efficiency. A/B: TRIB3 was expressed at low levels in HK-2 cells and at high levels in multiple RCC cell lines. C/D: Transfection efficiency of 786-O and Caki-1 cells transfected with a TRIB3 overexpression lentivirus. E/F: Transfection efficiency of 769-P and A498 cells transfected with a TRIB3 knockdown lentivirus. “ ** ” represents P < 0.01.
Overexpression of TRIB3 promotes 786-O and Caki-1 cell proliferation, migration and invasion
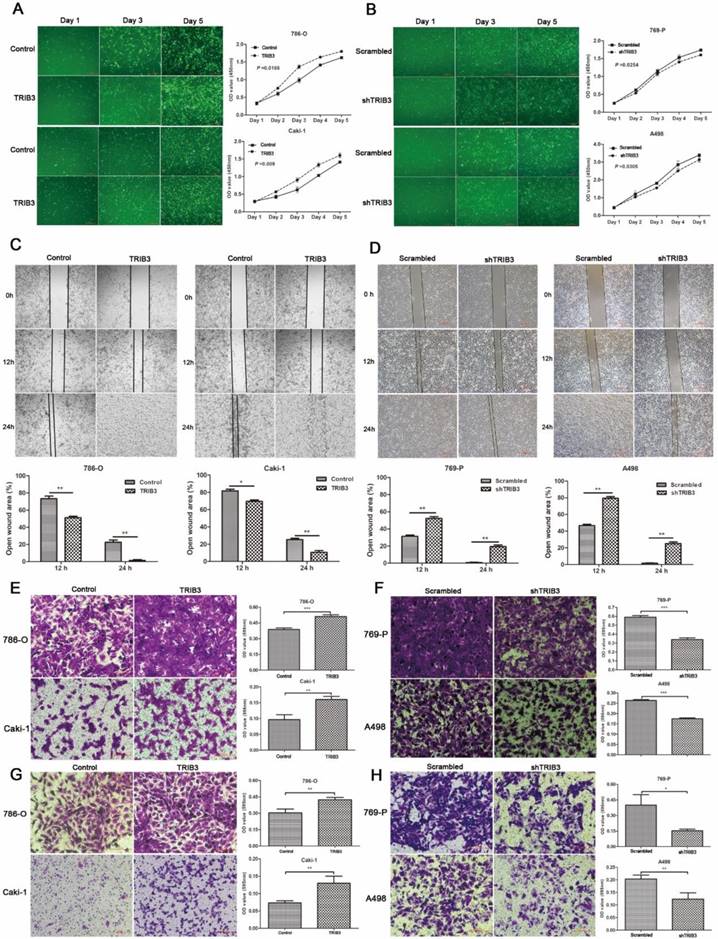
A TRIB3 overexpression lentivirus (LV-TRIB3) and a negative control lentivirus (LV-control) were transfected into 786-O and Caki-1 cells to establish TRIB3 overexpression cell models. CCK-8 assays showed that TRIB3 overexpression significantly promoted proliferation in 786-O (P = 0.0188, Figure 3A) and Caki-1 cells (P = 0.009, Figure 3A). Wound healing assays indicated that overexpression of TRIB3 promoted the migration of both 786-O and Caki-1 cells (P < 0.05, Figure 3C). Furthermore, the cell motilities of the TRIB3-overexpressing and negative control 786-O and Caki-1 cells were compared using Matrigel-free transwell assays. The results were consistent with those of the wound healing assay (P < 0.01, Figure 3E). Since aggressive invasion is critical for tumor metastasis, in Matrigel-coated transwell assays, upregulation of TRIB3 markedly increased the invasive abilities of 786-O and Caki-1 cells in TRIB3-overexpressing cells compared to those of negative controls (P < 0.01, Figure 3G). In summary, the results show the potential of TRIB3 to promote the proliferation, migration and invasion of 786-O and Caki-1 cells.
Downregulation of TRIB3 suppresses 769-P and A498 cell proliferation, migration and invasion
In 769-P and A498 cell lines, a TRIB3 knockdown lentivirus (LV-shTRIB3) and a non-targeting control lentivirus (LV-scrambled) were transfected to generate TRIB3 knockdown cell models. Cell proliferation assays showed a decreased proliferation rate in the TRIB3 knockdown groups compared with those in the nontargeting control groups (P < 0.05, Figure 3B). Downregulation of TRIB3 also inhibited the migration potential of 769-P and A498 cells (P < 0.01, Figure 3D/F). In addition, the invasive potential of 769-P and A498 cells was decreased in the TRIB3 knockdown groups compared to those in the nontargeting control groups (P < 0.05, Figure 3H). Thus, knockdown of TRIB3 in 769-P and A498 cells significantly inhibited the cell proliferation, migration and invasion.
TRIB3 promotes the growth of RCC xenografts in vivo
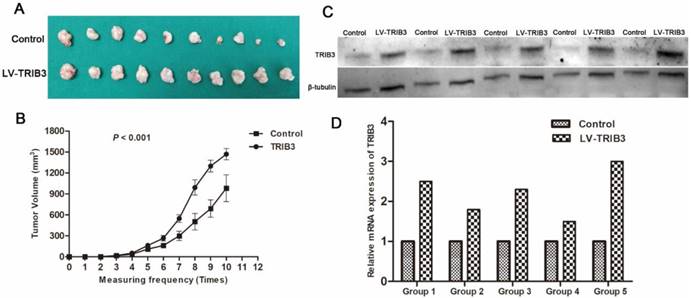
To further evaluate the effect of TRIB3 overexpression on tumor growth in vivo, 786-O cells stably overexpressing TRIB3 or a control vector were implanted into nude mice. As shown, the xenograft tumor volume was significantly increased in the TRIB3-overexpressing tumors compared to that in negative controls (P < 0.001, Figure 4A/B). In addition, we detected the mRNA and protein expression levels of TRIB3 in five pairs of xenograft tumors, revealing higher levels in the TRIB3 overexpression group than in the control group (Figure 4C/D).
RCC cell proliferation, migration and invasion assays. A: CCK-8 assays show that TRIB3 overexpression significantly promotes the proliferation of 786-O (P = 0.0188) and Caki-1 cells (P = 0.009). B: A decreased proliferation rate was detected in TRIB3 knockdown cells compared with that in nontargeting control cells (P < 0.05). C/E: Wound healing assays and Matrigel-free transwell assays indicate that overexpression of TRIB3 promotes the migration of 786-O and Caki-1 cells (P < 0.05). D/F: Downregulation of TRIB3 also inhibits the migration of 769-P and A498 cells (P < 0.01). G: In Matrigel-coated transwell assays, overexpression of TRIB3 markedly increases the invasive ability of 786-O and Caki-1 cells (P < 0.01). H: TRIB3 knockdown decreases the invasive potential of 769-P and A498 cells (P < 0.05). “ * ” represents P < 0.05, “ ** ” represents P < 0.01, “ *** ” represents P < 0.001.
In vivo study. A/B: The xenograft tumor volume was significantly higher in the TRIB3 overexpression group than in the negative control group (P < 0.001). C/D: The mRNA and protein expression levels of TRIB3 were higher in the TRIB3 overexpression group than in the control group.
TRIB3 promotes RCC cell proliferation and invasion via activating MAPK pathways
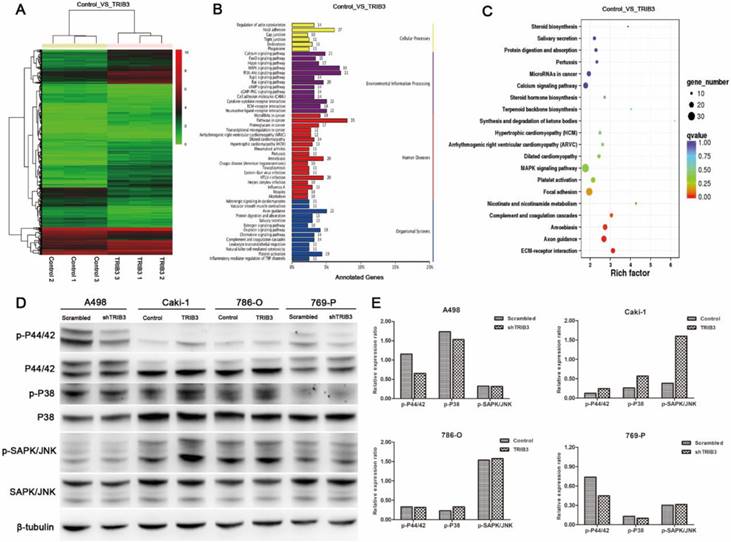
Considering the above results that TRIB3 promoted RCC cell proliferation, migration and invasion in vitro and accelerated RCC xenograft tumor growth in vivo, we performed RNA-sequencing with Caki-1 cells and compared the differentially expressed genes at the transcriptional level between TRIB3-overexpressing and control cells (Figure 5A, Supplement 2). Bioinformatics analysis revealed that the genes affected by TRIB3 overexpression were significantly involved in various signaling pathways, particularly MAPK signaling (Figure 5B/C). Subsequently, the results were further verified by western blot (Figure 5D/E), showing that the phosphorylation of P44/42 and P38 was reduced in both A498 and 769-P cells in response to TRIB3 knockdown. In Caki-1 cells, the phosphorylation of P44/42, P38 and SAPK/JNK was increased in response to TRIB3 overexpression. In 786-O cells, only upregulated expression of phospho-P38 was observed in response to TRIB3 overexpression.
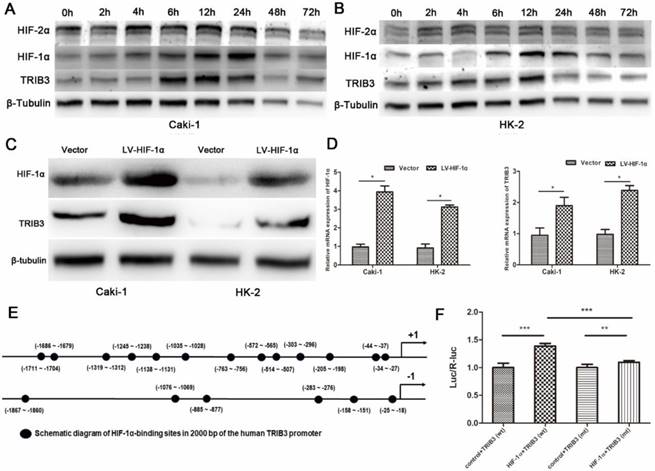
HIF-1α upregulates the expression of TRIB3 during hypoxia
TRIB3 is a scaffold protein that is activated under hypoxic conditions and involved in multiple cellular pathways. To further evaluate the regulation of hypoxia on TRIB3 expression in Caki-1 and HK-2 cells, we simulated hypoxia with CoCl2 and assessed the changes in TRIB3, HIF-1α and HIF-2α expression. As the hypoxia time increased, the TRIB3 and HIF-1α expression gradually increased and appeared to be positively correlated (Figure 6A/B). The expression of HIF-2α was also upregulated during hypoxia but was not correlated with TRIB3 expression (Figure 6A/B). Subsequently, we investigated whether HIF-1α regulates TRIB3 activity. As shown in Figure 6E, the transcription factor HIF-1α directly binds to multiple regions of the TRIB3 promoter. Luciferase reporter assays revealed that excising HIF-1α binding sites from the TRIB3 promoter significantly attenuated the expression of TRIB3 (P < 0.01, Figure 6F). These preliminary data demonstrate that TRIB3 is a direct target of HIF-1α. To further verify the regulation of TRIB3 by HIF-1α, we overexpressed HIF-1α in Caik-1 and HK-2 cells. The results indicated that overexpression of HIF-1α upregulates TRIB3 expression (Figure 6C/D). Taken together, it indicates that the transcription factor HIF-1α regulates TRIB3 expression by binding to its promoter region.
Discussion
TRIB3, a member of the mammalian pseudokinase tribbles family, plays a pivotal role in the unfolded protein response (UPR) [5] and is an important stress-related gene involved in multiple biological processes [29]. In the present study, we showed that TRIB3 expression was significantly higher in RCC tissues than in normal paracancerous tissues. Moreover, increased TRIB3 expression was significantly associated with increased renal tumor size, high tumor T stage and poor prognosis. Previous studies also showed that TRIB3 is highly expressed in various cancers and closely related to the tumor stage, metastasis, recurrence and prognosis, suggesting that TRIB3 is a potential biomarker and target for cancer therapy [30, 31]. In the process of tumor growth, vigorous metabolism often leads to an insufficient supply of nutrients and energy, resulting in cellular hypoxia and metabolic stress. Hypoxia and glucose deficiency can upregulate the expression of TRIB3, which regulates a series of downstream biological processes to relieve cell stress and promote cell survival.
The molecular mechanisms by which TRIB3 promotes RCC cell proliferation and invasion. A: RNA-sequencing in Caki-1 cells to compare differential gene expression at the transcriptional level between the TRIB3 overexpression and control groups. B/C: Bioinformatics analysis revealed that the MAPK pathway was one of the most affected signaling pathways. D/E: The results of RNA-sequencing analysis were further verified by western blot.
Regulation of HIF-1α on TRIB3 expression. A/B: TRIB3 and HIF-1α expression are gradually increased in response to hypoxia and appear to be positively correlated. No obvious correlation was observed between HIF-2α and TRIB3 expression. C/D: Overexpression of HIF-1α in Caik-1 and HK-2 cells upregulates TRIB3 expression. E/F: HIF-1α directly binds to multiple regions of the TRIB3 promoter. Luciferase reporter assays revealed that excising HIF-1α binding sites in the TRIB3 promoter significantly attenuates the expression of TRIB3 (P < 0.01). “ * ” represents P < 0.05, “ ** ” represents P < 0.01, “ *** ” represents P < 0.001.
In this study, a series of cytological experiments were performed to clarify the biological functions of TRIB3 in RCC. Lentivirus-mediated TRIB3 knockdown markedly suppressed the proliferation, migration and invasion of RCC cells with high endogenous expression of TRIB3. In contrast, overexpression of TRIB3 promoted the proliferation, migration and invasion of RCC cells with low endogenous expression of TRIB3. Additionally, overexpression of TRIB3 promoted the growth of RCC xenografts in vivo. It demonstrates that TRIB3 acts as a tumor promoter in human renal cancer. Hua et al. [13] found that overexpression of TRB3 enhanced the transcriptional activity of SMAD3, whereas knockdown of TRB3 reduced the activity, resulting in regulation of EMT in tumor cells. Zhou et al. [19] reported that knocking down TRIB3 in aggressive lung cancer cell lines significantly inhibited their malignant behaviors, including cell invasion and proliferation in vitro, as well as metastasis and tumor growth in vivo. Accordingly, these studies demonstrated that TRIB3 plays an important role in accelerating tumor cell proliferation, migration and invasion, suggesting an oncogenic role of TRIB3 in cancers.
Currently, the molecular mechanisms underlying the TRIB3-mediated regulation of biological functions in RCC have not yet been thoroughly addressed. Izrailit et al. [7] demonstrated that TRIB3 is a master regulator of Notch signaling via the MAPK-ERK and TGF-β pathways in breast cancer. In vitro and in vivo studies have illustrated the importance of TRIB3 for tumor growth. Subsequently, TRIB3 was shown to act as a stress and metabolic sensor and, together with USP9x, induce breast cancer cell survival and the tumor-promoting activities of Notch [10]. Hua et al. [3, 4] revealed that TRIB3 interacts with the autophagic receptor SQSTM1, linking insulin-IGF1 signaling to tumor development and progression. In this study, the mechanisms underlying the TRIB3 promotion of RCC cell proliferation, migration and invasion were detected by transcriptome sequencing and refined genome annotation. We found that TRIB3 regulates various signaling pathways, with the MAPK pathway being one of the most affected and crucial. The MAPK signaling pathway is widely expressed and plays key roles in many biological processes, including cell proliferation, migration, invasion, death and differentiation [32, 33]. MAPKs are activated by a variety of stimuli, including cytokines, hormones and various cellular stress responses, such as oxidative stress and endoplasmic reticulum stress [34]. The MAPK signaling pathway contains four distinct cascades, including extracellular signal-related kinases (ERK1/2), p38-MAPK, Jun amino terminal kinases (JNK1/2/3) and ERK5 [35-38]. In this study, we observed that knockdown of TRIB3 reduced the phosphorylation of P44/42 and P38 in A498 and 769-P cells. Overexpressing TRIB3 increased the expression of phosphorylated P44/42, P38 and SAPK/JNK in Caki-1 cells. However, in 786-O cells, upregulated expression of only phospho-P38 was observed in response to TRIB3 overexpression. Thus, our preliminary findings demonstrate that the MAPK signaling pathway, along with other pathways, plays a key role in RCC proliferation, migration and invasion.
As a cellular stress sensor, TRIB3 is upregulated in response to nutrient deprivation, hypoxia, oxidative stress and endoplasmic reticulum stress. In this study, we evaluated the effect of hypoxia on TRIB3 expression and found that HIF‑1α expression was significantly associated with TRIB3 expression. Furthermore, the transcription factor HIF-1α directly binds to multiple regions of the TRIB3 promoter and regulates its expression. As an important transcription factor, HIF-1α not only regulates the expression of various genes related to angiogenesis, oxygen-carrying proteins and glucose metabolism enzymes, but also plays a key factor in the development of RCC [39, 40]. In this study, we identified a novel molecular mechanism by which HIF‑1α regulates TRIB3 expression.
In conclusion, this study shows that increased TRIB3 expression enhanced RCC cell proliferation, migration and invasion abilities by regulating the MAPK pathway. We also demonstrated that TRIB3 expression is induced by HIF-1α. Our results not only reveal the mechanisms underlying TRIB3-mediated tumor progression but also provide new insight into the development of TRIB3 as a tumor biomarker and therapeutic target. However, a large cohort with long-term follow-up is needed to clarify the effect of TRIB3 expression on the prognosis of RCC. The translational application of TRIB3 also needs to be further investigated.
Supplementary Material
Supplementary information and figure.
Supplementary table.
Acknowledgements
We sincerely thank DF (Medical Experiment Center, Peking University First Hospital) for his technical assistance and guidance during this study, Prof. QH (Department of Urologic Pathology, Peking University First Hospital) and Dr. YZ (Department of Pathology, Beijing Chaoyang Hospital) for their assistance with the immunohistochemistry analysis.
Funding Information
This study was funded by the National Natural Science Foundation of China (grant 81572506), the Special Health Development Research Project of Capital (grant 2016-2-4074), and the Fundamental Research Funds for the Central Universities (grant BMU2018JI002).
Author Contributions
Conception, experiments and writing: BH.
Development of methodology: LC, NZ.
Analysis or Interpretation of Data: JCZ, KM, JFZ, HX, KZ, LL.
Funding acquisition and project administration: KG, ZZ.
Competing Interests
The authors have declared that no competing interest exists.
References
1. Mata J, Curado S, Ephrussi A. et al. Tribbles coordinates mitosis and morphogenesis in Drosophila by regulating string/CDC25 proteolysis. Cell. 2000;101:511-522
2. Yokoyama T, Nakamura T. Tribbles in disease: Signaling pathways important for cellular function and neoplastic transformation. Cancer Sci. 2011;102:1115-1122
3. Hua F, Li K, Yu JJ. et al. The TRIB3-SQSTM1 interaction mediates metabolic stress-promoted tumorigenesis and progression via suppressing autophagic and proteasomal degradation. Autophagy. 2015;11:1929-1931
4. Hua F, Li K, Yu JJ. et al. TRB3 links insulin/IGF to tumour promotion by interacting with p62 and impeding autophagic/proteasomal degradations. Nat Commun. 2015;6:7951
5. Sakai S, Miyajima C, Uchida C. et al. Tribbles-Related Protein Family Members as Regulators or Substrates of the Ubiquitin-Proteasome System in Cancer Development. Curr Cancer Drug Targets. 2016;16:147-156
6. Rzymski T, Paantjens A, Bod J. et al. Multiple pathways are involved in the anoxia response of SKIP3 including HuR-regulated RNA stability, NF-kappaB and ATF4. Oncogene. 2008;27:4532-4543
7. Izrailit J, Berman HK, Datti A. et al. High throughput kinase inhibitor screens reveal TRB3 and MAPK-ERK/TGFbeta pathways as fundamental Notch regulators in breast cancer. Proc Natl Acad Sci U S A. 2013;110:1714-1719
8. Boudeau J, Miranda-Saavedra D, Barton GJ. et al. Emerging roles of pseudokinases. Trends Cell Biol. 2006;16:443-452
9. Miyoshi N, Ishii H, Mimori K. et al. Abnormal expression of TRIB3 in colorectal cancer: a novel marker for prognosis. Br J Cancer. 2009;101:1664-1670
10. Izrailit J, Jaiswal A, Zheng W. et al. Cellular stress induces TRB3/USP9x-dependent Notch activation in cancer. Oncogene. 2017;36:1048-1057
11. Tang B, Li Q, Zhao XH. et al. Shiga toxins induce autophagic cell death in intestinal epithelial cells via the endoplasmic reticulum stress pathway. Autophagy. 2015;11:344-354
12. Angyal A, Kiss-Toth E. The tribbles gene family and lipoprotein metabolism. Curr Opin Lipidol. 2012;23:122-126
13. Hua F, Mu R, Liu J. et al. TRB3 interacts with SMAD3 promoting tumor cell migration and invasion. J Cell Sci. 2011;124:3235-3246
14. Ohoka N, Yoshii S, Hattori T. et al. TRB3, a novel ER stress-inducible gene, is induced via ATF4-CHOP pathway and is involved in cell death. EMBO J. 2005;24:1243-1255
15. Schwarzer R, Dames S, Tondera D. et al. TRB3 is a PI 3-kinase dependent indicator for nutrient starvation. Cell Signal. 2006;18:899-909
16. Bowers AJ, Scully S, Boylan JF. SKIP3, a novel Drosophila tribbles ortholog, is overexpressed in human tumors and is regulated by hypoxia. Oncogene. 2003;22:2823-2835
17. Zhou Y, Li L, Liu Q. et al. E3 ubiquitin ligase SIAH1 mediates ubiquitination and degradation of TRB3. Cell Signal. 2008;20:942-948
18. Wennemers M, Bussink J, Scheijen B. et al. Tribbles homolog 3 denotes a poor prognosis in breast cancer and is involved in hypoxia response. Breast Cancer Res. 2011;13:R82
19. Zhou H, Luo Y, Chen JH. et al. Knockdown of TRB3 induces apoptosis in human lung adenocarcinoma cells through regulation of Notch 1 expression. Mol Med Rep. 2013;8:47-52
20. Pan M, Reid MA, Lowman XH. et al. Regional glutamine deficiency in tumours promotes dedifferentiation through inhibition of histone demethylation. Nat Cell Biol. 2016;18:1090-1101
21. Morgan RG, Molnar E, Jones RF. et al. Nutrient stress alters the glycosylation status of LGR5 resulting in reduced protein stability and membrane localisation in colorectal tumour cells: implications for targeting cancer stem cells. Br J Cancer. 2015;112:714-719
22. Quail DF, Joyce JA. Microenvironmental regulation of tumor progression and metastasis. Nat Med. 2013;19:1423-1437
23. Wennemers M, Bussink J, Grebenchtchikov N. et al. TRIB3 protein denotes a good prognosis in breast cancer patients and is associated with hypoxia sensitivity. Radiother Oncol. 2011;101:198-202
24. Erazo T, Lorente M, Lopez-Plana A. et al. The New Antitumor Drug ABTL0812 Inhibits the Akt/mTORC1 Axis by Upregulating Tribbles-3 Pseudokinase. Clin Cancer Res. 2016;22:2508-2519
25. Ning XH, Li T, Gong YQ. et al. Association between FBP1 and hypoxia-related gene expression in clear cell renal cell carcinoma. Oncol Lett. 2016;11:4095-4098
26. Kaemmerer D, Peter L, Lupp A. et al. Comparing of IRS and Her2 as immunohistochemical scoring schemes in gastroenteropancreatic neuroendocrine tumors. Int J Clin Exp Pathol. 2012;5:187-194
27. Oh SW, Ahn JM, Lee YM. et al. Activation of hypoxia-inducible factor by cobalt is associated with the attenuation of tissue injury and apoptosis in cyclosporine-induced nephropathy. Tohoku J Exp Med. 2012;226:197-206
28. Olufsen M, Cangialosi MV, Arukwe A. Modulation of membrane lipid composition and homeostasis in salmon hepatocytes exposed to hypoxia and perfluorooctane sulfonamide, given singly or in combination. PLoS One. 2014;9:e102485
29. Eyers PA, Keeshan K, Kannan N. Tribbles in the 21st Century: The Evolving Roles of Tribbles Pseudokinases in Biology and Disease. Trends Cell Biol. 2017;27:284-298
30. Ding CZ, Guo XF, Wang GL. et al. High glucose contributes to the proliferation and migration of non-small cell lung cancer cells via GAS5-TRIB3 axis. Biosci Rep. 2018 [Epub ahead of print]
31. Snezhkina AV, Krasnov GS, Zaretsky AR. et al. Differential expression of alternatively spliced transcripts related to energy metabolism in colorectal cancer. BMC Genomics. 2016;17:1011
32. Sebolt-Leopold JS, Herrera R. Targeting the mitogen-activated protein kinase cascade to treat cancer. Nat Rev Cancer. 2004;4:937-947
33. Burotto M, Chiou VL, Lee JM. et al. The MAPK pathway across different malignancies: a new perspective. Cancer. 2014;120:3446-3456
34. Kyriakis JM, Avruch J. Mammalian mitogen-activated protein kinase signal transduction pathways activated by stress and inflammation. Physiol Rev. 2001;81:807-869
35. Wagner EF, Nebreda AR. Signal integration by JNK and p38 MAPK pathways in cancer development. Nat Rev Cancer. 2009;9:537-549
36. Kim EK, Choi EJ. Pathological roles of MAPK signaling pathways in human diseases. Biochim Biophys Acta. 2010;1802:396-405
37. Yang M, Huang CZ. Mitogen-activated protein kinase signaling pathway and invasion and metastasis of gastric cancer. World J Gastroenterol. 2015;21:11673-11679
38. Chang L, Karin M. Mammalian MAP kinase signalling cascades. Nature. 2001;410:37-40
39. Gudas LJ, Fu L, Minton DR. et al. The role of HIF1alpha in renal cell carcinoma tumorigenesis. J Mol Med (Berl). 2014;92:825-836
40. Keith B, Johnson RS, Simon MC. HIF1alpha and HIF2alpha: sibling rivalry in hypoxic tumour growth and progression. Nat Rev Cancer. 2011;12:9-22
Author contact
![]() Corresponding authors: Kan Gong, Zhongyuan Zhang. Address: No. 8, Xishiku Street, Xicheng District, Beijing 100034, China, Tel: +86-010-83575101, Fax: +86-010-66551122, E-mail: gongkan_pkucom; bluesky20080001net
Corresponding authors: Kan Gong, Zhongyuan Zhang. Address: No. 8, Xishiku Street, Xicheng District, Beijing 100034, China, Tel: +86-010-83575101, Fax: +86-010-66551122, E-mail: gongkan_pkucom; bluesky20080001net
Received 2018-9-5
Accepted 2018-11-15
Published 2019-1-1