ISSN: 1449-2288International Journal of Biological Sciences
- Current issue
- Volume 20; 2024
- Volume 19; 2023
- Volume 18; 2022
- Volume 17; 2021
- Volume 16; 2020
- Archive
- Advance articles
- Cover images
- Index & coverage
- Cover suggestion
- Special issues
Introduction
Materials and methods
Results
Discussion
Conclusion
Abbreviations
Acknowledgements
References

Int J Biol Sci 2019; 15(5):973-983. doi:10.7150/ijbs.30013 This issue Cite
Research Paper
A Comprehensive Study of High Cholesterol Diet-Induced Larval Zebrafish Model: A Short-Time In Vivo Screening Method for Non-Alcoholic Fatty Liver Disease Drugs
Ji Ma1,2,3*, Hongli Yin1,2,3*, Maoru Li1,2,3*, Yang Deng1,2,3, Owais Ahmad4, Guohong Qin1,2,3, Qiangqiang He5, Jiajing Li1,2,3, Kai Gao6, Junyi Zhu1,2,3, Bing Wang1,2,3, Susu Wu1,2,3, Tao Wang7 ![]() , Jing Shang1,2,3,5
, Jing Shang1,2,3,5 ![]()
1. School of Traditional Chinese Pharmacy, China Pharmaceutical University, Nanjing 211198, China;
2. State Key Laboratory of Natural Medicines, China Pharmaceutical University, Nanjing 210009, China;
3. Jiangsu Key Laboratory of TCM Evaluation and Translational Research, China Pharmaceutical University, Nanjing 211198, China;
4. School of life sciences, China Pharmaceutical University, Nanjing 211198, China;
5. Qinghai Key Laboratory of Tibetan Medicine Pharmacology and Safety Evaluation, Northwest Institute of Plateau Biology, Chinese Academy of Sciences, Xining 810008, Qinghai Province, China;
6. Nanjing Ruiying Runze Biopharmaceutical Technology Co., Inc, Nanjing 210000, China;
7. Jiangsu Key Laboratory of Drug Screening, China Pharmaceutical University, Nanjing 210009, China.
*These three authors contributed equally to this work.
Abstract

Non-alcoholic fatty liver disease (NAFLD) is the most common chronic liver disease around the world. However, there is still no drug for NAFLD in the market, the study of potential therapeutic drugs on NAFLD is extraordinarily pressing and urgent. The rodent models for NAFLD drugs' study are always with a long time cost. Therefore, we aim to establish a short-time NAFLD drug screening model. A laboratory-made high cholesterol diet was used on larval zebrafish for 3 weeks to establish the NAFLD screen model. Lipid metabolism, oxidant stress, and pathology were studied to comprehensively demonstrate the whole spectrum of NAFLD on this model. Bezafibrate and pioglitazone were used to evaluate the model. Moreover, mechanism research was performed on this model.The NAFLD larval zebrafish model was established with the comprehensive process of NAFLD. Moreover, multiple index on lipid metabolism, oxidant stress, hepatic steatosis, and hepatic inflammation can be easily tested for drug screening. Furthermore, this model can be used to perform the mechanism research by testing mRNA expression. The NAFLD larval zebrafish model is a comprehensive short-time screening method for NAFLD drugs.
Keywords: non-alcoholic fatty liver disease, non-alcoholic steatohepatitis, larval zebrafish, high cholesterol diet
Introduction
Non-alcoholic fatty liver disease (NAFLD) is the most common chronic liver disease with a worldwide prevalence of 14% to 32% and still increasing[1]. NAFLD has spectrum stages from non-alcoholic fatty liver (NAFL) to non-alcoholic steatohepatitis (NASH). NAFL stage is characterized as the excrescent lipid accumulation in the liver. NASH stage has been considered as the crucial aggressive stage which leads to the further deterioration of liver due to multiple pathogenic factors [2]. With such a vast and vital medical need, there is still no drug for NAFLD/ NASH in the market, and the development of NAFLD therapeutic drugs is still insufficient due to its complicated pathogenesis. Therefore, the study of potential therapeutic drugs on NAFLD is extraordinarily pressing and urgent[3].
The classical methods to study NAFLD drugs are using in vivo rodent or in vitro cell line models[4]. A lot of rodent models are established to test NAFLD drugs and performed well. However, rodent models are unable to perform high-throughput screening due to the long time and high cost they need. Moreover, many new compounds from natural product extraction or synthesis are always with a little yield, which means it is difficult to screen them on rodent models due to the quantity demand. As a standard high-fat diet (HFD) induced SD rat NAFLD model showed that the rats started NAFL feature from 8th week to 12th week, and a NASH feature begins at 12th week.[5]. It is not difficult to calculate how much drugs and times need to be carried out for this model. Meanwhile, in vitro models have many limits on systemic diseases such as multiple-staged NAFLD. Therefore, a short-time in vivo model, which demands fewer compounds, is urgent to establish for screening NAFLD drugs.
Zebrafish (Danio rerio) models have become to be attractive and recognized models on studying human disease due to it many advantages in natural proliferation and physiological similarity with mammals[6]. Moreover, larval zebrafish have a transparency feature, which makes it easy to observe the pathological changes of the organism, like lipid accumulation and hepatic injury[7, 8]. Recently, NAFLD zebrafish models were established by chemical induction, dietary treatment and transgenic technology[9-11]. Based on these reports and the knowledge on the spectrum of NAFLD from NAFL to NASH, there still has been a lack of study on progressing in multiple stages of NAFLD on larval zebrafish model, especially there still few researches on NASH zebrafish model.
Due to the tinny size of larval zebrafish, the experimental diet for larval zebrafish is challenging to manufacture, and commercial high-fat diets still without any standard. Hence, it is required to establish an easy and convenient laboratory-made diet for NAFLD larval zebrafish models. Cholesterol is a virtual component of the human body. However, high levels of cholesterol are considered as a risk factor for multiple metabolic diseases[12]. Moreover, high levels of cholesterol in diet proved to be an effective ingredient and was successfully used in inflammatory zebrafish model previously[13, 14]. Therefore, high cholesterol diets seem to be a considerable choice for NAFLD models.
Based on the knowledge of NAFLD and larval zebrafish, the present study devotes to provide a comprehensive study of NAFLD progressing on a fast screening larval zebrafish model, moreover, a laboratory-made high cholesterol diet (HCD) will be established, finally, the performance of this screening method with be tested by multiple therapeutic drugs.
Materials and methods
Chemicals
Cholesterol (92.5% GC), Pioglitazone (99%), Oil Red O (75%) and 2', 7'-dichlorofluorescein diacetate (DCFH-DA) were purchased from Sigma-Aldrich (St. Louis, USA). Bezafibrate (98%) and Nile Red (95%) was purchased from Aladdin (Shanghai, China).
Preparation of high cholesterol diet and drug solutions
Basic larval zebrafish food(AP100) was purchased from Zeigler (PA, USA). The food contents 12% crude fat and 50% crude protein. The HCD food was prepared by mixing cholesterol with basic food in diethyl ether (2ml per gram of food) firstly, and then volatilized the diethyl ether of HCD with a water bath at 60℃. The final concentration of cholesterol in HCD was 5%(w/w). The normal diet(ND) was prepared using only diethyl ether as the same method as HCD. For drug solutions, due to the low solubility of pioglitazone(PIO) and bezafibrate (BZT) in water, we used DMSO to solve the drugs and diluted with water to 10μM/L (0.001% DMSO v/v)[15, 16] as a final concentration for the administration in zebrafish.
Maintenance of larval zebrafish and treatment
The wild-type AB-line adult zebrafish were maintained in circulated water with a 14:10 h light-dark cycle at 28.5°C. Embryos were generated by natural spawning from parent zebrafish. After 3-day adaption from 5-day post fertilization (dpf), we separated 100 larval zebrafish to 1L tank for each group randomly. The HCD group or drug groups were fed with HCD (20mg/tank per day) followed the schedule as shown in Figures (Fig. 1A, Fig. 4A) from 8dpf. The control group was fed with ND from 8dpf. And for BZT and PIO groups, the 10μM/L drugs were administrated from 8dpf. Different durations of the experiment design (1 week, 2 weeks or 3 weeks) were marked in figures (Fig. 1A, Fig. 4A). All the animals experiment was approved by the Science and Technology Department of Jiangsu Province and followed the Jiangsu Provincial standard ethical guidelines for the use of experimental animals under the ethical committees mentioned above.
Biochemical measurement
The 5 larval zebrafish were sacrificed as one sample, and 6 samples were prepared for testing each index. Triglyceride (TG) levels, total cholesterol (TC) levels, superoxide dismutase (SOD) activity, and malondialdehyde (MDA) level were measured by commercial assay kits (Jiancheng, Nanjing, China) following the manufacturer's instructions. All the quantitation of above kits was read by a multifunctional microplate reader. Quantitation of reactive oxygen species (ROS) was detected by Reactive Oxygen Species Assay Kit of DCFH-DA method (BeyoTime, China) following the manufacturer's instructions. Every sample was incubated with PBS containing 10µM DCFH-DA for 30 min at 37 ˚C. Fluorescence intensity was measured at 530nm with excitation wavelength of 485nm using a fluorescence plate reader (BioTek, USA).
Fluorescence Photography
Nile red is a lipophilic fluorescence material which can stain the TG and fatty acid. It can be detected at 543 nm (excitation wavelength) and 598 nm (scattering light). DCFH-DA is an indicator of ROS. DCFH-DA do not have any fluorescence property; only when ROS is oxidizing, it will perform fluorescence property by its oxidized product. Larval zebrafish were incubated with 0.5μg/ml Nile red or 10μM/L DCFH-DA (diluted with embryo water) for 30min at 28.5 ˚C separately. The larval zebrafish were washed with embryo water for 3 times and kept into CMC-Na (4%) on a glass slide for fixation. We immediately used fluorescence stereoscope (Olympus SZX16) to observe and captured the Nile red for lipid at 543 nm (excitation wavelength) and 598 nm (scattering light). And we immediately captured oxidized product of DCFH-DA for ROS at 530nm with excitation wavelength of 485nm using fluorescence stereoscope (Olympus SZX16). All the captures were taken with same parameters (exposure time, ISO and aperture) between different groups for comparison and all the above procedures were carried out in the dark.
Oil red O staining and Histopathology
The Oil red O staining was performed according to a previous report [10]. The hematoxylin and eosin (HE) staining was performed by Microworld Biotech, Co.Ltd.(Nanjing, China) using 4μm sections of larval zebrafish. All the staining were observed and captured on stereoscope (Olympus SZX16).
Real time-quantitative PCR (RT-qPCR) analysis
30 larval zebrafish of each group in the 2nd week experiment were sacrificed for the extraction of total RNA using Trizol reagent (Invitrogen, USA). Reverse transcription was performed by HiScript II Q RT SuperMix (Vazyme, China) for the synthesis of cDNA. The qPCR was performed on the StepOnePlus Real-Time PCR System (Applied Biosystems, USA) by adding the ChamQTM Universal SYBR qPCR Master Mix (Vazyme, China) and following the manufacturer's protocol. The specific sequences of primers used in this study were synthesized by General Biotech Co., Ltd (Shang Hai, China) and were shown in (Table 1). The 2-∆∆Ct method was used to calculate the expression levels of each targeting mRNAs by normalized to GAPDH.
Statistical analysis
All the data were expressed as mean ± SD. Graph Pad PRISM (Graph Pad Software, USA) was used for comparing the treatment group and corresponding control by one-way ANOVA for the significant difference. The differences between groups were considered statistically significant at p-value <0.05.
Results
Effect of high cholesterol diet on metabolic profiles and lipid accumulation in larval zebrafish
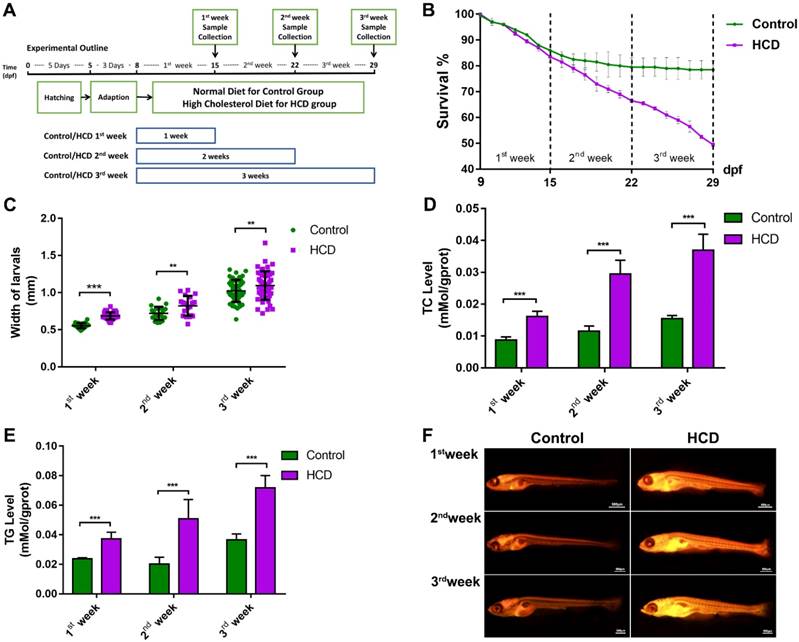
The effect of high cholesterol diet (5% cholesterol w/w) was tested on larval zebrafish from 8dpf to 29dpf in three different duration experiment (Fig.1A). As the result showed, control group and HCD group did not induce a significant difference of mortality in the first week of feeding. From the second week to the third week, the control group did not increase the death number of larval zebrafish obviously and kept a nearly 80% survival in last period of the experiment. However, HCD group continually increase the death number of larval zebrafish (Fig 1B). The width of larval abdomen in HCD groups showed a statistic wider than the control groups within all three period experiments (Fig 1C). The TC and TG level of HCD group continually showed a highly significant higher than the control group after first week's feeding to third week's feeding (Fig 1D, 1E). Furthermore, from Nile red staining we can see that the lipid accumulation increasingly distributed at the whole body of larval zebrafish after first week's feeding and aggravated after second and third week's feeding in HCD group compared with control group. Intriguingly, the lipid accumulation increased obviously in the abdomen of larval zebrafish(Fig.1F).
Effect of high cholesterol diet on metabolic oxidant stress in larval zebrafish
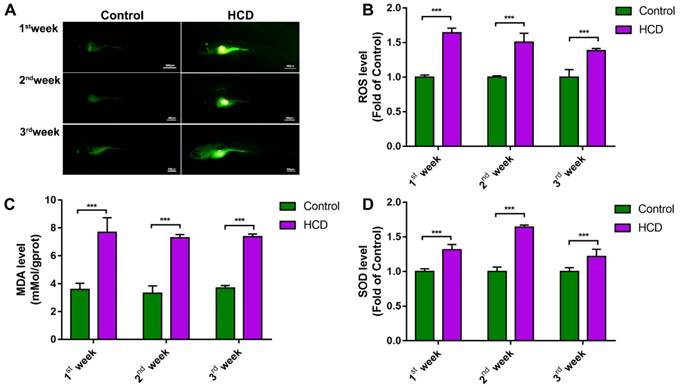
Due to the substantial connection between oxidant attack and NAFLD/NASH[17], we tested oxidant stress index in HCD induced larval zebrafish model. From DCFH-DA staining of ROS in larval zebrafish, we can see the ROS increasingly distributed in the abdomen of larval zebrafish after first week's feeding to third week's feeding in HCD group compared with control group (Fig.2A). Relative quantification of ROS level showed a significantly higher in HCD group than control in all three durations of feeding (Fig.2B). Measurement of MDA level showed a significant higher in HCD group than the control group of all three durations of experiments (Fig.2C). Moreover, SOD activity of larval zebrafish showed a continually increasing in all three durations of experiments (Fig. 2D).
Specific sequences of primers used in RT-qPCR
| Gene name | Accession number (Danio rerio) | Forward primer (5'->3') | Reverse primer (5'->3') | |
|---|---|---|---|---|
| Danio rerio | Equivalently homo sapiens | |||
| srebf1 | SREBP1 | NM_001105129 | CATCCACATGGCTCTGAGTG | CTCATCCACAAAGAAGCGGT |
| fasn | FAS | XM_005169478 | ATCTGTTCCTGTTCGATGGC | AGCATATCTCGGCTGACGTT |
| pparab | PPARα | NM_001102567 | CGTCGTCAGGTGTTTACGGT | AGGCACTTCTGGAATCGACA |
| cpt1a | CPT1 | NM_001044854.1 | ACTCTCGATGGACCCTGTGA | CTGGATGAAGGCATCTGGAC |
| pparg | PPARγ | NM_131467 | CTGCCGCATACACAAGAAGA | TCACGTCACTGGAGAACTCG |
| tnfa | TNFα | NM_212859 | GCTTATGAGCCATGCAGTGA | TGCCCAGTCTGTCTCCTTCT |
| il1b | IL1β | NM_212844 | TGGCGAACGTCATCCAAG | GGAGCACTGGGCGACGCATA |
| il6 | IL6 | NM_001261449 | AGACCGCTGCCTGTCTAAAA | TTTGATGTCGTTCACCAGGA |
| mmp9 | MMP9 | NM213123.1 | GAAGCGTTACGGCTACGT | TTCCATGTCTGGCGAATAG |
| tgfb1 | TGFβ | NM_182873.1 | CATAAGAGCCACAGACAGAAG | GTAGAGCGAGCGTAAACAG |
| keap1a | Keap1 | NM_182864.2 | CCAACGGCATAGAGGTAGTTAT | CCTGTATGTGGTAGGAGGGTT |
| nrf2 | Nrf2 | NM_182889.1 | TTGTCTTTGGTGAACGGAGGT | CTCGGAGGAGATGGAAGGAAG |
The specific sequences of primers used in this study are shown in the table. The Danio rerio primers were used on larval zebrafish. The equivalently Homo sapiens primers were listed for reference.
Effect of high cholesterol diet on metabolic profiles and lipid accumulation in larval zebrafish. (A) Experimental outline of HCD induced NAFLD larval zebrafish. (B) Survival rate of larval zebrafish (n=3). (C) Width changes of larval zebrafish (D) TC level of larval zebrafish (n=6). (E) TG level of larval zebrafish(n=6). (F) Nile red stain of larval zebrafish. Bar indicate means ± SD. n.s. P >0.05, *P <0.05, **P <0.01, ***P<0.001 represent significance of difference, P<0.05 was considered as statistically significant. Significant was calculated by ANOVA followed by turkey's test. n indicates the replicates of experiment.
Effect of high cholesterol diet on metabolic oxidant stress in larval zebrafish. (A) ROS production of Larval zebrafish stained by DCFH-DA and captured by fluorescence stereoscope (B) Quantitation of ROS level (n=6). (C) MDA level of larval zebrafish (n=6) (D) SOD activity of larval zebrafish (n=6). Bar indicate means ± SD. ***P<0.001 represent significance of difference, P<0.05 was considered as statistically significant. Significant was calculated by ANOVA followed by turkey's test. n indicates the replicates of experiment.
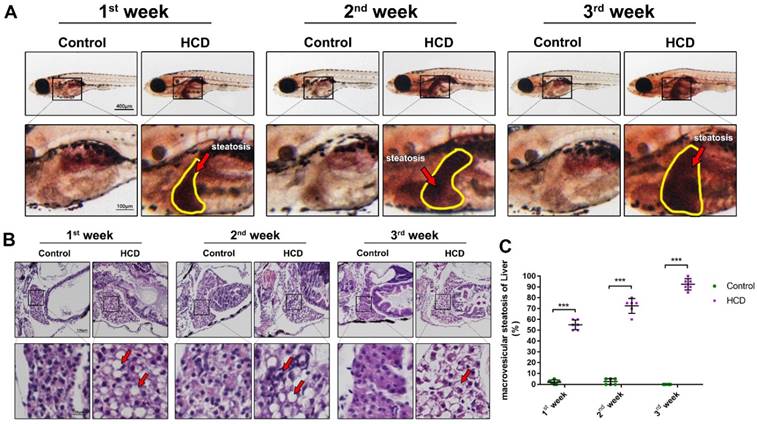
Effect of high cholesterol diet on hepatic steatosis in larval zebrafish. (A)Oil red O staining of larval zebrafish, the hepatic steatosis was point out with yellow circle. (B) HE staining of larval zebrafish liver, macrovesicular steatosis, possible fibrosis feature and ballooning degeneration were point out with red arrows. (C) Macrovesicular steatosis area percentage of larval zebrafish liver (evaluated by 6 experts).
Effect of high cholesterol diet on hepatic steatosis in larval zebrafish
To further investigate the effect of HCD in liver steatosis on larval zebrafish, we used oil red to stain the whole body of larval zebrafish and identified the liver steatosis using the method reported previously [10]. As result showed (Fig.3A), HCD larval zebrafish showed a significant liver steatosis after first week's feeding, then, liver steatosis continually aggravated after second and third week's feeding with HCD, however, control larval zebrafish did not show the liver steatosis. Moreover, we performed HE stain on sections of larval zebrafish to observe the pathological changes on the basis of NASH and NAFLD evaluation standard guidebook [18]. As the result of HE stain (Fig.3B) and the macrovesicular steatosis area evaluation showed (Fig.3C), after feeding with HCD for one week, the macrovesicular steatosis occupied over 50% of the liver, which can be identified as NAFLD. After two weeks feeding with HCD, the macrovesicular steatosis continually increased to 75% of whole liver, and possible fibrosis feature showed in sections, which is a hint of NASH processing. Remarkably, after three weeks feeding with HCD, the ballooning degeneration happened seriously with 90% macrovesicular steatosis on larval zebrafish liver, which can be identified as a typical NASH[19].
Evaluation of HCD induced larval zebrafish models by bezafibrate and pioglitazone treatments
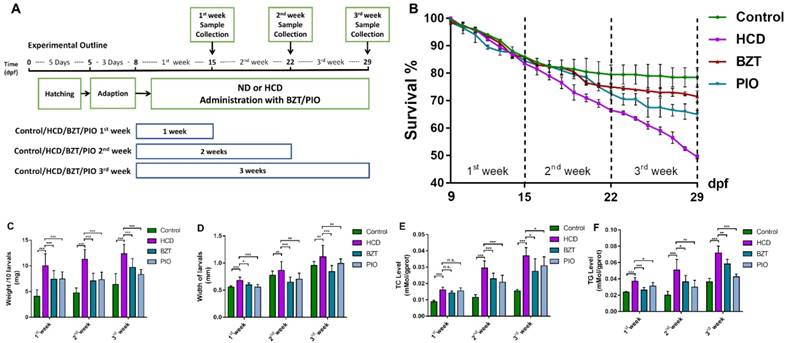
After the preliminary experiment, we believed NAFLD/NASH larval zebrafish models were successfully established due to the heavy lipid accumulation and the serious hepatic cellular inflammation on larval zebrafish. Then we used bezafibrate[20], a well-known lipid-lowering drug, and pioglitazone[21], a clinical treatment drug for type 2 diabetes (T2D) combined with NASH patients[22], to evaluate our models. As the result showed(Fig.4B), the survival of larval zebrafish in both BZT and PIO groups were reverted by both drugs after one or two week's feeding with HCD compared with control and HCD groups. However, PIO didn't keep the survival rate from the beginning of third week's feeding with HCD but still kept a higher survival rate than HCD groups at the end of the experiment. From weight data (Fig.4C) and width data (Fig.4D), we can see significant reduction effects on both PIO and BZT groups in all three periods of experiments. As TC results showed (Fig.4E), significant reduction effects of both drugs on drug groups were showed after 2 week's administration of drugs compared with HCD group. TG level was reverted after first week's administration of drugs on both drug groups and kept the revision effects to the end of the experiment of all three experiments compared with HCD group (Fig.4F).
Further evaluation of HCD induced 2-week larval zebrafish model by bezafibrate and pioglitazone treatments
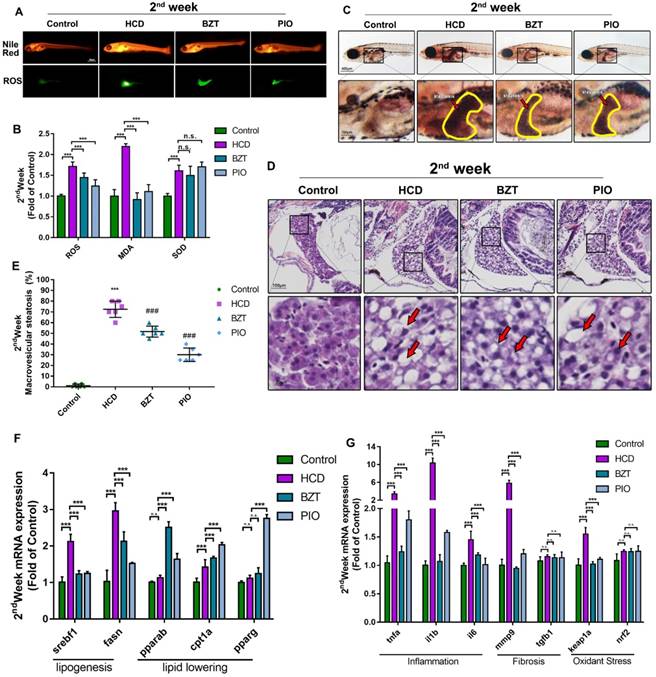
Compared on consideration of time cost and low mortality rate with drugs' efficiency on three durations of experiments, we chose the 2 weeks' HCD feeding model to do the further evaluation. From Nile red stain result we can see, the lipid-lowering effect of BZT and PIO were of the whole body and highlighted on the abdomen of larval zebrafish. DCFH-DA stain showed a significant reduction of ROS around the abdomen of larval zebrafish on both drug groups (Fig. 5A). Further anti-oxidant test result showed a significant reduction of ROS and MDA level on both drug groups, but the activity of SOD did not show any changes on two drug groups compared with HCD group (Fig.5B). From oil red O stain result we can obviously find a significant relief on liver steatosis on both drug groups (Fig.5C). And HE stains results further confirm the relief effect of both drugs on steatosis. Interestingly, microvesicular steatosis were mainly found in BZT group, however, the occupation scale of the macrovesicular steatosis were reduced in PIO group (Fig.5D).
To further evaluate the performance of 2nd-week HCD larval zebrafish model on mechanism research, we performed a real-time RT-PCR experiment to test the mRNA expression on lipogenesis, lipid-lowering, inflammation, fibrosis, and oxidant stress. From results we can see, both lipogenesis related mRNA srebf1 and fasn were increased significantly on HCD group and pulled back by both drugs compared with control (Fig.5F). Lipid-lowering related gene pparab, cpt1a, and pparg were increased in both drug groups (Fig.5F). What's more, from inflammation mRNA expression result showed, compared with control, all three well-known inflammation gene (tnfa, il1b, and il6) were increased extremely significant on HCD group and reduced by both drugs groups (Fig.5G). Moreover, one of the fibrosis-related gene expression (mmp9) was increased significantly on HCD group but the other (tgfb1) (Fig.5G). Finally, one of the gene (keap1) on oxidant stress were expressed increasingly on HCD group and pulled back by both drugs compared with control(Fig.5G). The other oxidant stress-related gene (nrf2) were increased without significant in all HCD treated groups include both drugs groups compared with control (Fig.5G).
Discussion
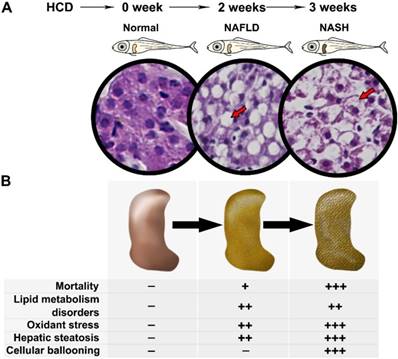
The present results demonstrated a comprehensive process of NAFLD on HCD induced larval zebrafish from NAFL to NASH (Fig.6A). The phenotype on lipid metabolism, lipid-induced oxidant stress, liver steatosis, and hepatic inflammation on larval zebrafish were carried out significantly in different process of NAFLD (Fig.6B). The typical NASH feature with ballooning degeneration was first established on larval zebrafish. Furthermore, two well-known drugs with clear pharmacodynamics and mechanism were used to validate this model, which proved that the model is a successful model that can be used to comprehensive screen NAFLD drugs with short times by multiple aspects.
Evaluation of HCD induced larval zebrafish models by bezafibrate and pioglitazone treatments. (A) Experimental outline of NAFLD larval zebrafish with BZT and PIO administration groups. (B) Survival rate of larval zebrafish (n=3). (C) weight changes of larval zebrafish (D) Width changes of larval zebrafish. (E)TC level of larval zebrafish (n=6). (F) TG level of larval zebrafish (n=6). Bar indicate means ± SD. n.s.P >0.05, *P <0.05, **P <0.01, ***P<0.001 represent significance of difference, P<0.05 was considered as statistically significant. Significant was calculated by ANOVA followed by turkey's test. n indicates the replicates of experiment.
The growth and development of larval zebrafish from 5dpf to 30dpf always has a natural mortality due to different living condition[23]. In present experiment condition (100 larval/L/tank), the natural mortality is about 15%~20% after 15dpf and kept stable to the end of the experiment. Importantly, the addition of cholesterol in the diet increased mortality of larval zebrafish obviously (Fig.1B), and there is no toxic pathology changes (i.e., Pericardium edema, pigment abnormal) found in HCD induced larval zebrafish, which indicates that mortality can be a sensitive index to evaluate drugs effects on this model. However, the length index (Fig.1C) of larval zebrafish did not show any significant changes in HCD groups, which we believe it is not an appropriate index for drug screening. Overlord of lipid accumulation is the basis pathogenesis of NAFLD, moreover, obesity has turned out to be highly related with NAFLD which performed as a lipid accumulation on the whole body[24]. Nile red is a selective fluorescent stain material for intracellular lipid droplets [25]. Due to the tiny size and transparency of larval zebrafish, it is possible to locate the whole body lipid accumulation easily by using Nile red stain on larval zebrafish. The figure 1F shows that, in the HCD group, the lipid increased in the whole body of the zebrafish. Interestingly, the lipid around the abdomen of larval zebrafish increased more obviously, where we speculate it as the location of liver tissue according to the anatomy of zebrafish. Combined the TC and TG levels (Fig.1D,1E), we believe that the HCD can increase the whole body lipid accumulation and possibly increase the lipid accumulation on liver of larval zebrafish.
Oxidant stress plays a crucial role in NAFLD according to the theory of “Two-hit” [26], the overlord oxidant stress production of ROS virtually damage the liver cell by destroying their antioxidant systems such as SOD[27]. Furthermore, lipid peroxidation production MDA and overload ROS induces the progress of liver steatosis, resulting in the “second hit” of NAFLD and further deteriorate of liver[28]. From the results, we can see (Fig. 2B, 2C) that high levels of ROS and MDA on whole body were sustained during all the three durations of the experiment. High-level of ROS were positioned around the abdomen as shown in Fig.2A which is the matching area with lipid accumulation (Fig.1F), so we considered that lipid accumulation may be the feature for high-level ROS and probably affected on the liver tissues. Furthermore, activity of SOD on HCD group showed a sustained higher than control group, which could consider that the antioxidant enzyme system of larval zebrafish was kept activating due to the high levels of ROS in body. We also speculated that the oxidant stress attacked by overlord lipid accumulation was not heavy enough to destroy the antioxidant enzyme system of larval zebrafish, so that the SOD kept activating during all three periods of the experiment. Therefore, we believe that the overlord of lipid accumulation induced oxidant stress attack on HCD groups.
To further study the HCD effect on liver tissues, we performed an oil red O staining to test the steatosis of larval zebrafish. As the method report before [10], we can quickly tell the steatosis liver on larval zebrafish(Fig. 3A). Reasonably, the scale of the steatosis on HCD group showed a time-dependent increasing, the three weeks' HCD larval zebrafish showed an extremely large and dark red in the liver area (Fig. 3A). Furthermore, we identified the liver steatosis by HE staining standard reported before[18]. Intriguingly, the lipid drops in liver which characterized as macrovesicular steatosis were showed in 1st-week experiment HCD group, and scale of macrovesicular occupied over 60% of the liver which reach the standard of NAFLD (Fig. 3B). Moreover, 80% of macrovesicular with possible fibrosis feature were found in 2nd-week experiment HCD group, which we can believed as a progressing of NAFLD, and a possible starting of the NASH stage(Fig. 3B). Remarkably, the ballooning degeneration were found with the seriously macrovesicular steatosis within whole liver on larval zebrafish, which achieved the standard of NASH demonstrably (Fig. 3B). Based on the results, we believed a typical NAFLD larval zebrafish model were built after 1week or 2week's feeding with HCD, and a NASH larval zebrafish model were built after 3weeks feeding with HCD. And for a further hepatic fibrosis larval model, we tried to use HCD induced the larval for 8 weeks, however the steatosis of liver decreased which we believed the reason is HCD made by basic larval zebrafish food cannot meet the nutrition need of that ages of the zebrafish (Usually the zebrafish older than 30dpfs are needed brine shrimp or paramecia for further nutrition).
Further evaluation of HCD induced 2 weeks larval zebrafish model by bezafibrate and pioglitazone treatments. (A) Nile red stain and ROS production of Larval zebrafish. (B) Oxidant stress index of ROS, MDA, and SOD of larval zebrafish (n=6). (C) Oil red O staining of larval zebrafish, the hepatic steatosis was point out with yellow circle. (D) HE staining of larval zebrafish liver, macrovesicular steatosis, and microvesicular steatosis were point out with red arrows. (E) Macrovesicular steatosis area percentage of larval zebrafish liver (evaluated by 6 experts). (F)mRNA expression of lipogenesis and lipid-lowering of larval zebrafish (n=6). (G) mRNA expression of inflammation, Fibrosis and oxidant stress of larval zebrafish (n=6). Bar indicate means ± SD. n.s.P >0.05, ***P<0.001 represent significance of difference, P<0.05 was considered as statistically significant. Significant was calculated by ANOVA followed by turkey's test. n indicates the replicates of experiment.
Spectrum of NAFLD on HCD induced larval zebrafish. (A) Processing of NAFLD on Larval zebrafish. (B) Multiple aspects changes in processing of NAFLD on Larval zebrafish.
In brief summary, based on the NAFLD/NASH larval zebrafish models we built above and the multiple test we performed, we believed the mortality, TC levels, TG levels and nile red stain could be the index of lipid metabolism for drug screening; The ROS staining, whole body ROS, MDA and SOD levels could be the lipid-induced oxidant stress index for drug screening; Moreover, the hepatic steatosis index of oil red O stain and HE stain could be the direct evidence on NAFLD/NASH drug screening. Upon these aspect of index, we further performed a drug evaluation test on the models to test whether these models could reflect the effect of effect-known drugs. Bezafibrate is a well-known PPARα agonist which takes the lipid-lowering effect on liver. Pioglitazone is widely used in T2D combined with NASH patients clinically, well-known as a PPARγ agonist. Due to there is still no marketing drugs for NAFLD or NASH, we choose the BZT and PIO to evaluate the larval zebrafish models. As the result showed, the mortality (Fig. 4B), TC and TG levels of whole body (Fig.4E,4E) significantly attenuated the changes by the both drugs on HCD feeding. Moreover, due to the length of HCD groups didn't show any changes, we added a weight test of larval zebrafish in drug evaluation test. The result showed the significant increase of weight in HCD groups and attenuated by both drugs (Fig. 4C). Importantly, we find that during the 3rd week's feeding with HCD, the death number of larval zebrafish increased heavily, and the effects of both drugs in 3rd week's experiment were with a less efficiency than 2nd week's groups, the possible reason is because of the heavy degree of liver steatosis after three weeks' HCD feeding. Furthermore, in PIO group, we find that after three weeks' administration with PIO, larval zebrafish showed an increase death number compared with BZT groups which could be the side effect of PIO due to a long- time drug taken.
Considered the purpose is to build a fast screening model for NAFLD/NASH drugs, and the typical NAFLD feature with the starting progress of NASH showed on 2nd week HCD larval zebrafish model, moreover, to avoid the side effect of longtime drug taken, we further chose the 2nd week's HCD model to evaluate the drug screening effect of the models. From Fig 5B we can realize, the oxidant index of ROS and MDA decreased on the drugs groups compared with HCD, and SOD level increased in all three groups of HCD and both drugs, which indicated that the HCD didn't destroyed the SOD system of anti-oxidant. Interestingly, the lipid accumulation and ROS production in abdomen of larval zebrafish were reduced by both drugs (Fig. 5A), which further proved the hypothesis that overlord-lipid could induce the production of ROS, and the production of ROS were reduced by drugs with the lipid-lowering effect in the meantime. From the results of liver steatosis, we can easily see that the steatosis in both drug groups was reduced significantly (Fig. 5C). Furthermore, the different effect feature of BZT and PIO on anti-steatosis can be identified by HE stain (Fig. 5D). Interestingly, BZT take the anti-steatosis effect by turning the macrovesicular steatosis to microvesicular steatosis. However, the PIO reduced the occupation scale of the macrovesicular steatosis to reduce the steatosis in liver (Fig. 5D). Based on the evaluate results above, we believed that the HCD larval zebrafish models could be a reliable model to screen NAFLD/NASH drugs with multiple aspects.
Furthermore, due to the finding of the different phenomenon of two drugs effect on larval zebrafish, and the reason we believed is probably because of their different mechanism of lipid regulate, we decided to further reveal that whether our model can perform the mechanism research on drug screening. Due to the whole genome sequencing of zebrafish has been finished since 2000 [29], it becomes possible for researchers to perform a gene expression test on larval zebrafish models. We tested the mRNA expression on lipogenesis, lipid-lowering, inflammation, fibrosis, and oxidant stress. From the results we can see, two lipogenesis related gene expression were reduced by both drugs, and three lipid-lowering related gene increased in both drug groups, Importantly, the well-known PPARα agonist BZT increased the pparab expression on BZT group, and the well-known PPARγ agonist PIO increased the pparg expression on PIO group (Fig. 5E), the results could prove our model successfully reflected the right gene expression changes on mechanism-known drugs. Moreover, from inflammation, fibrosis, and oxidant stress-related mRNA expression results, we can see, the model successfully reflected the gene changes (Fig. 5F). Importantly, inflammation results further confirmed that our model is an inflammatory model and the significant increased inflammation can be reduced by screen-drugs showing in gene expression results. Interestingly, from the fibrosis results we can see, the mmp9 was increased significantly but the tgfb1 on HCD group (Fig. 5F), which indicated that our guess of the possible fibrosis feature we found in HE stain on 2nd weeks HCD larval zebrafish probably a receivable one. Keap1-Nrf2 is a well-known antioxidant pathway which performs the activation of antioxidant enzyme systems [30]. Although the regulator gene of antioxidant enzyme system nrf2 only showed a slight increase in HCD or in both drug groups, the ROS indicator gene keap1 were increased in HCD groups and reduced by both drugs significantly. This results further confirmed the activation of SOD we showed before (Fig. 2D, Fig 5B). Taken above, this model can perform the mechanism research and provide multiple aspects of gene expression information for drug screening.
Conclusion
In conclusion, we used a laboratory-made HCD successfully induced a NAFLD larval zebrafish model and demonstrated the comprehensive process of NAFLD from NAFL to NASH within short-time's feeding. Remarkably, a typical NASH feature with ballooning degeneration was first reported on larval zebrafish. Moreover, multiple indexes on multiple aspects of lipid metabolism, oxidant stress, hepatic steatosis, and hepatic inflammation can be easily tested for drug screening. Furthermore, this NAFLD larval zebrafish model can be used to perform the mechanism research by testing mRNA expression. In the end, larval zebrafish feeding with HCD for 2 weeks were the most recommended method we believed.
Abbreviations
NAFLD, Non-alcoholic fatty liver disease; NAFL, non-alcoholic fatty liver; NASH, non-alcoholic steatohepatitis; HCD, high cholesterol diet; PIO, pioglitazone; BZT, bezafibrate; ROS, Reactive oxygen species; SOD, Superoxide dismutase; TG, Triglyceride; TC, total cholesterol; DCFH-DA, 2',7'-dichlorofluorescin diacetate; MDA, Malondialdehyde.
Acknowledgements
This study was supported by the National Science Technology Major Project of China (No. 2018ZX09301030-005).
Competing Interests
The authors have declared that no competing interest exists.
References
1. Younossi Z, Anstee QM, Marietti M, Hardy T, Henry L, Eslam M. et al. Global burden of NAFLD and NASH: trends, predictions, risk factors and prevention. Nat Rev Gastroenterol Hepatol. 2018:11-20
2. Ibrahim SH, Hirsova P, Gores GJ. Non-alcoholic steatohepatitis pathogenesis: sublethal hepatocyte injury as a driver of liver inflammation. Gut. 2018;67:gutjnl-2017 -315691
3. Rotman Y, Sanyal AJ. Current and upcoming pharmacotherapy for non-alcoholic fatty liver disease. Gut. 2017;66:180
4. Willebrords J, Pereira IV, Maes M, Crespo YS, Colle I, Van DBB. et al. Strategies, models and biomarkers in experimental non-alcoholic fatty liver disease research. Progress in Lipid Research. 2015;59:106-25
5. Xu ZJ, Fan JG, Ding XD, Qiao L, Wang GL. Characterization of High-Fat, Diet-Induced, Non-alcoholic Steatohepatitis with Fibrosis in Rats. Digestive Diseases & Sciences. 2010;55:931-40
6. Gut P, Reischauer S, Dyr S, Arnaout R. LITTLE FISH, BIG DATA: ZEBRAFISH AS A MODEL FOR CARDIOVASCULAR AND METABOLIC DISEASE. Physiological Reviews. 2017;97:889-938
7. Passeri M, Cinaroglu AC, Sadler K. Hepatic steatosis in response to acute alcohol exposure in zebrafish requires sterol regulatory element binding protein activation. Hepatology. 2009;49:443-52
8. Ma J, Li M, Kalavagunta PK, Li J, He Q, Zhang Y. et al. Protective effects of cichoric acid on H2O2-induced oxidative injury in hepatocytes and larval zebrafish models. Biomedicine & Pharmacotherapy. 2018;104:679-85
9. Asaoka Y, Terai S, Sakaida I, Nishina H. The expanding role of fish models in understanding non-alcoholic fatty liver disease. Disease Models & Mechanisms. 2013;6:905-14
10. Dai W, Wang K, Zheng X, Chen X, Zhang W, Zhang Y. et al. High fat plus high cholesterol diet lead to hepatic steatosis in zebrafish larvae: a novel model for screening anti-hepatic steatosis drugs. Nutrition & Metabolism. 2015;12:1-11
11. Landgraf K, Schuster S, Meusel A, Garten A, Riemer T, Schleinitz D. et al. Short-term overfeeding of zebrafish with normal or high-fat diet as a model for the development of metabolically healthy versus unhealthy obesity. Bmc Physiology. 2017;17:4
12. Sozen E, Ozer NK. Impact of high cholesterol and endoplasmic reticulum stress on metabolic diseases: An updated mini-review. Redox Biology. 2017;12:456-61
13. Farrell GC, Van RD. Liver cholesterol: is it playing possum in NASH?. American Journal of Physiology Gastrointestinal & Liver Physiology. 2012;303:G9
14. Progatzky F, Sangha NJ, Yoshida N, Mcbrien M, Cheung J, Shia A. et al. Dietary cholesterol directly induces acute inflammasome-dependent intestinal inflammation. Nature Communications. 2014;5:5864
15. David RM, Jones HS, Panter GH, Winter MJ, Hutchinson TH, Kevin CJ. Interference with xenobiotic metabolic activity by the commonly used vehicle solvents dimethylsulfoxide and methanol in zebrafish (Danio rerio) larvae but notDaphnia magna. Chemosphere. 2012;88:912-7
16. Baek JS, Fang L, Li AC, Miller YI. Ezetimibe and Simvastatin Reduce Cholesterol Levels in Zebrafish Larvae Fed a High-Cholesterol Diet. Cholesterol. 2012;2012:564705
17. Soliman SS, El-Bakry HA, Ismail IA. Melatonin Ameliorates High-Fat Diet-Induced Liver Steatosis through Modulating Antioxidant and Apoptotic Signals. International Journal of Pharmacy & Biological Sciences. 2017:7
18. Effendi K, Harada K, Hashimoto E, Kage M, Koike K, Kondo F. et al. Pathological Findings of NASH and NAFLD. Hepatology Research. 2017:47
19. Arab JP, Arrese M, Trauner M. Recent Insights into the Pathogenesis of Nonalcoholic Fatty Liver Disease. Annu Rev Pathol. 2018;13:321-50
20. Franko A, Neschen S, Rozman J, Rathkolb B, Aichler M, Feuchtinger A. et al. Bezafibrate ameliorates diabetes via reduced steatosis and improved hepatic insulin sensitivity in diabetic TallyHo mice. Molecular Metabolism. 2017;6:256-66
21. Sumida Y, Seko Y, Yoneda M. Novel antidiabetic medications for nonalcoholic fatty liver disease with type 2 diabetes: Antidiabetic drugs for NAFLD with T2DM. Hepatology Research. 2016;47:266-80
22. Mills EP, Brown KPD, Smith JD, Vang PW, Trotta K. Treating nonalcoholic fatty liver disease in patients with type 2 diabetes mellitus: a review of efficacy and safety. Therapeutic Advances in Endocrinology & Metabolism. 2018;9:15
23. Bagatto B, Pelster B, Burggren WW. Growth and metabolism of larval zebrafish: effects of swim training. Journal of Experimental Biology. 2001;204:4335
24. Kobyliak N, Virchenko O, Falalyeyeva T, Kondro M, Beregova T, Bodnar P. et al. Cerium dioxide nanoparticles possess anti-inflammatory properties in the conditions of the obesity-associated NAFLD in rats. Biomedicine & pharmacotherapy = Biomedecine & pharmacotherapie. 2017;90:608
25. P G, EP M, SD F. Nile red: a selective fluorescent stain for intracellular lipid droplets. The Journal of Cell Biology. 1985;100:965-73
26. Koek GH, Liedorp PR, Bast A. The role of oxidative stress in non-alcoholic steatohepatitis. Clinica Chimica Acta. 2011;412:1297-305
27. Rolo AP, Teodoro JS, Palmeira CM. Role of oxidative stress in the pathogenesis of nonalcoholic steatohepatitis. Free Radic Biol Med. 2012;52:59-69
28. Sumida Naito, Yoshikawa Niki. Special issue on "Oxidative stress and redox signaling in the;gastrointestinal tract and related organs" for Free Radical Research;Involvement of free radicals and oxidative stress in NAFLD/NASH. Free Radical Research. 2013;47:869-80
29. Sprague J, Doerry E, Douglas S, Westerfield M. The Zebrafish Information Network (ZFIN): a resource for genetic, genomic and developmental research. Nucleic Acids Research. 2001;29:87-90
30. Kumar A, Jha S, Pattanayak SP. Daphnetin ameliorates 7,12-dimethylbenz[a] anthracene-induced mammary carcinogenesis through Nrf-2-Keap1 and NF-κB pathways. Biomedicine & Pharmacotherapy. 2016;82:439-48
Author contact
![]() Corresponding authors: Jing Shang. (shangjing21cnedu.cn) and Tao Wang. (wangtao1331edu.cn)
Corresponding authors: Jing Shang. (shangjing21cnedu.cn) and Tao Wang. (wangtao1331edu.cn)
Received 2018-9-17
Accepted 2019-2-20
Published 2019-3-10