ISSN: 1449-2288International Journal of Biological Sciences

Int J Biol Sci 2019; 15(7):1396-1403. doi:10.7150/ijbs.33412 This issue Cite
Research Paper
A Mathematical Modelling of Initiation of Dendritic Cells-Induced T Cell Immune Response
Wen-zhu Huang1,3*, Wen-hui Hu1,3*, Yun Wang1,2,3, Jin Chen1,3, Zu-quan Hu1,3, Jing Zhou1,3, Lina Liu1,3, Wei Qiu1,3, Fu-zhou Tang1,3, Shi-chao Zhang1,3, Yan Ouyang1,3, Yuan-nong Ye1,2,3, Guo-qiang Xu2, Jin-hua Long4 ![]() , Zhu Zeng1,2,3,5
, Zhu Zeng1,2,3,5 ![]()
1. Department of Biotechnology, School of Biology and Engineering, Guizhou Medical University, Guiyang, 550004, P.R. China
2. Department of Immunology, School of Basic Medical Science, Guizhou Medical University, Guiyang, 550004, P.R. China
3. Immune Cells and Antibody Engineering Research Center of Guizhou Province/Key Laboratory of Biology and Medical Engineering, Guizhou Medical University, Guiyang, 550004, P.R. China
4. Department of Head & Neck, Affiliated Tumor Hospital, Guizhou Medical University, Guiyang, 550004, P.R. China
5. Key Laboratory of Environmental Pollution Monitoring and Disease Control, Ministry of Education, Guizhou Medical University, Guiyang, 550025, P.R. China
* These authors are equal contributors
Abstract

Dendritic cells (DCs) are the most potent specialized antigen-presenting cells as now known, which play a crucial role in initiating and amplifying both the innate and adaptive immune responses. Immunologically, the motilities and T cell activation capabilities of DCs are closely related to the resulting immune responses. However, due to the complexity of the immune system, the dynamic changes in the number of cells during the peripheral tissue (e.g. skin and mucosa) immune response induced by DCs are still poorly understood. Therefore, this study simulated dynamic number changes of DCs and T cells in this process by constructing several ordinary differential equations and setting the initial conditions of the functions and parameters. The results showed that these equations could simulate dynamic numerical changes of DCs and T cells in peripheral tissue and lymph node, which was in accordance with the physiological conditions such as the duration of immune response, the proliferation rates and the motilities of DCs and T cells. This model provided a theoretical reference for studying the immunologic functions of DCs and practical guidance for the clinical DCs-based therapy against immune-related diseases.
Keywords: dendritic cell, immune response, T cells, mathematical model, ordinary differential equations
Introduction
DCs are specialized antigen presenting cells, which have strong capabilities of antigen uptake and processing, can present antigens to naive T cells, and thus induce immune responses or tolerance. Functionally, DCs can be divided into immature DCs (imDCs) and mature DCs (mDCs) two differentiation stages. In the body, imDCs are located in peripheral tissues, whose main function is to uptake antigens through phagocytosis and pinocytosis [1-4]. After obtaining the antigens, the imDCs gradually differentiate into mDCs and up-regulate the expression levels of cluster of differentiation (CD) molecules, including CD11c, CD40, CD80, CD86, CD83, major histocompatibility complex (MHC) and chemokine receptor 7 (CCR7), et al. Then, they migrate to secondary lymphoid tissues along the concentration gradient of CCL19 and CCL21 secreted by lymphatic endothelial cells. In the lymph nodes (LN), mDCs are dynamically in physical interaction with the naive T cells. The acquired antigens are presented to them by MHC I or II molecules on the surface of the cell membrane, stimulating the naïve T cell specific proliferation, thereby triggering adaptive immune responses or tolerance [2, 3].
The peripheral tissues (PT) including skin and mucosa not only serve as a mechanical barrier between the body and the external environment, but also the body's primary immune defense against potential external antigens [5, 6]. In skin tissue, there is a close signaling transduction among epithelial cells, immune cells, and stroma to ensure effective protection against external antigens and to maintain the homeostasis of the body's immune system [7, 8]. When infections or lesions occur in PT, DCs rapidly differentiate and perform their immunological functions [9, 10]. Naive T cells within the LN are activated and proliferated by recognizing antigens presented by DCs. These DCs-induced antigen specific T cells emigrate from the LN to the diseased PT to eliminate antigens and maintain inflammation. Normally, the inflammation will gradually subside once the antigens are eliminated. In the healthy body (non-inflammatory state), there are still small mount DCs that migrate from the PT to LN in order to help the immune system maintain immune tolerance to autoantigens [3, 11].
The schematic of DCs-induced inflammatory process. First, DCs migrate from PT to the inflammation site due to antigen stimulation. Secondly, antigen-loaded DCs migrate from inflammation site to the LN. Thirdly, the process of initial activation and specific proliferation of naive T cells in the LN. Fourthly, the antigen specific effector T cells migrate to inflammatory PT and eliminate antigens.
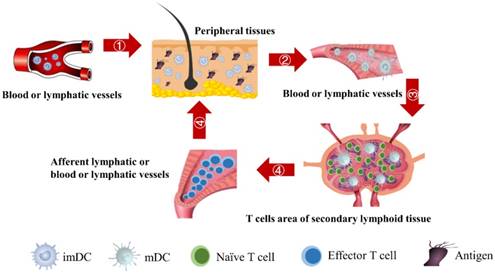
In the initiation phase of the immune response, the abilities of DCs to migrate and stimulate the naive T cell-specific proliferation play an important role in effective immune function. Moreover, the number of DCs that migrate to the LN after antigen acquirement at the site of the inflammatory PT and the subsequent number changes of effector T cells activated by DCs are closely related to the efficiency of the immune function in vivo. However, due to the complexity of the immune system, there are few studies on the real-time monitoring of changes in the number of DCs and T cells during the initiation of inflammation. The initiation process of immune response caused by inflammation in the PT can be summarized four stages, as shown in Fig.1. Therefore, in order to more accurately investigate the number changes of DCs and effector T cells over time at the onset of inflammation, the present study simplified the migration of DCs and subsequent T cell-specific proliferation into several ordinary differential equations. By setting the relationship between parameters and functions, the number changes of DCs and T cells at different stages is reduced to a time-dependent equation to simulate these processes.
Methods
The initiation of a primary immune response requires contact between DCs and naive T cells. First of all, the inflammatory site of PT is stimulated by antigens, and DCs moves through the blood vessels or lymphatic vessels to the inflammatory site. Secondly, DCs loaded antigens in the PT inflammatory region migrate to LN and interact with T cells. Subsequently, T cells are activated, proliferated and migrated to the inflammatory site to remove antigens [4, 6]. In this study, ordinary differential equation model was constructed to simulate the populations of DCs in PT and LN. In addition, changes in the number of effector T cells including CD4+ T cells and CD8+ T cells were given a prediction. The initial values of the functions and parameters involved in the model in terms of the related references are given in Table 1.
In this model, the DCs that mature at the initial PT site of the antigen stimulation were set to trace amounts. As the antigen concentration was increased to a threshold level (usually without definite limitations), it is sufficient to induce DCs to mature and leave the PT. On account of limited antigen-activated DCs that activate and migrate to LN-activated lymphocytes, and because of the different ability of the antigen to replicate under diverse conditions, we selected a limited number of antigens available in this mathematical model. It is important to point out that this model is more complicated in chronic inflammatory conditions and more than just one LN in the actual study. In short, we only focused on the dynamic model of one LN in the present study. The model was initially established on the PT of DCs as the first step in developing this chronic inflammatory model. The model was only concerned with some simple factors, such as DCs antigen presentation, activation, migration, and the ability to stimulate the naive T cells.
The initial value of variables and parameters
| Variables/Parameters | Units | Initial Value |
|---|---|---|
| DPT | DCs/mg PT | 0 |
| DLN | DCs/mg LN | 0 |
| T | Primed T cells/mg LN | 1 |
| A | Ng of antigen/mg of tissue | 0 |
| tthresh | h | 4 |
| Athresh | Ng of antigen/mg tissue | 4 |
| DLNcrit | DCs/mg LN | 1x10² |
| DLNmax | DCs/mg LN | 2x10⁴ |
 | DCs/mg of PT/h | 2≤ ≤125 ≤125 |
| D*PT | DCs/mg PT | tthresh  |
| ρ | none | 0 |
| δ | 1/h | 1/72 |
| α (DLN, t) | 1/ (h T cells/mg LN) | 0 |
| m | T cells/DC | 10 |
| αmax | 1/ (h T cells/mg LN) | 0.1 |
| K0 | 1/h | 2.08×10⁻⁷ |
| K1 | 1/h | 2.08×10⁻⁵ |
The assumptions of the model
- The concentration of DCs in the blood was almost constant during the immune response of the model simulated PT inflammation.
- Linear accumulation of antigen on the surface of the PT until it reached its maximum.
- Without sufficient antigen stimulation, mature DCs migrated to LN was expected to be very small. When antigen concentration reached a certain amount, DCs migrated from peripheral blood to inflammatory sites and then emigrated from inflammatory sites to LN.
- DCs did not proliferate in the PT [12, 13].
- About 1% of the mature DCs loaded with antigen were able to leave the PT and went to the LN [3, 14-16], suggesting that DCs might be considerably lost during migration. In this study, we only focused on DCs that migrating from PT to LN and successfully activating immune response of T cells. So, it was hypothesized that DCs could reach the LN and activates T cells.
- It was assumed that when the concentration of DCs in the LN A reached a certain threshold Athresh, T cells began to proliferate conforming to a logistic model. The activity of DCs began with the stimulation of the antigen in the PT. In this process, we assumed that the antigen concentration increased from the beginning of the stimulus to the critical value Athresh. The time of arrival of this threshold was indicated as tthresh. For simplicity, it was assumed that the increase rate of the antigen per hour was 1 ng/mg of tissue until it reached to Athresh. A minute amount of DCs continued to migrate from the blood to the PT before the critical value was reached. This continuous inflow was indicated by
 . Once the value of the antigen in the PT reached to Athresh, DCs began to migrate from the blood to the PT at a high concentration. It was also supposed that this change occurred within a fairly short period of time, while
  was approximated as a discrete jump from a non - inflammatory to an inflammatory state in a short period of time.
Mathematical model
With the increase of the number of DCs in the PT, the migration rate of DCs from the PT to the LN was expressed by parameter  Therefore; the rate of change of DCs in the PT (e.g. skin) could be described by the following equation:
(1)
It is assumed that DCs reached the LN were only from the PT. In the model, the rate of DCs leaving the PT was the same as K at the rate of reaching the LN. The DCs in the LN were reduced by δ per hour. The DCs migrating from the PT to the LN had a loss rate represented by  per hour mortality. This DCs migration loss rate parameter we set is based on existing research observations. For example, under pathological conditions (such as tumors), the number of DCs does have a loss during the initiation of the immune response. For ease of calculation, we assume that the migration loss rate of DCs is a linear function. In this study we did not consider the loss of DCs during migration, so we set
  =0. The nonlinear expression, threshold range and influencing factors of the parameter
  are our next research content. The change rate of DCs in the LN could be expressed as the following differential equation:
(2)
The parameter m that represents the carrying capacity of DCs is quite wide. In this study, we selected m value of 10, that is, each DC could stimulate 10 T cells to activate and proliferate [17-20]. It was noted that the change rate of T cell proliferation  was a function of DCs concentration
  and time t. As noted in the assumption 6, T cell population grew logistically with a growth rate
  /mg/h to a carrying capacity m times the size of the maximum number of DCs in the LN. The time of arrival of DLNcrit was expressed as tcrit, which was linearly increased at the rate of α until the maximum value of αmax. The equation describing the change of T cells is as follows:
(3)
Model parameters and significance
In order to determine the parameter K, it was first identified as 0<t<tthresh. At this point, K=K0. Since the critical activation value was reached at the antigen level, only a few DCs loaded antigen migrated to the LN. If t>tthresh, the migration rate can enhance about three times, when the DCs in PT increase approximately two times [4, 21, 22], so we set  . K1 indicates the average rate of the activation of DCs from the PT to the LN. DS* indicates the number of DCs that reached the PT at the time of tthresh. According to our experiment, the change of
  was consistent with the change of
  . The rate of DCs reaching noninflammatory PT tissue was 2 DCs/mg of PT/h, and the rate of DCs reaching inflammatory PT was 100 DCs/mg of PT/h [22-24]. Therefore, in the case of noninflammatory,
 . The prerequisite for the establishment of the above equations is that there was sufficient space in the LN to allow new DCs entry, namely,
 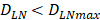 . Once the number of DCs in the LN reached a critical value of DLNmax, DCs entered the LN from the PT at a constant rate. Thereafter, the number of DCs in LN remained homeostasis.
(4)
The proliferation rate of T cells α was a function of time t and DLN the number of T cells in the LN, and T cells proliferate only when DCs increased to the threshold value. T cells then showed a linear increase until the proliferation rate reached to their maximum value. In this study, the time of the linear proliferation tα was 72 hours [25-30].
(5)
The initial value of variables and parameters
 , indicates that the number of DCs at the PT tissue at the initial time is zero, that is, we set the PT to has no DCs before antigen stimulation or the number is negligible.
 , indicates that the number of activated DCs on the LN at the initial time was zero, that is, there was no activated DCs or LN before antigen stimulation.
 , there were no activated T cells in the LN prior to antigen stimulation, and a non-zero initial value was needed for later growth in numbers.
 , indicates that one DC could activate 10 T cells after the number of DCs in the LN exceeded the critical value [13, 17, 19], so the maximum carrying capacity of DCs in a single LN is
 .
. , indicates the time when the antigen concentration reached the threshold
 . Other studies have shown that it takes 2 to 4 hours for DCs to process antigens at the inflammation after antigen stimulation [25-30], so we set
  to 4 hours.
 , we hypothesized the rate of increased antigen level was1 ng/mg of tissue/h, which was an estimated value, and the rate changed in different organ. In this model, we estimated that
  was about 4 ng/mg of tissue/h. When reached this threshold, DCs could be stimulated to uptake antigen and then migrated from blood to the PT and then to LN. Once the concentration of DCs reached
  (cells/mg of LN), T cells could be activated.
 , indicates that about 100 DCs in each LN could cause T cell immune response (LN around 10mg) [25-30]. In this model, we hypothesized that the number of DCs firstly reached
  for
for  .
.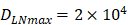 , indicates that the upper limit of the number of DCs per milligram of LN tissue was about 2×10⁴ [25-30].
- Under noninflammatory conditions,
 under the inflammatory state,
  .
.  was the rate at which DCs migrated from the blood to 1 mg of PT inflammation per hour, with the upper limit being the rate at which DCs entered the inflammatory tissue upon arrival of the antigen cutoff, and the lower limit was the rate at which DCs entered the inflamed tissue before the antigen threshold arrived [25-30].
 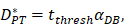 represents the number of activated T cells on the LN when the time of the accumulation of antigen concentration reached the critical time
  .
. , mortality of DCs in the LN [12, 26, 27].
 , indicates the maximum proliferation rate of T cells in the LN. The selection of
  was an estimated value, which made the proliferation rate of T cells within a reasonable biological range.
 indicates the rate of migration of mDCs from the PT to the LN when the antigen concentration increased to the critical value. Studies have shown that when 1x10⁵ DCs were injected into the skin, the migration rate of DCs after 48h was 0.01 [7, 20, 27], and the average migration rate was about 2.08×10⁻⁵/h. Therefore, we predicted that the antigen concentration did not reach the critical level in the initial stage of inflammation, and the migration rate of DCs from the PT to the LN was lower, so that K0=2.08×10⁻⁷/h.
Results
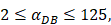
We investigated the effect of the parameter  on the outcome of the model in an inflamed state. It was assumed that
  may range from around 100 up to 6250 under the inflammatory state. As shown in Fig.2, the growth rate of concentration of DCs in the PT decreased accompany with time changes, and the value of DPT increased rapidly within 25 hours, and then increased at a very slow rate. As the value of
  increasing, the value of DPT was also increased. The value of DPT was always greater than that of DCs in the LN concentration DLN, on account of the model assumption that the DCs in the LN originated from the PT. As the value of
  increasing, the time required for the concentration of DCs in the PT and LN to reach the maximum value was shorter (Fig. 3). When
  was 6250, about 50 hours were required for DLN reaching the maximum, while approximately 175 hours were need for T cells reaching the maximum value. When the value of
  was 100, more than 250 hours were required for both DLN and T cells reaching the maximum value. The time for T cells reaching the maximum was always lagged behind DLN. The greater value of the
  , the shorter time required for the specific proliferation of T cells and the higher efficiency of the immune response.
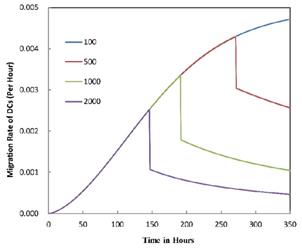
The numerical results in Fig. 4 showed that the value of  affected the time required for the K value to reach the peak value. When
  =1000 and 2000, the value of K increased and then decreased. When
  was set to 100 or 500, the value of K didn't reach the peak value during the simulation time. When
  =6250, the time required for reaching the peak value of DCs migration rate K was less than 100 hours (Table 2). We also discovered that the time cost for migration rate K reaching its peak is a power function of
  . It also could found in Table 3, when
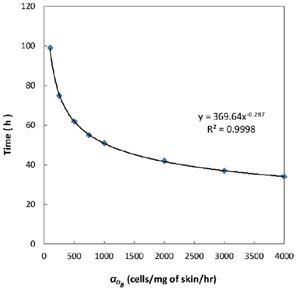
  was 6250, it cost about 22 hours for T cell response to proliferate. When
  was set to 100, the time was up to 68 hours for T cells started to proliferate. As showed in Fig. 5, there was a power function relationship between the time cause T cells to proliferate and the parameter
  .
.
Numerical simulation of DCs in PT (DPT) and DCs in LN (DLN) and T cells in LN. A.  , B.
, B. , C.
, C. , D.
, D. .
.
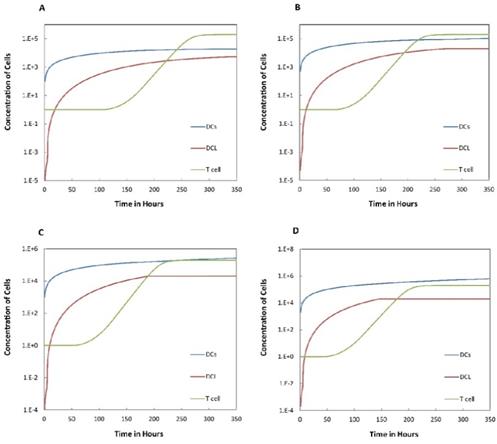
Trend curves of DC concentrations in PT and LN ( =100, 500, 1000, 2000). E. DC concentrations in PT, F. DC concentration in LN.
Trend curves of migration rate of DCs from PT to LN ( =100, 500,1000, 2000, 6250)
Numerical simulation of the times required for T cells to initiate proliferation.
Discussion
DCs, as the most potent specific antigen presenting cell in the body, plays a vital role in the initiation and regulation of immune response. When inflammation occurs, imDCs migrate from the peripheral blood to the inflammatory site and acquire antigens, then gradually differentiate into mDCs and migrate to the LN to stimulate naive T cells to proliferate [1-4]. In this process, DCs undergo a long migration until reaching LN. Moreover, DCs-based vaccinations against tumors and autoimmune diseases have been achieved great clinical success. Anti-tumor immunotherapy based on DCs is even considered to be one of the possible methods to overcome cancer. However, the clinical efficacy of these therapies is unsatisfactory. Presently, there are still many problems to be solved, in which the relationship between the number of DCs that are adoptively reinfused and the number of naive T cell proliferation is difficult to predict. This requires further studying the immunological function of DCs from a multidisciplinary perspective, especially system biology.
The time requirement for reaching the peak value of DCs migration rate K corresponding to different values of αDB.
| αDB | 100 | 500 | 1000 | 2000 | 6250 |
|---|---|---|---|---|---|
| Migration rate K to peak time (h) | Not observed during numerical simulation | Not observed during numerical simulation | 191 | 146 | 99 |
The time of T cell activation in LN corresponding to different value of αDB.
| αDB | 100 | 500 | 1000 | 2000 | 6250 |
|---|---|---|---|---|---|
| T cell proliferation time (h) | 99 | 62 | 51 | 42 | 22 |
In the present study, by constructing ordinary differential equations, we simulate the dynamic changes of DCs during the entire migration process and the subsequent dynamic relationship between the number and time of T cells in LN. When the antigen concentration is low, DCs migrate from the blood to the PT in a low level. When the antigens concentration reaches the critical value Athresh, DCs migrate from the blood to the PT inflammation site at high concentration. In the first 25 hours, the value of DPT increased with the fastest speed, which showed that DCs accumulated firstly in the inflammatory PT and then migrated to the LN. Therefore, the value of DPT was always greater than the concentration of DCs in the LN DLN. when the value of DPT was above 6000, T cells require at least 22 hours to be activated as effector T cells. If the value of DPT was less than 500, T cells were activated after at least 50 hours. Since the delay in T cell proliferation is mainly due to the fact that DCs contact T cells and stimulate T cells for at least 24 hours [10], the time delay of specific proliferation of T lymphocytes in LN stimulated by DCs is in line with the reality of T cell proliferation characteristics. Moreover, the value of  has a power function correlation with the time of DCs initiation effect and T cell proliferation, inferring that it can predict the time required for activation of T cells through
  value, and the efficiency of the immune response.
The mathematical model constructed by Amy H. Lin Erickson et al. [23] is not accurate for the initial value of the PT-to-LN migration rate parameter K for DCs, resulting in the number of DCs migrating to the LN does not achieve a critical value. According to the relevant research [25-30], DCs could induce the proliferation of naive T cells only the number of DCs reaches that critical value. In their study also constructed a T cells change rate equation in LN. In our manuscript the model of T cell proliferation in equation (3) is optimized, which could better characterize the number of T cells in logistic growth and that was more realistic. More importantly, our study confirmed from the model point of view that the time required for T cells to initiate immune proliferation in the early stage of immunization could be inferred from the concentration of DCs in the blood. Bocharov G, et al. also modelled the localized population dynamics of DCs-cytotoxic T lymphocyte (CTL) interaction in the spleen, but they ignored the DCs recirculation between the spleen and blood. Our model considered more about the migration of DCs in blood and LN during the early stage of chronic inflammation [31]. Therefore, the model constructed in this study was more in line with the physiological behavior of DCs and the number of T cells during the inflammation initiation, which can predict the number of DCs and T cells at different time, as well as provides a theoretical reference for studying the immunological function of DCs.
Conclusion
The present model can simulate the migration of DCs and the specific proliferation of naïve T cells in DCs-induced immune response, which accords with experimentally confirmed time needed for the migration and proliferation of DCs and T cell activation. This study laid the foundation for the construction of a mathematical model to simulate the physiological behavior of DCs under pathological conditions (such as tumor and rheumatoid). In DCs-based immunotherapy against diseases, the effects of the number of DCs injected and the migration rate of DCs on the initiation time of immune response induced by DCs have not been well quantified. The significance of this study is to predict the time of immune response induced by DCs according to the migration rate of DC in peripheral tissues, so as to guide clinical immunotherapy. Since the model is only a preliminary mathematical model, many immune processes are simplified, In future; we will continue to build more complex models based on this preliminary model to provide validation, prediction and hypothesis testing for clinical problems. We will collect clinical data from the perspective of pathophysiology to apply this mathematical model to the prediction of clinical efficacy of diseases such as tumors and autoimmune diseases.
Acknowledgements
This research was funded by grants from the National Natural Science Foundation of China (31771014, 11762006, 31660258, 31860262, 61803112, 31660320), the 2011 Collaborative Innovation Program of Guizhou Province (2015-04), the Key project of Science and Technology Foundation of Guizhou Province (2018-1412), the Science and Technology Innovative Talent Team of Guizhou Province (2015- 4021), the Science and Technology Foundation of Guizhou Province ((LH-2015-7379, LH-2016-7375, LH- 2016-7357, LH-2015-7326, LH-2017-5718), the Technology Foundation for Selected Overseas Chinese of Guizhou Province (2013-8), the Bureau of Science and Technology of Guiyang (20151001-19, 20161001-12), Ph.D. Research Startup Foundation of Guizhou Medical University (2014-022, 2014-021).
Author Contributions
Zhu Zeng, Jinhua Long, Wenzhu Huang and Wenhui Hu conceived and designed the experiments; Wenzhu Huang and Wenhui Hu, Jin Chen, Yun Wang, Zuquan Hu, Jing Zhou, Lina Liu, Fuzhou Tang, Shichao Zhang, Yan Ouyang, JinHua Long, Yun Wang, Yi Jia, Wei Qiu and Yuannong Ye performed the experiments and analyzed the data; Zhu Zeng, Jinhua Long, Wenzhu Huang and Wenhui Hu wrote the paper.
Competing Interests
The authors have declared that no competing interest exists.
References
1. Steinman RM, Banchereau J. Taking dendritic cells into medicine. Nature. 2007;449:419-26
2. Steinman RM. Decisions about dendritic cells: past, present, and future. Annual review of immunology. 2012;30:1-22
3. Steinman RM. Dendritic cells in vivo: a key target for a new vaccine science. Immunity. 2008;29:319-24
4. Permanyer M, Bosnjak B, Forster R. Dendritic cells, T cells and lymphatics: dialogues in migration and beyond. Current opinion in immunology. 2018;53:173-9
5. Nestle FO, Di Meglio P, Qin JZ, Nickoloff BJ. Skin immune sentinels in health and disease. Nature reviews Immunology. 2009;9:679-91
6. Di Meglio P, Perera GK, Nestle FO. The multitasking organ: recent insights into skin immune function. Immunity. 2011;35:857-69
7. Belkaid Y, Tamoutounour S. The influence of skin microorganisms on cutaneous immunity. Nature reviews Immunology. 2016;16:353-66
8. Zeng Z, Xu X, Chen D. Dendritic Cells: Biophysics, Tumor Microenvironment and Chinese Traditional Medicine. Netherlands: Springer. 2015
9. Hu ZQ, Xue H, Long JH, Wang Y, Jia Y, Qiu W. et al. Biophysical Properties and Motility of Human Mature Dendritic Cells Deteriorated by Vascular Endothelial Growth Factor through Cytoskeleton Remodeling. International journal of molecular sciences. 2016;17:1756-72
10. Pasparakis M, Haase I, Nestle FO. Mechanisms regulating skin immunity and inflammation. Nature reviews Immunology. 2014;14:289-301
11. Kamath AT, Henri S, Battye F, Tough DF, Shortman K. Developmental kinetics and lifespan of dendritic cells in mouse lymphoid organs. Blood. 2002;100:1734-41
12. Vishwanath M, Nishibu A, Saeland S, Ward BR, Mizumoto N, Ploegh HL. et al. Development of intravital intermittent confocal imaging system for studying Langerhans cell turnover. The Journal of investigative dermatology. 2006;126:2452-7
13. Celli S, Day M, Muller AJ, Molina-Paris C, Lythe G, Bousso P. How many dendritic cells are required to initiate a T-cell response?. Blood. 2012;120:3945-8
14. van Panhuys N. Studying Dendritic Cell-T Cell Interactions Under In vivo Conditions. Methods in molecular biology (Clifton, NJ). 2017;1584:569-83
15. Krzastek SC, Goliadze E, Zhou S, Petrossian A, Youniss F, Sundaresan G. et al. Dendritic cell trafficking in tumor-bearing mice. Cancer Immunology, Immunotherapy. 2018;67:1939-47
16. Hommel M, Kyewski B. Dynamic changes during the immune response in T cell-antigen-presenting cell clusters isolated from lymph nodes. The Journal of experimental medicine. 2003;197:269-80
17. Abdallah F, Mijouin L, Pichon C. Skin Immune Landscape: Inside and Outside the Organism. Mediators of inflammation. 2017;2017:1-17
18. Stoll S, Delon J, Brotz TM, Germain RN. Dynamic imaging of T cell-dendritic cell interactions in lymph nodes. Science (New York, NY). 2002;296:1873-6
19. Stein JV, F Gonzalez S. Dynamic intravital imaging of cell-cell interactions in the lymph node. J Allergy Clin Immunol. 2017;139:12-20
20. Hugues S. Dynamics of dendritic cell-T cell interactions: a role in T cell outcome. Seminars in immunopathology. 2010;32:227-38
21. MartIn-Fontecha A, Sebastiani S, Hopken UE, Uguccioni M, Lipp M, Lanzavecchia A. et al. Regulation of dendritic cell migration to the draining lymph node: impact on T lymphocyte traffic and priming. The Journal of experimental medicine. 2003;198:615-21
22. Hu Z, Lancaster JN, Ehrlich LIR, Müller P. Detecting T Cell Activation Using a Varying Dimension Bayesian Model. J Appl Stat. 2018;45:697-713
23. Erickson A, Wise A, Fleming S, Baird M, Lateef Z, Molinaro A. et al. A preliminary mathematical model of skin dendritic cell trafficking and induction of T cell immunity. Discrete and Continuous Dynamical Systems - Series B. 2009;12:323-36
24. Brown LV, Gaffney EA, Wagg J, Coles MC. An in silico model of cytotoxic T-lymphocyte activation in the lymph node following short peptide vaccination. J R Soc Interface. 2018:15
25. Mempel TR, Henrickson SE, Von Andrian UH. T-cell priming by dendritic cells in lymph nodes occurs in three distinct phases. Nature. 2004;427:154-9
26. Bousso P. T-cell activation by dendritic cells in the lymph node: lessons from the movies. Nature reviews Immunology. 2008;8:675-84
27. Celli S, Garcia Z, Beuneu H, Bousso P. Decoding the dynamics of T cell-dendritic cell interactions in vivo. Immunological reviews. 2008;221:182-7
28. Benson RA, Brewer JM, Garside P. Visualizing and Tracking T Cell Motility In vivo. In: (ed.) Rainger GE, McGettrick HM. T-Cell Trafficking: Methods and Protocols. New York, NY: Springer New York. 2017 P:27-41
29. Miller MJ, Safrina O, Parker I, Cahalan MD. Imaging the single cell dynamics of CD4+ T cell activation by dendritic cells in lymph nodes. The Journal of experimental medicine. 2004;200:847-56
30. Benvenuti F, Hugues S, Walmsley M, Ruf S, Fetler L, Popoff M. et al. Requirement of Rac1 and Rac2 expression by mature dendritic cells for T cell priming. Science (New York, NY). 2004;305:1150-3
31. Bocharov G, Ford NJ, Ludewig B. A mathematical approach for optimizing dendritic cell-based immunotherapy. Methods in molecular medicine. 2005;109:19-34
Author contact
![]() Corresponding authors: : Zhu Zeng, School of Biology and Engineering / School of Basic Medical Science, Guizhou Medical University, University City, Guian New District, 550025, Guizhou Province, China. Tel.: +86-851-8817-4045, E-mail: zengzhuedu.cn; or Jinhua Long, Department of Head & Neck, Affiliated Tumor Hospital, Guizhou Medical University, No.1 Beijingxi Road, Yunyan District, Guiyang, 550004, P.R. China. Tel.: +86-851-8651-2802, E-mail: longjinhua100cn.
Corresponding authors: : Zhu Zeng, School of Biology and Engineering / School of Basic Medical Science, Guizhou Medical University, University City, Guian New District, 550025, Guizhou Province, China. Tel.: +86-851-8817-4045, E-mail: zengzhuedu.cn; or Jinhua Long, Department of Head & Neck, Affiliated Tumor Hospital, Guizhou Medical University, No.1 Beijingxi Road, Yunyan District, Guiyang, 550004, P.R. China. Tel.: +86-851-8651-2802, E-mail: longjinhua100cn.
Received 2019-1-22
Accepted 2019-3-19
Published 2019-5-20