ISSN: 1449-2288International Journal of Biological Sciences
- Current issue
- Volume 20; 2024
- Volume 19; 2023
- Volume 18; 2022
- Volume 17; 2021
- Volume 16; 2020
- Archive
- Advance articles
- Cover images
- Index & coverage
- Cover suggestion
- Special issues
1. Introduction
2. Materials and Methods
3. Results
4. Discussion
Supplementary Material
Acknowledgements
References

Int J Biol Sci 2019; 15(7):1460-1471. doi:10.7150/ijbs.33529 This issue Cite
Research Paper
The CtBP1-HDAC1/2-IRF1 transcriptional complex represses the expression of the long noncoding RNA GAS5 in human osteosarcoma cells
Xinliang Zhang1,#, Kaili Du2,#, Zhenkai Lou2, Keyuan Ding1, Fan Zhang2, Jinwen Zhu1, ![]() , Zhen Chang1,
, Zhen Chang1, ![]()
1. Department of Spine Surgery, Honghui Hospital, Xi'an Jiaotong University. NO.76 Nanguo Rd, Xi'an City, 710054, Shanxi, China.
2. Department of Orthopedics, the First Affiliated Hospital of Kunming Medical University, Kunming, Yunnan 650032, China.
# These authors contribute equally to this research.
Abstract

Growth Arrest Specific 5 (GAS5), a long noncoding RNA (lncRNA), functions as a tumor suppressor in multiple cancers. However, its function, downstream targets and upstream regulatory mechanism are still obscure in osteosarcoma cells. Here, we discovered that GAS5 was downregulated in cancerous osteosarcoma tissues and cells. Using a microarray analysis, we identified that GAS5 can regulate the expression of TP53, Bax, Bim, DDB2, TGFB and ROS1 in osteosarcoma cells. Specifically, GAS5 overexpression in the U2OS osteosarcoma cell line induced TP53, Bax and Bim levels but inhibited DDB2, TGFB and ROS1 expression, resulting in the inhibition of cell proliferation, invasion, colony formation and in vivo tumor formation. By analyzing the GAS5 promoter region (-2000), we identified several potential transcription factor-binding sites including NF-ĸB, IK-1, AP-1, SP1 and IRF1. By individually knocking down these transcription factors, we found that only knockdown of IRF1 affected GAS5 expression. Using immunoprecipitation (IP), mass spectrometry assays, and co-IP assays, we identified that IRF1 formed a transcriptional complex with Histone Deacetylase 1 and 2 (HDAC1/2) and C-terminal binding protein 1 (CtBP1). Functional analyses indicated that the CtBP1-HDAC1/2-IRF1 complex specifically bound to the GAS5 promoter and regulated its expression and downstream events. Knockdown of CtBP1 or overexpression of IRF1 in osteosarcoma cells can significantly reverse their oncogenic phenotypes. Altogether, our results indicated that the CtBP1-HDAC1/2-IRF1 transcriptional complex inhibited GAS5-mediated signaling in osteosarcoma cells, and it might be a potential therapeutic target for osteosarcoma treatment.
Keywords: GAS5, HDAC1, HDCA2, IRF1, CtBP1, transcription
1. Introduction
Osteosarcoma is the most common malignant bone tumor, and it tends to occur in children and young adults [1, 2]. Common symptoms of osteosarcoma include bone pain and swelling [1, 2]. Currently, the major treatment strategies for osteosarcoma involve surgery, chemotherapy and radiation [1, 2]. Compared with other high-incidence cancers, the molecular basis of osteosarcoma is still unclear, and its treatment at the molecular level lacks available targets.
In recent years, long noncoding RNAs (lncRNAs), a class of noncoding RNAs with a length greater than 200 nucleotides (>200 nt), have been demonstrated to play important roles in different diseases, especially in cancers [3-5]. A number of lncRNAs, such as HULC (Highly upregulated in liver cancer), HOTAIR (Hox antisense intergenic RNA), PCA3 (Prostate cancer antigen 3), GAS5 (Growth Arrest Specific 5), ANRIL (Antisense noncoding RNA in the INK4 locus) and PTENP1 (Phosphatase and tensin homolog pseudogene 1), can function in diverse biological processes, including cell differentiation, invasion, apoptosis, and stem cell reprograming [3-5]. Mechanistically, most lncRNAs regulate their downstream targets at the transcriptional level [3-5]. Like many other cancer types, lncRNAs have also been identified to play roles in osteosarcoma pathogenesis and chemoresistance [6, 7]. For instance, TUG1 (Taurine upregulated gene 1) can repress POU2F1 (POU class 2 homeobox 1) and miR-9-5p expression to promote cell proliferation and cell cycle progression but inhibit apoptosis [8]. MALAT1 (Metastasis-associated lung adenocarcinoma transcript 1) contributes to osteosarcoma tumorigenesis through the involvement of PI3K/AKT (Phosphatidylinositol-3-kinase/AKT serine/threonine kinase) and RhoA/ROCK (Ras homolog gene family, member A/Rho-associated protein kinase) signaling [9]. GAS5 functions as a tumor suppressor in osteosarcoma cells by affecting cell proliferation and metastasis [10, 11]. However, the underlying mechanism of lncRNA aberrant expression remains unclear in different diseases [3-12]. One potential mechanism is that transcription factors (TFs) can bind to lncRNA promoters and mediate their expression [4, 13].
TFs are a class of proteins that specifically bind to DNA through consensus sequences [14]. To initiate transcription, TFs also need to associate with corepressors (e.g., C-terminal binding proteins [CtBPs] and retinoblastoma 1 [RB1]), histone acetyltransferases (e.g., p300 and CBP) and histone deacetylases (e.g., HDAC1, 2 and 3) to form transcriptional complexes [15, 16]. Of these transcriptional corepressors, CtBP1 and CtBP2 have been widely identified to function as oncogenes in different cancers including osteosarcoma [17, 18]. They can negatively regulate a number of genes, such as Phosphatase and Tension Homologue (PTEN), Bax, Bim, BRCA1 and 2, Wnt, Cyclin-Dependent Kinase Inhibitors (CDKIs) and E-cadherin, thereby controlling cell proliferation, migration, apoptosis and epithelial-mesenchymal transition (EMT) [17, 18].
Although several previous publications have reported that GAS5 is downregulated in osteosarcoma cells [10, 11], its downstream targets and upstream regulatory mechanism are still unknown. Here, we primarily verified the downregulation of GAS5 in osteosarcoma cancerous tissues and cells and identified its downstream targets through microarray analysis. We also investigated the role of GAS5 in regulating osteosarcoma cell proliferation, invasion, colony formation and in vivo tumor formation. We finally explored the underlying mechanism of GAS5 downregulation in osteosarcoma cells and found that the CtBP1-HDAC1/2-IRF1 transcriptional complex played a dominant role in controlling GAS5 expression. Our results clearly demonstrated GAS5 upstream and downstream signaling, which may contribute to the development of therapeutic strategies for osteosarcoma treatment at the molecular level.
2. Materials and Methods
2.1 Cell culture
The human osteosarcoma cell lines (U2OS, HOS, Saos2, 143B and MG63) and human osteoblast cell line (hFOB 1.19) were purchased from the American Type Culture Collection (ATCC, Virginia, USA). The cells were grown in Dulbecco's modified Eagle's medium (DMEM, GE Healthcare Life Sciences, Pennsylvania, USA, #SH3028401) supplemented with 10% fetal bovine serum (FBS, ThermoFisher Scientific, Massachusetts, USA, #10437028). All osteosarcoma cell lines were cultured in a 37 °C humidified atmosphere containing 95% air and 5% CO2, while hFOB1.19 cells were cultured at 34 °C. The cells were split every three days.
2.2 Osteosarcoma tissue samples
A total of 48 paired cancerous osteosarcoma tissues and their adjacent nontumor tissues were obtained from patients who underwent surgery at the Department of Spine Surgery, Xi'an Honghui Hospital, Xi'an Jiaotong University, China between January 2012 and December 2015. All patients were diagnosed with osteosarcoma according to magnetic resonance imaging (MRI) and histopathological features. Patients signed tissue collection consents that were reviewed and approved by the ethical board of Xi'an Jiaotong University. The patients were divided into four groups (n=12 in each group) according to the Musculoskeletal Tumor Society (MSTS) staging system. The basic clinicopathological characteristics of these patients are summarized in Supplementary Table 1. After surgery, the samples were immediately stored in liquid nitrogen and transferred to a -80 °C ultralow freezer until use.
2.3 Vector construction
The GAS5 mRNA sequence was amplified with the CGGGATCCCAGCACTTGAGCAGCTTTCTTCT (forward) and CCGGAATTCTGGATTGCAAAAATTTATT (reverse) primers and cloned into the BamHI and EcoRI sites of pCDNA3.1 vector (Invitrogen, California, USA, #V79020). Full-length coding sequences of IRF1, HDAC2, and CtBP1 were amplified with the following primers: (1) IRF1-F, CGGGATCCATGCCCATCACTCGGATGCGCA, and IRF1-R, CCGGAATTCCTACGGTGCACAGGGAA; (2) HDAC2-F, CGGGATCCATGGCGTACAGTCAAGGAGGC, and HDAC2-R, CCGGAATTCTCAGGGGTTGCTGAGC; and (3) CtBP1-F, CGGGATCCATGGGCAGCTCGCACTTGC, and CtBP1-R, CCGGAATTCCTACAACTGGTCACTGGCGTGGTCT, and were then cloned into the BamHI and EcoRI sites in the pCDNA3-Flag (Addgene, Massachusetts, USA, #20011) and pCDNA3-Myc (Invitrogen, #V80020) vectors. The plasmids of these vectors were purified with a GeneEluteTM Five-Minute Plasmid Miniprep Kit (Sigma-Aldrich, Missouri, USA, #PFM50) following the manufacturer's protocol.
2.4 Cell transfection
Plasmids and lentiviral packaging sh-GAS5 were transfected into cells using OptiMEM I Reduced Serum Medium (ThermoFisher Scientific, #31985062) and LipofectamineTM 3000 Transfection Reagent (ThermoFisher Scientific, #L3000008) following the manufacturer's guidelines. The shRNA sequences of GAS5 (sh-GAS5) were as follows: sense, 5′-ccggGGACCAGCTTAATGGTTCTttcaagagaAGAACCATTAAGCTGGTCCtttttg-3′ and anti-sense, 5′-aattcaaaaaGGACCAGCTTAATGGTTCTtctcttgaaAGAACCATTAAGCTGGTCC-3′. After 24 hr, the virus-infected cells were selected with puromycin (1 μg/ml) for 48 hr to obtain the GAS5 knockdown cell lines.
2.5 RNA extraction and quantitative real-time PCR (qRT-PCR)
Total RNA was extracted from the cells and tissues using the TRIzolTM Reagent (ThermoFisher Scientific, #15596026) according to the manufacturer's instructions. A total of 0.5 μg RNA from each sample was subjected to reverse transcription to obtain cDNA using a SuperScriptTM III First-Strand Synthesis System Kit (ThermoFisher Scientific, #18080051). The resulting cDNA was diluted 100-fold and applied to a qRT-PCR assay using the Power SYBRTM Green PCR Master Mix (ThermoFisher Scientific, #4367659) with the primers listed in Supplementary Table 2. The expression of β-actin was used for normalization using the 2-ΔΔCt method.
2.6 Microarray analysis
Microarray analysis was performed as described previously [19]. Briefly, total RNA was treated with RNase R (Lucigen, Wisconsin, USA, #RNR07250) to remove the linear RNAs. The resulting RNA was transcribed into fluorescent cRNA using an Arraystar's Super RNA Labeling kit (Arraystar Inc., Maryland, USA, #AS-LE-005) following the manufacturer's protocol. The labeled cRNAs were then purified with the RNeasy Mini kit (Qiagen, Hilden, Germany, #74104), followed by fragmentation and hybridization with a GeneChip Human Genome U133 Plus 2.0 chip (ThermoFisher Scientific, #900466) at 45°C for 20 hr. The chip slides were washed three times and scanned with an Agilent SureScan Dx Microarray Scanner (Agilent, California, USA, #G5761AA). The raw data were collected and analyzed using the GeneSpring GX software (Agilent).
2.7 Western blot assay
Protein levels were measured by Western blots as described previously [18]. Briefly, cells were lysed in RIPA buffer (ThermoFisher Scientific, #89900). Equal amounts of total cell extracts were loaded into 12% SDS-PAGE gels for electrophoresis, followed by transferring onto polyvinylidene difluoride (PVDF) membranes. The membranes were then incubated with primary antibodies including anti-p53 (Abcam, Cambridge, UK, #ab26), anti-Bax (Abcam, #ab32503), anti-Bim (Abcam, #ab32158), anti-DDB2 (Abcam, #ab51017), anti-TGF-β (Abcam, #ab92486), anti-ROS1 (Abcam, #ab108492), anti-Myc (Sigma-Aldrich, #MABE282), anti-Flag (Sigma-Aldrich, #F3165), anti-IRF1 (Abcam, #ab186384), anti-HDAC2 (Abcam, #ab32117), anti-CtBP1 (Abcam, #ab129181), and anti-GAPDH (Abcam, #ab8245). After incubation with HRP-labeled secondary antibodies, the protein band signals were detected using the PierceTM ECL Western Blotting Substrate (ThermoFisher Scientific, #32106).
2.8 Immunoprecipitation (IP) and Co-IP assays
Protein IP assays were performed as described previously [20]. Briefly, cells expressing pCDNA3-IRF1-Flag were lysed in RIPA buffer (ThermoFisher Scientific, #89900) supplemented with 1 × protease inhibitor. The total cell extracts were centrifuged at 13,000 rpm for 15 min, and the supernatant were incubated with anti-Flag agarose beads (Sigma-Aldrich, #A2220) at 4°C for 4 hr. The resulting beads were washed five times with RIPA buffer and the Flag-associated protein complexes were loaded into a 12% SDS-PAGE gel for electrophoresis. Proteins were stained with a ProteSilverTM kit (Sigma-Aldrich, #PROTSIL1-1KT) and then digested with a SMART DigestTM Trypsin Kit (ThermoFisher Scientific, #60109-101). The resulting proteins were subjected to liquid chromatography-mass spectrometry (LC-MS) assay following a previous protocol [20].
Protein Co-IP assays were performed as described previously [20]. Briefly, different combinations of plasmids, including pCDNA3-Myc + pCDNA3-IRF1-Flag, pCDNA3-HDAC2-Myc + pCDNA3-IRF1-Flag, pCDNA3-Myc + pCDNA3-CtBP1-Flag, pCDNA3-HDAC2-Myc + pCDNA3-CtBP1-Flag, and pCDNA3-IRF1-Myc + pCDNA3-CtBP1-Flag, were transfected into hFOB1.19 cells. After incubation at 34 °C for 48 hr, the cells were lysed in RIPA buffer, followed by centrifugation and incubation. The cell lysates were then centrifuged at 4°C for 15 min, and the supernatant was incubated with anti-Flag agarose beads and anti-Myc agarose Beads (Sigma-Aldrich, #A7470). After washing with RIPA buffer, the Flag-associated and Myc-associated proteins were used to detect protein interactions by Western blotting.
2.9 Chromatin immunoprecipitation (ChIP) assay
ChIP assays were performed using a kit (Sigma-Aldrich, # 17-295) following the manufacturer's protocol. The antibodies used in ChIP assays included anti-IRF1 and mouse IgG (Sigma-Aldrich, #I5381). The ChIP DNA samples were analyzed by qRT-PCR with the primers listed in Supplementary Table 3.
2.10 Cell proliferation, invasion and colony formation assays
For the cell proliferation assay, cells were seeded with a density of 103 cells/well in 24‐well plates. The cell viability was determined every 24 hr using an MTT Assay Kit (Abcam, #ab211091) following the manufacturer's instruction. For the cell invasion assay, 1 × 10⁵ cells were seeded in serum-free DMEM medium into the upper chamber of a Transwell cell culture insert (Sigma-Aldrich, #CLS3464). The lower chamber was filled with DMEM containing 10% FBS. After incubation at 37°C for 24 hr, the cells on the surface of the lower chamber were fixed with 4% paraformaldehyde (PFA, Sigma-Aldrich, #158127), followed by staining with 0.1% crystal violet (Sigma-Aldrich, #C0775). For the colony formation assay, 200 cells were seeded in each well of a plate containing DMEM and incubated at 37°C for 14 days with medium renewal every 2-3 days. Formed colonies were fixed with 4% paraformaldehyde at 37°C for 10 min, followed by staining with 0.1% crystal violet for 10 min.
2.11 Tumor xenograft assay
The in vivo tumor xenograft assay was performed following a previous protocol [21]. Briefly, 5 × 10⁵ cells resuspended in 100 μL PBS were subcutaneously injected into 6-week-old female nude mice (n=5 in each group) following protocols approved by the Institutional Animal Care and Use Committee (IACUC) of Xi'an Jiaotong University. The tumor volume was determined with a formula (length × (width2)/2) and was monitored every 5 days using a caliper measurement.
2.12 Statistical analysis
All experiments in this study were performed in triplicate. The data are presented as the mean ± SEM from a representative experiment. The experimental data were analyzed using the two-sided student's t-test and P<0.05 was considered statistically significant.
3. Results
3.1 GAS5 is significantly downregulated in cancerous osteosarcoma tissues and cells
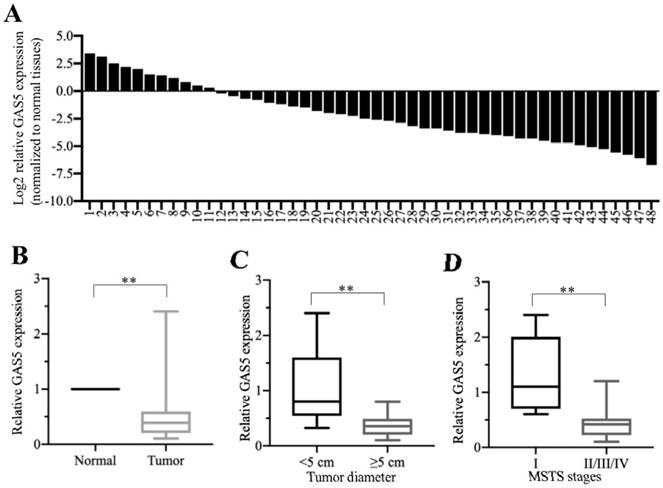
To determine the role of GAS5 in the pathogenesis of osteosarcoma, we primarily performed qRT-PCR assays to examine GAS5 levels in 48 cancerous osteosarcoma tissues and their self-paired adjacent nontumor tissues. As shown in Figures 1A and 1B, we observed the GAS5 was significantly downregulated in more than 77% (37/48) of the cancerous osteosarcoma tissues compared to their adjacent nontumor controls. We also evaluated the correlation between GAS5 levels and tumor size, as well as with tumor MSTS stages. The results indicated that the reduction in GAS5 in osteosarcoma was associated with a larger tumor size (>5 cm, P<0.01) (Figure 1C) and higher MSTS stages (P<0.01) (Figure 1D). Additionally, we also measured GAS5 levels in five osteosarcoma cell lines, including U2OS, HOS, Saos2, 143B and MG63, using hFOB1.19 as a control. Our results also showed a much lower expression of GAS5 in four of these cell lines in comparison to hFOB1.19 cells (Supplementary Figure 1). Thus, our results suggest that significant downregulation of GAS5 is frequently observed in the majority of cancerous osteosarcoma tissues and cell lines, which is consistent with previous publications [10, 11].
3.2 Ectopic expression of GAS5 in osteosarcoma cells reverses their oncogenic phenotypes
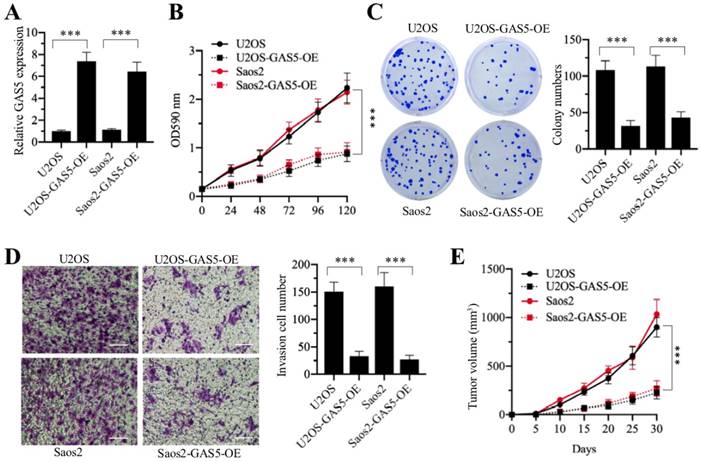
Since GAS5 functions as a tumor suppressor in osteosarcoma cells, we speculated that overexpression of GAS5 should result in cell growth inhibition. Accordingly, we transfected pCDNA3-GAS5 into U2OS and Saos2 cells to overexpress GAS5. After verifying that GAS5 was successfully overexpressed (Figure 2A), we evaluated the oncogenic phenotypes of U2OS-GAS5-OE and Saos2-GAS5-OE. As shown in Figures 2B-2D, GAS5 overexpression in U2OS and Saos2 cells significantly repressed cell proliferation, colony formation and cell invasion in comparison to their maternal controls. To further evaluate whether ectopic expression of GAS5 affected tumor growth in vivo, we also injected U2OS-pCDNA3 (U2OS), U2OS-GAS5-OE, Saos2-pCDNA3 (Saos2) and Saos2-GAS5-OE cells into the back flanks of nude mice. U2OS- and Saos2-injected mice formed palpable tumors within 10 days, while mice injected with U2OS-GAS5-OE and Saos2-GAS5-OE cells exhibited a significant reduction in tumor growth (Figure 2E). Altogether, these results strongly suggested that GAS5 overexpression might be a therapeutic strategy for osteosarcoma treatment.
3.3 GAS5 regulates the expression of several oncogenes and tumor suppressors
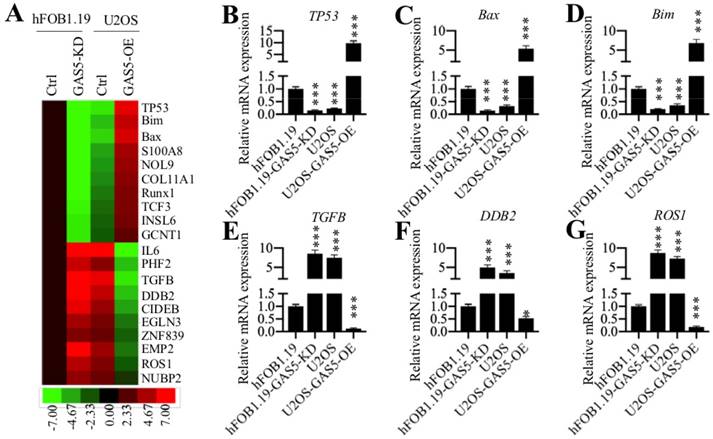
To identify the downstream targets of GAS5 in osteosarcoma cells, we performed a microarray assay using hFOB1.19, hFOB1.19-GAS5-KD, U2OS and U2OS-GAS5-OE cells. Of these cell lines, hFOB1.19-GAS5-KD and U2OS had much lower GAS5 levels than the other two cell lines (Supplementary Figure 2). After microarray analysis, we searched for genes that showed opposite expression patterns under lower and higher GAS5 levels. Overall, we identified 52 genes that meet these standards (Supplementary Table 4). Of them, 19 genes were downregulated in GAS5 knockdown cell lines but upregulated in GAS5 overexpression cell lines. In contrast, the other 33 genes were upregulated in GAS5 knockdown cell lines but downregulated in the GAS5 overexpression cell lines (Supplementary Table 4). We showed the 20 genes with the most obvious expression changes in Figure 3A. Of them, we found several tumor suppressors (TP53, Bim and Bax) and oncogenes (TGFB, DDB2 and ROS1). To further verify the expression of these 6 genes, we performed qRT-PCR analysis on the same RNA samples used for the microarray analysis. As shown in Figures 3B-3D, our results indicated that the expression of TP53, Bim and Bax were significantly repressed in hFOB1.19-GAS5-KD and U2OS cells but upregulated in U2OS-GAS5-OE cells in comparison to hFOB1.19 cells. The expression of TGFB, DDB2 and ROS1 were significantly induced in hFOB1.19-GAS5-KD and U2OS cells but repressed in U2OS-GAS5-OE cells in comparison to hFOB1.19 cells (Figures 3E-3G). We next sought to determine whether the protein levels of these 6 genes were also changed with GAS5 knockdown or overexpression. Accordingly, we measured p53, Bim, Bax, TGF-β, DDB2 and ROS1 in hFOB1.19, hFOB1.19-GAS5-KD, U2OS and U2OS-GAS5-OE cells. Consistent with their mRNA levels, we also observed the repression of p53, Bim and Bax and induction of TGF-β, DDB2 and ROS1 in hFOB1.19-GAS5-KD and U2OS cells (Supplementary Figure 3). In contrast, their protein levels were reversed in the GAS5 overexpression cells (Supplementary Figure 3).
GAS5 was significantly downregulated in cancerous osteosarcoma tissues. (A) The qRT-PCR analysis of the relative GAS5 levels (log2-fold change) in cancerous osteosarcoma tissues (n = 48) and their self-paired adjacent nontumor tissues (n = 48). (B) The data in (A) were represented as fold-change. **P<0.01. (C) The expression of GAS5 was significantly downregulated in larger tumors. Cancerous tissue samples were divided into two groups according to tumor sizes (≥5 cm and <5 cm), and the relative expression of GAS5 in these two group samples was determined by qRT-PCR. **P<0.01. (D) The expression of GAS5 was significantly downregulated in advanced MSTS stage samples. Cancerous tissue samples were divided into two groups according to tumor MSTS stages (I and II/III/IV), and the relative expression of GAS5 in these two group samples was determined by qRT-PCR. **P<0.01.
Overexpression of GAS5 in osteosarcoma cells can reverse oncogenic phenotypes. The pCDNA3 and pCDNA3-GAS5 vectors were transfected into U2OS and Saos2 cells to generate the U2OS-pCDNA3 (U2OS), U2OS-pCDNA3-GAS5 (U2OS-GAS5-OE), Saos2-pCDNA3 (Saos2), and Saos2-pCDNA3-GAS5 (Saos2-GAS5-OE) cell lines. These cell lines were applied to evaluate oncogenic phenotypes. (A) qRT-PCR was performed to measure the relative expression of GAS5. ***P<0.001. (B) Cell proliferation assay. Cell proliferation was determined using an MTT kit at 0-, 24-, 48-, 72-, 96- and 120-hour time points. *** P < 0.001. (C) Colony formation assay. Cells were seeded in plates with a density of 200 cells per well and grown at 37°C for 14 days. (Left) Cell colonies were stained with 0.1% crystal violet. (Right) Colony numbers were quantified. ***P < 0.001. (D) Cell invasion assay. Cells were seeded into Transwell chambers and grown at 37°C overnight. (Left) Cells were stained with 0.1% crystal violet. Bars=50 μm. (Right) Cell numbers were quantified. ***P < 0.001. (E) In vivo tumor growth. Cells were injected into nude mice and tumor volumes were measured with calipers at 5-day intervals. ***P < 0.001.
GAS5 can target several tumor suppressors and oncogenes. (A) The heat maps of the top 20 GAS5-dependent genes in osteosarcoma cells. Total RNAs from hFOB1.19 cells expressing control-shRNA (Ctrl) and shGAS5 (GAS5-KD) and U2OS cells expressing pCDNA3 (Ctrl) and pCDNA3-GAS5 (GAS5-OE) were applied for microarray analysis. The top 20 aberrant expression genes including 10 upregulated and 10 downregulated genes are shown. (B-G) qRT-PCR analyses were performed to measure the mRNA levels of TP53 (B), Bax (C), Bim (D), TGFB (E), DDB2 (F) and ROS1 (G) in the same RNA samples used in (A). The expression of these six genes in hFOB1.19-Ctrl cells was defined as 1-fold. *P < 0.05 and ***P < 0.001.
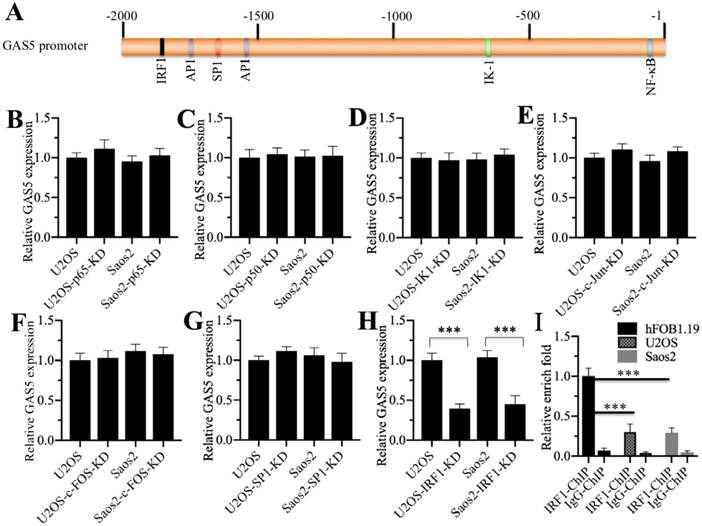
Transcription factor IRF1 specifically binds to the GAS5 promoter. (A) A schematic diagram of TF binding sites in the GAS5 promoter. Different binding positions of TFs including NF-ĸB, IK-1, AP-1, SP-1 and IRF1 are shown in the GAS5 promoter regions (-1 to -2000). (B-H) The effects of knocking down different TFs on GAS5 expression. U2OS and Saos2 cells were transfected with si-p65 (B), si-p50 (C), si-IK1 (D), si-c-Jun (E), si-c-FOS (F), si-SP1 (G) and si-IRF1 (H). After incubation at 37 °C for 48 hr, the cells were applied to qRT-PCR analyses to measure GAS5 expression. ***P < 0.001. (I) The enrichment of IRF1 in the GAS5 promoter was significantly reduced in osteosarcoma cells. The hFOB1.19, U2OS and Saos2 cells were applied to ChIP assay using the anti-IRF1 antibody. qRT-PCR analysis was performed to measure the enrichment of IRF1 in the GAS5 promoter. ***P < 0.001.
3.4 Transcription factor interferon regulatory factor 1 (IRF1) specifically regulates GAS5 expression
One possibility regarding GAS5 downregulation in osteosarcoma is that it is regulated at the transcriptional level. Based on this, we selected a 2-kb length of the GAS5 promoter region for analysis in an attempt to find a TF that regulates GAS5 expression. As shown in Figure 4A, we found several potential TF binding sites including NF-ĸB (Nuclear factor kappa-light-chain-enhancer of activated B cells), IK-1 (IKAROS Family Zinc Finger 1), AP-1 (Activator protein 1), SP-1 (Specificity protein 1) and IRF1 (Interferon regulatory factor 1). To investigate whether these TFs were involved in the regulation of GAS5, we individually knocked down the expression of these TFs or their subunits in U2OS and Saos2 cells and then examined whether GAS5 expression was altered. Our results indicated that knockdown of NF-ĸB subunits (p65 and p50) (Figures 4B and 4C), IK-1 (Figure 4D), AP-1 subunits (c-Jun and c-FOS) (Figures 4E and 4F), and SP-1 (Figure 4G) did not affect GAS5 expression. Interestingly, knockdown of IRF1 significantly repressed GAS5 expression in both U2OS and Saos-2 cells (Figure 4H). Given that GAS5 was downregulated in osteosarcoma cells, we also examined IRF1 levels in the same cell lines. The results showed that IRF1 showed the same expression pattern as GAS5 in the osteosarcoma cell lines (Supplementary Figure 4). These results suggested that IRF1 might be a major regulator of GAS5 expression in osteosarcoma cells, and its binding to the GAS5 promoter might be diminished. To verify this hypothesis, we also performed a ChIP assay in hFOB1.19, U2OS and Saos2 cells using anti-IRF1 antibody to evaluate the binding of IRF1 to the GAS5 promoter. Our results showed that IRF1 binding was significantly reduced in U2OS and Saos2 cells in comparison to hFOB1.19 cells (Figure 4I).
In the 2-kb GAS5 promoter region, we only found one potential IRF1 binding site (CGGTTTCCCTTTGGGGT) located between -1846-(-)1864 in the trans-direction. To determine if IRF1 bound to the GAS5 promoter through this consensus site, we performed luciferase assays in hFOB1.19 cells cotransfected with the pCDNA3-IRF1-Flag, pRL-TK (Renilla luciferase) and pGL4.26-PGAS5-WT or pGL4.26-PGAS5-Mut (IRF1 site mutation: CGGCCCAAACCCGGGGT) firefly luciferase vectors. The results showed that IRF1 can significantly induce the luciferase activity of GAS5-WT, but not GAS5-Mut (Supplementary Figure 5), which suggested that IRF1 bound the GAS5 promoter at the -1846-(-)1864 consensus site.
IRF1 forms a transcriptional complex with HDAC1/2 and CtBP1. (A) The in vivo IP of the IRF1-associated complex. U2OS cells expressing pCDNA3-Flag and pCDNA3-IRF1-Flag were applied to IP analysis with the anti-Flag antibody. The obtained protein complex was separated by SDS-PAGE gel electrophoresis and then incubated with a silver staining kit. The IRF1 and IgG bands are indicated. (B) IRF1 associated with HDAC1/2 and CtBP1 in vivo. U2OS cells were applied to IP analysis with the anti-IRF1 and anti-IgG antibodies. The obtained protein complex was examined to detect the association of IRF1 with HDAC1/2 and CtBP1. (C) HDAC1/2 can directly interact with IRF1 and CtBP1. hFOB1.19 cells were transfected with the following combinations of vectors: pCDNA3-Myc + pCDNA3-IRF1-Flag, pCDNA3-CtBP1-Myc + pCDNA3-IRF1-Flag, pCDNA3-Myc + pCDNA3-HDAC1-Flag, pCDNA3-Myc + pCDNA3-HDAC2-Flag, pCDNA3-CtBP1-Myc + pCDNA3-HDAC1-Flag, pCDNA3-CtBP1-Myc + pCDNA3-HDAC2-Flag, pCDNA3-IRF1-Myc + pCDNA3-HDAC1-Flag, and pCDNA3-IRF1-Myc + pCDNA3-HDAC2-Flag. After incubation at 37°C for 48 hr, cells were applied to Co-IP assays with anti-Myc-Agarose or anti-Flag-Agarose beads. The input and output protein levels were determined by Western blotting with anti-Flag and anti-Myc antibodies. (D) HDAC1 and HDAC2 formed a heterodimer. hFOB1.19 cells were transfected with the following combinations of vectors: pCDNA3-Myc + pCDNA3-HDAC2-Flag and pCDNA3-HDAC1-Myc + pCDNA3-HDAC2-Flag. After incubation at 37°C for 48 hr, cells were applied to Co-IP assays with anti-Myc-Agarose or anti-Flag-Agarose beads. The input and output protein levels were determined by Western blotting with anti-Flag and anti-Myc antibodies. (E) CtBP1 was overexpressed in osteosarcoma cells. qRT-PCR analysis was performed to measure the relative CtBP1 levels in osteosarcoma cell lines including U2OS, HOS, Saos2, 143B and MG63 using hFOB1.19 as a control. **P<0.01 and ***P<0.001.
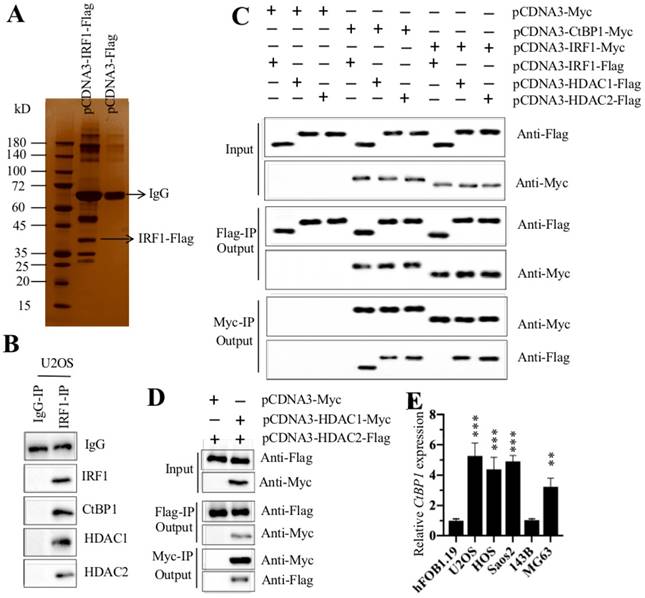
3.5 IRF1 forms a transcriptional complex with HDAC1/2 and CtBP1 in vivo and in vitro
Given that TFs often associate with corepressors, coactivators, and histone-modifying enzymes to form transcriptional complexes [15, 16], we next sought to determine the IRF1-associated proteins in osteosarcoma cells through IP and mass spectrometry assays. Accordingly, we transfected pCDNA3-IRF1-Flag into U2OS cells and then immunoprecipitated the proteins with anti-Flag antibody (Figure 5A). The obtained Flag-IRF1-associated protein complex was applied to mass spectrometry analysis. In total, we identified 56 proteins that might associate with IRF1 (Supplementary Table 5). Of these proteins, we found the transcriptional corepressor CtBP1 and two histone deacetylases (HDAC1 and 2) (Supplementary Table 5). To verify whether IRF1 can associate with CtBP1 and HDAC1/2 in vivo, we performed an IP assay with anti-IRF1 in U2OS cells to obtain native IRF1-associated complexes. Next, we examined the protein complex with anti-IRF1, anti-CtBP1, anti-HDAC1 and anti-HDAC2 antibodies. Our results indicated that IRF1 can pull down CtBP1 and HDAC1/2 (Figure 5B). To further determine whether IRF1 can directly interact with CtBP1 and HDAC1/2, we performed an in vitro Co-IP analysis. Accordingly, we expressed the following plasmids in hFOB1.19 cells: pCDNA3-Myc + pCDNA3-IRF1-Flag, pCDNA3-CtBP1-Myc + pCDNA3-IRF1-Flag, pCDNA3-Myc + pCDNA3-HDAC1-Flag, pCDNA3-Myc + pCDNA3-HDAC2-Flag, pCDNA3-CtBP1-Myc + pCDNA3-HDAC1-Flag, pCDNA3-CtBP1-Myc + pCDNA3-HDAC2-Flag, pCDNA3-IRF1-Myc + pCDNA3-HDAC1-Flag, and pCDNA3-IRF1-Myc + pCDNA3-HDAC2-Flag. Our results indicated that CtBP1 can directly interact with HDAC1 and HDAC2 and IRF1 can also directly interact with HDAC1 and HDAC2 (Figure 5C). However, we did not find a direct interaction between CtBP1 and IRF1 (Figure 5C). HDAC1 and HDAC2 share over 80% protein sequence identify and can form a heterodimer. Thus, we performed Co-IP analysis to determine their interactions. As shown in Figure 5D, the results showed that HDAC1 and HDAC2 formed a heterodimer in osteosarcoma cells. These results suggested that IRF1 can form a transcriptional complex with HDAC1/2 and CtBP1 in vivo and in vitro.
CtBP1 is a well-known oncogene that is overexpressed in multiple cancers [22-24]. Thus, we also examined its expression in osteosarcoma cells. Our results showed that CtBP1 was significantly overexpressed in U2OS, HOS, Saos2 and MG63 cells in comparison to hFOB1.19 cells (Figure 5E), which was exactly the opposite of GAS5 expression. These results implied that CtBP1 was a negative regulator of GAS5.
3.6 The CtBP1-HDAC1/2-IRF1 complex specifically regulates GAS5 expression and its downstream events
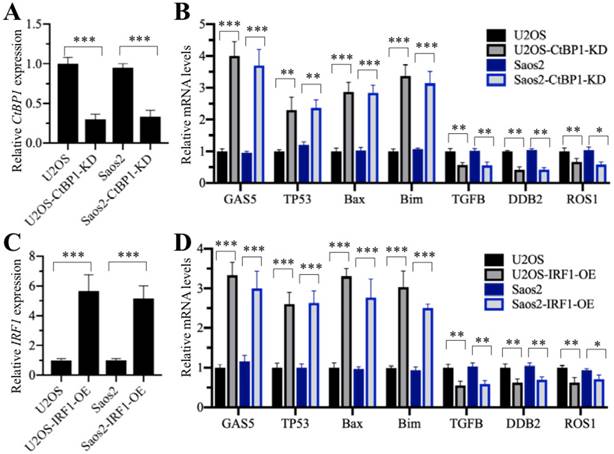
We next sought to determine the effects of CtBP1 and IRF1 on the expression of GAS5 and its downstream targets. Accordingly, we primarily knocked down CtBP1 in U2OS and Saos-2 cells (Figure 6A), followed by examining the expression of GAS5 and its downstream targets. Our results indicated that GAS5 expression was obviously increased with a decrease in CtBP1 (Figure 6B). At the same time, the expression of its downstream targets, including TP53, Bax and Bim were also induced, while the expression of TGFB, DDB2 and ROS1 were decreased in U2OS-KD and Saos2-KD cells compared to their maternal cells (Figure 6B). Additionally, we overexpressed IRF1 in U2OS and Saos-2 cells (Figure 6C) and measured the expression of GAS5 and its downstream targets. Similar to CtBP1 knockdown, we also found that the expression of GAS5 and its downstream targets TP53, Bax and Bim were significantly increased in IRF1-overexpressing cells, while the expression of TGFB, DDB2 and ROS1 was dramatically decreased (Figure 6D).
Knockdown of CtBP1 and overexpression of IRF1 affected the expression of GAS5 targets. U2OS and Saos2 cells were transfected shCtBP1 and control-shRNA to generate the U2OS-control-shRNA (U2OS), U2OS-CtBP1-KD, Saos2-control-shRNA (Saos2), Saos2-CtBP1-KD cell lines. These cell lines were then used to measure the mRNA levels of CtBP1 (A) and GAS5 and GAS5 targets including TP53, Bax, Bim, TGFB, DDB2 and ROS1 (B). U2OS and Saos2 cells were transfected with pCDNA3-Flag and pCDNA3-IRF1-Flag to generate the U2OS-pCDNA3-Flag (U2OS), U2OS-IRF1-OE, Saos2- pCDNA3-Flag (Saos2), Saos2-IRF1-OE cell lines. These cell lines were then used to measure the mRNA levels of IRF1 (C) and GAS5 and GAS5 targets (D). *P<0.05, **P<0.01 and ***P<0.001.
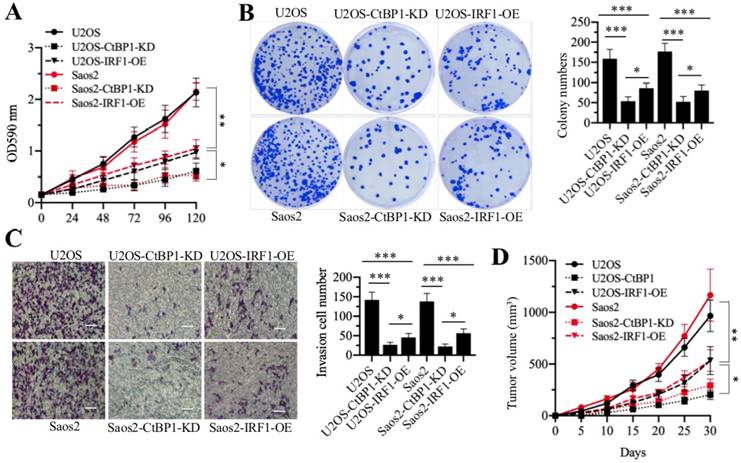
Knockdown of CtBP1 and overexpression of IRF1 reversed the oncogenic phenotypes of osteosarcoma cells. U2OS, U2OS-CtBP1-KD, U2OS-IRF1-OE, Saos2, Saos2-CtBP1-KD and Saos2-IRF1-OE cells were applied to evaluate the oncogenic phenotypes of osteosarcoma cells. (A) cell proliferation assay. Cell proliferation was determined using an MTT kit at 0-, 24-, 48-, 72-, 96- and 120-hour time points. * P < 0.05 and ** P < 0.01. (B) Colony formation assay. Cells were seeded in plates with a density of 200 cells per well and grown at 37°C for 14 days. (Left) Cell colonies were stained with 0.1% crystal violet. (Right) Colony numbers were quantified. * P < 0.05 and ***P < 0.001. (C) Cell invasion assay. Cells were seeded into Transwell chambers and grown at 37°C overnight. (Left) Cells were stained with 0.1% crystal violet. Bars=50 μm. (Right) Cell numbers were quantified. * P < 0.05 and ***P < 0.001. (D) In vivo tumor growth. Cells were injected into nude mice and tumor volumes were measured with calipers at 5‐day intervals. * P < 0.05 and ** P < 0.01.
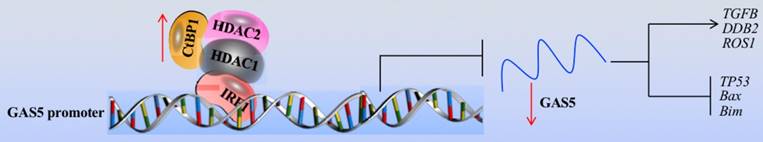
Schematic model of the CtBP1-HDAC1/2-IRF1 transcriptional complex that regulates the expression of GAS5 and its targets. The IRF1 transcription factor specifically binds to the GAS5 promoter, which further recruits HDAC1/2 and CtBP1 to form a transcriptional complex. In osteosarcoma cells, the overexpression of CtBP1 represses the transcriptional activity of IRF1, resulting the downregulation of GAS5. The downregulated GAS5 further regulates the expression of its downstream targets, causing upregulation of oncogenes including TGFB, DDB2 and ROS1 and downregulation of tumor suppressors including TP53, Bax and Bim.
To monitor the contribution of CtBP1 knockdown and IRF1 overexpression to oncogenic phenotypes in osteosarcoma cells, we examined cell proliferation, colony formation, cell invasion and in vivo tumor growth in U2OS-CtBP1-KD, Saos2-CtBP1-KD, U2OS-IRF1-OE and Saos2-IRF1-OE cells compared with their respective maternal cells. As shown in Figure 7, both CtBP1 knockdown and IRF1 overexpression caused a significant repression of oncogenic phenotypes in comparison to their maternal controls. Altogether, our results strongly indicate that the CtBP1-HDAC1/2-IRF1 transcriptional complex regulates the aberrant expression of GAS5 and its downstream targets, thereby resulting in the occurrence of osteosarcoma.
4. Discussion
Although GAS5 has been found to function as a tumor suppressor for several years, its role in osteosarcoma cells is still obscure [10,11]. In the present study, we first verified the overexpression of GAS5 in a large number of cancerous osteosarcoma tissues and cells and found that GAS5 can specifically regulate the expression of tumor suppressor genes (TP53, Bax and Bim) and oncogenes (TGFB, DDB2 and ROS1). Then, we demonstrated the underlying mechanism of GAS5 downregulation, and our results support a model where the CtBP1-HDAC1/2-IRF1 transcriptional complex binds to the GAS5 promoter and negatively regulates its expression (Figure 8).
In this study, we observed CtBP1 overexpression, IRF1 and GAS5 downregulation in osteosarcoma cells. These results were consistent with the results in other cancers [22-30]. Previous results have shown that CtBP1 can negatively regulate the apoptotic regulators Bax and Bim and the tumor suppressor p53 [17, 31, 32], but the underlying regulatory mechanisms are not fully understood. Our model provides a new explanation for this process at the transcriptional level. To the best of our knowledge, our results demonstrated for the first time how the CtBP1-HDAC1/2-IRF1/GAS5-mediated signaling pathway regulated the expression of TGFB, DDB2 and ROS1. Given that the same transcriptional complex may have different targets in different cell types, our results may be beneficial for identifying new targets in other cancer cell types. Additionally, our results also indicated that knockdown of CtBP1 as well as overexpression of IRF1 and GAS5 can reverse the in vitro and in vivo oncogenic phenotypes of osteosarcoma cells. Thus, targeting these three genes might be effective strategies for osteosarcoma therapies. Comparing the oncogenic phenotypes of CtBP1 knockdown and IRF1 or GAS5 overexpression, we found that cells with CtBP1 knockdown had much more severe phenotypes than cells overexpressing IRF1 or GAS5. This may be because CtBP1 has more downstream target genes and CtBP1 knockdown affects more gene expression, not only the genes affected by GAS5 targets. In recent years, therapeutically targeting CtBP1 been has considered an effective method to treat diverse tumor types [17, 33, 34]. Two small molecules, NSC95397 and MTOB, are commercially available and show strong inhibitory roles on CtBP1-dependent tumorigenesis [17, 33, 34]. Most recently, a CPP-E1A fusion peptide has been shown to inhibit CtBP1-mediated transcriptional repression in lung and melanoma cells [35]. These methods provide very good choices for us to develop treatment strategies for osteosarcoma.
Histone modifications including methylation, phosphorylation, acetylation, ubiquitylation, and sumoylation are covalent posttranslational modifications to histone proteins that can regulate gene expression by changing chromatin structure or recruiting histone modifiers [36]. In our results, we found that HDAC1/2 formed a heterodimer and interacted with CtBP1 and IRF1. It is well-known that CtBP1 can interact with HDACs through the conserved PXDLS motif, and that CtBP1-HDACs can be recruited by TFs to regulate gene expression [37, 38]. However, we did not investigate the roles of HDAC1/2 in the regulation of GAS5 and the expression of its downstream targets. LncRNAs have been shown to play important roles in cancer pathogenesis, including in osteosarcoma [3-5]. Currently, only a few of lncRNAs have been mechanistically characterized and they function through a wide variety of mechanisms such as regulating mRNA processing and translation, affecting miRNA levels, and controlling chromatin structure [3-7]. In our study, we only examined GAS5 levels in osteosarcoma tissues and cells, but not detect whether other known lncRNAs (e.g., TUG1 and MALAT1) also have similar regulatory mechanism regarding their aberrant expression in osteosarcoma [6, 7]. To fully understand the role of lncRNAs in osteosarcoma, it is necessary to perform RNA-seq or microarray assays to identify more lncRNAs involved in the pathogenesis of osteosarcoma. Undoubtedly, the finding that the CtBP1-HDAC1/2-IRF1 transcriptional complex regulates the expression of GAS5 enriches our understanding of the mechanism of aberrant expression of lncRNAs in various biological processes. Our results will provide guideline for investigating the underlying mechanism of lncRNA expression at transcriptional level.
In summary, we discovered that GAS5 was downregulated in osteosarcoma tumors and cells through targeting tumor suppressor genes, including TP53, Bax and Bim as well as oncogenes, including TGFB, DDB2 and ROS1. Further studies revealed that IRF1 associated with HDAC1/2 and CtBP1 to form a complex that can specifically bind to the GAS promoter, thereby regulating the expression of GAS5 and its downstream targets. Knockdown of CtBP1 or overexpression of IRF1 and GAS5 can inhibit osteosarcoma cell growth in vitro and osteosarcoma tumor growth in vivo.
Supplementary Material
Supplementary figures and tables.
Acknowledgements
This study was supported by grants from the Scientific Research Fund Project of Yunnan Provincial Education Department (Grant number: 2018JS199), the Hundred-Talent Program of Kunming Medical University, and the Joint Project of Yunnan Science and Technology Department and Kunming Medical University Foundation (Grant number: 2013FZ269).
Authors' contributions
Xinliang Zhang and Kaili Du carried out the main experiments, and prepared the figures. Zhenkai Lou, Keyuan Ding, and Fan Zhang helped perform the data analysis. Jinwen Zhu and Zheng Cang designed and provided experimental suggestion, as well as wrote the manuscript.
Competing Interests
The authors have declared that no competing interest exists.
References
1. Ferguson JL, Turner SP. Bone Cancer: Diagnosis and Treatment Principles. Am Fam Physician. 2018;98:205-13
2. Taran SJ, Taran R, Malipatil NB. Pediatric Osteosarcoma: An Updated Review. Indian J Med Paediatr Oncol. 2017;38:33-43
3. Fang Y, Fullwood MJ. Roles, Functions, and Mechanisms of Long Non-coding RNAs in Cancer. Genomics Proteomics Bioinformatics. 2016;14:42-54
4. Kung JT, Colognori D, Lee JT. Long noncoding RNAs: past, present, and future. Genetics. 2013;193:651-69
5. Cao J. The functional role of long non-coding RNAs and epigenetics. Biol Proced Online. 2014;16:11
6. Chen R, Wang G, Zheng Y. et al. Long non-coding RNAs in osteosarcoma. Oncotarget. 2017;8:20462-75
7. Smolle MA, Pichler M. The Role of Long Non-Coding RNAs in Osteosarcoma. Noncoding RNA. 2018;4(1):7
8. Zhao XB, Ren GS. LncRNA Taurine-Upregulated Gene 1 Promotes Cell Proliferation by Inhibiting MicroRNA-9 in MCF-7 Cells. J Breast Cancer. 2016;19:349-57
9. Cheng Y, Imanirad P, Jutooru I. et al. Role of metastasis-associated lung adenocarcinoma transcript-1 (MALAT-1) in pancreatic cancer. PLoS One. 2018;13:e0192264
10. Wang Y, Kong D. LncRNA GAS5 Represses Osteosarcoma Cells Growth and Metastasis via Sponging MiR-203a. Cell Physiol Biochem. 2018;45:844-55
11. Ye K, Wang S, Zhang H. et al. Long Noncoding RNA GAS5 Suppresses Cell Growth and Epithelial-Mesenchymal Transition in Osteosarcoma by Regulating the miR-221/ARHI Pathway. J Cell Biochem. 2017;118:4772-81
12. Sanchez Y, Huarte M. Long non-coding RNAs: challenges for diagnosis and therapies. Nucleic Acid Ther. 2013;23:15-20
13. Dykes IM, Emanueli C. Transcriptional and Post-transcriptional Gene Regulation by Long Non-coding RNA. Genomics Proteomics Bioinformatics. 2017;15:177-86
14. Pan Y, Tsai CJ, Ma B, Nussinov R. Mechanisms of transcription factor selectivity. Trends Genet. 2010;26:75-83
15. Reiter F, Wienerroither S, Stark A. Combinatorial function of transcription factors and cofactors. Curr Opin Genet Dev. 2017;43:73-81
16. Kurtev V, Margueron R, Kroboth K. et al. Transcriptional regulation by the repressor of estrogen receptor activity via recruitment of histone deacetylases. J Biol Chem. 2004;279:24834-43
17. Blevins MA, Huang M, Zhao R. The Role of CtBP1 in Oncogenic Processes and Its Potential as a Therapeutic Target. Mol Cancer Ther. 2017;16:981-90
18. Du K, Zhang X, Lou Z. et al. MicroRNA485-3p negatively regulates the transcriptional co-repressor CtBP1 to control the oncogenic process in osteosarcoma cells. Int J Biol Sci. 2018;14:1445-56
19. Jiang K, Zhang C, Yu B. et al. Autophagic degradation of FOXO3a represses the expression of PUMA to block cell apoptosis in cisplatin-resistant osteosarcoma cells. Am J Cancer Res. 2017;7:1407-22
20. Chen Z, Zhang W, Jiang K. et al. MicroRNA-300 Regulates the Ubiquitination of PTEN through the CRL4B(DCAF13) E3 Ligase in Osteosarcoma Cells. Mol Ther Nucleic Acids. 2018;10:254-68
21. Lyu H, Wang S, Huang J. et al. Survivin-targeting miR-542-3p overcomes HER3 signaling-induced chemoresistance and enhances the antitumor activity of paclitaxel against HER2-overexpressing breast cancer. Cancer Lett. 2018;420:97-108
22. Dcona MM, Morris BL, Ellis KC. et al. CtBP- an emerging oncogene and novel small molecule drug target: Advances in the understanding of its oncogenic action and identification of therapeutic inhibitors. Cancer Biol Ther. 2017;18:379-91
23. Wang L, Zhou H, Wang Y. et al. CtBP maintains cancer cell growth and metabolic homeostasis via regulating SIRT4. Cell Death Dis. 2015;6:e1620
24. Chinnadurai G. The transcriptional corepressor CtBP: a foe of multiple tumor suppressors. Cancer Res. 2009;69:731-4
25. Kim PK, Armstrong M, Liu Y. et al. IRF-1 expression induces apoptosis and inhibits tumor growth in mouse mammary cancer cells in vitro and in vivo. Oncogene. 2004;23:1125-35
26. Murtas D, Maric D, De Giorgi V. et al. IRF-1 responsiveness to IFN-gamma predicts different cancer immune phenotypes. Br J Cancer. 2013;109:76-82
27. Schwartz JL, Shajahan AN, Clarke R. The Role of Interferon Regulatory Factor-1 (IRF1) in Overcoming Antiestrogen Resistance in the Treatment of Breast Cancer. Int J Breast Cancer. 2011;2011:912102
28. Gao Q, Xie H, Zhan H. et al. Prognostic Values of Long Noncoding RNA GAS5 in Various Carcinomas: An Updated Systematic Review and Meta-Analysis. Front Physiol. 2017;8:814
29. Li S, Zhou J, Wang Z. et al. Long noncoding RNA GAS5 suppresses triple negative breast cancer progression through inhibition of proliferation and invasion by competitively binding miR-196a-5p. Biomed Pharmacother. 2018;104:451-7
30. Li J, Wang Y, Zhang CG. et al. Effect of long non-coding RNA Gas5 on proliferation, migration, invasion and apoptosis of colorectal cancer HT-29 cell line. Cancer Cell Int. 2018;18:4
31. Paliwal S, Pande S, Kovi RC. et al. Targeting of C-terminal binding protein (CtBP) by ARF results in p53-independent apoptosis. Mol Cell Biol. 2006;26:2360-72
32. Raza U, Saatci O, Uhlmann S. et al. The miR-644a/CTBP1/p53 axis suppresses drug resistance by simultaneous inhibition of cell survival and epithelial-mesenchymal transition in breast cancer. Oncotarget. 2016;7:49859-77
33. Dcona MM, Morris BL, Ellis KC. et al. CtBP- an emerging oncogene and novel small molecule drug target: Advances in the understanding of its oncogenic action and identification of therapeutic inhibitors. Cancer Biol Ther. 2017;18:379-91
34. Straza MW, Paliwal S, Kovi RC. et al. Therapeutic targeting of C-terminal binding protein in human cancer. Cell Cycle. 2010;9:3740-50
35. Blevins MA, Zhang C, Zhang L. et al. CPP-E1A fusion peptides inhibit CtBP-mediated transcriptional repression. Mol Oncol. 2018;12:1358-73
36. Bannister AJ, Kouzarides T. Regulation of chromatin by histone modifications. Cell Res. 2011;21:381-95
37. Subramanian T, Chinnadurai G. Association of class I histone deacetylases with transcriptional corepressor CtBP. FEBS Lett. 2003;540:255-8
38. Zhang CL, McKinsey TA, Lu JR. et al. Association of COOH-terminal-binding protein (CtBP) and MEF2-interacting transcription repressor (MITR) contributes to transcriptional repression of the MEF2 transcription factor. J Biol Chem. 2001;276:35-9
Author contact
![]() Corresponding authors: jeven801208com; and 13891989197com.
Corresponding authors: jeven801208com; and 13891989197com.
Received 2019-1-26
Accepted 2019-5-5
Published 2019-6-2