ISSN: 1449-2288International Journal of Biological Sciences

Int J Biol Sci 2009; 5(7):647-658. doi:10.7150/ijbs.5.647 This issue Cite
Review
Clinical diagnosis for discogenic low back pain
Yin-gang Zhang1 ![]() , Tuan-mao Guo1, Xiong Guo2, Shi-xun Wu1
, Tuan-mao Guo1, Xiong Guo2, Shi-xun Wu1
1. Department of Orthopaedics, the First Affiliated Hospital, Medical College of Xi'an Jiaotong University, Xi'an 710061, P.R. China
2. Key Laboratory of Environment and Genes Related to Diseases of Ministry of Education, Xi'an Jiaotong University, Xi'an 710061, P.R. China
Abstract
Discogenic lower back pain (DLBP) is the most common type of chronic lower back pain (LBP), accounting for 39% of cases, compared to 30% of cases due to disc herniation, and even lower prevalence rates for other causes, such as zygapophysial joint pain. Only a small proportion (approximately 20%) of LBP cases can be attributed with reasonable certainty to a pathologic or anatomical entity. Thus, diagnosing the cause of LBP represents the biggest challenge for doctors in this field. In this review, we summarize the process of obtaining a clinical diagnosis of DLBP and discuss the potential for serum-based diagnosis in the near future. The use of serum biomarkers to diagnose DLBP is likely to increase the ease of diagnosis as well as produce more accurate and reproducible results.
Keywords: discogenic lower back pain, clinical diagnosis, serum proteomics
Introduction
Research shows that an estimated 80% of the population will suffer from lower back pain (LBP) at some time in their lives. Many of these people will probably suffer LBP on many occasions, and chronic LBP is the biggest factor limiting activity in young adults under the age of 45. Epidemiological investigations in the United States revealed an estimated 5-20% yearly prevalence of LBP. LBP interferes with the daily lives of patients, eventually decreasing their quality of life. The costs associated with this condition are enormous, including both direct medical costs and indirect costs, such as decreased productivity in the workplace. LBP is therefore not only a health problem but also a socio-economic problem.
Pathology
Disc degeneration in humans can begin as early as the third decade of life. Aging, obesity, smoking, vibrations from transportation, excessive axial loads, and other factors accelerate the degeneration of intervertebral discs [1-3]. Anderson et al. [4] found that disc degeneration was one of the main reasons for chronic LBP. At present, most data show that chronic LBP is most closely related to the anatomical structure of the intervertebral disc, particularly in patients with no obvious herniation of the nucleus pulposus, representing the clinical pathology of the disease process known as discogenic lower back pain (DLBP). DLBP is the most common disease of chronic LBP, accounting for 39% of its incidence. Lower disc herniation (LDH) represents less than 30% of cases, and other causes, such as zygapophysial joint pain, are responsible for an even lower proportion of LBP cases.
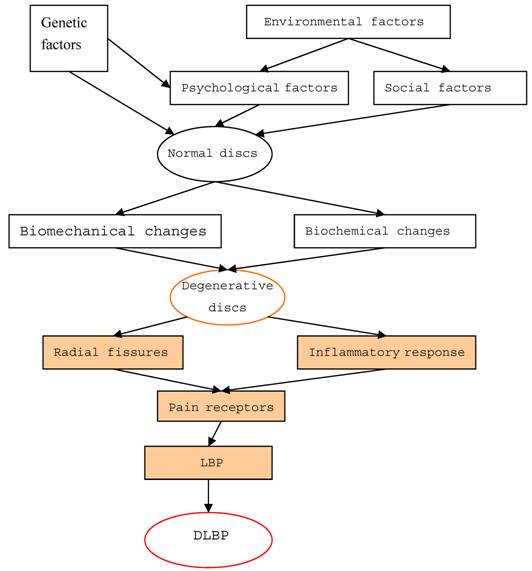
DLBP is a loss of lower back function with pain. While the external outline of the disc may remain intact, multiple processes (degeneration, end plate injury, inflammation, etc.) can internally stimulate pain receptors inside the disc without nerve root symptoms. Additionally, there is no root symptom, and no evidence of segmental activities of the radiology. Disc disorders were first documented by Crock in 1970, and the term DLBP was coined in 1979. Since then, many scholars have conducted in-depth studies on this condition. According to epidemiological investigations, DLBP is a complex disease with genetic, community and mental health implications. Patient groups with a genetic susceptibility to DLBP are considered high-risk and experience changes in the chemical and biological composition of their intervertebral discs, as well as metabolic changes in their bodies. Abnormal stresses reduce the amount of water in the nucleus gelatinosus, inducing degeneration of the disc. The disc is then unable to bear stress evenly, and localized increase in stress cause structural injuries that lead to a tear or rupture in the annular fibrosis and end plate. Damage to the end plate accelerates the pathological process of disc degeneration. During this degenerative process, cells of the disc nucleus generate an inflammatory response, releasing a large number of inflammatory factors or cytokines. Studies have suggested that patients with DLBP have significantly higher levels of released interleukin-1 (IL-1), IL-6, and IL-8 compared to patients with disc herniation [5]. These inflammatory factors travel into the fission of the end plate or the outer third of the annular fibrosus, stimulate pain receptors (free nerve endings), and cause pain (Figure 1). Therefore, DLBP requires two factors to induce pain: the existence of free nerve endings, namely pain receptors, and inflammation. There is a high density of nerves and blood vessels in the outer third of the annulus and end plate area, which is likely the site where pain is produced. As mentioned, a large number of inflammatory factors are produced by the cells of the nucleus, which act on pain receptors to produce pain. Thus, the inflammatory response is the main pathophysiologic cause of DLBP.
The pathogenesis of discogenic lower back pain
Clinical diagnosis
Only a small proportion (approximately 20%) of LBP cases can be attributed with reasonable certainty to a pathologic or anatomical entity. Thus, diagnosing the cause of LBP represents the biggest challenge for doctors in this field. Persistent LBP treatments are often unsatisfactory due to the lack of a precise diagnosis. At present, the following methods are used to identify the cause of LBP.
Centralization phenomenon (CP) and bony vibration test (BVT)
Because most of the signs and symptoms of DLBP are not specific and are difficult to distinguish from the other diseases that exhibit LBP, the pain centralization and the shock-induced bone pain methods can be used to determine a diagnosis. Mckenzie in 1981 first described the centralization phenomenon, which consists of pain in the central line of the spine upon lateral movement. This is also known as the Mckenzie assessment, suggesting that the LBP originates in the disc. Later, Wetzel [6] researched the mechanism of the CP and showed that Spinal movements may return the displaced or removed nucleus to its normal position along the crack of the disc, resulting in pain along the central line of the spine. Donelson et al. [7] found that the presence of the CP had a sensitivity of 64% and specificity of 70% for DLBP, suggesting that the CP could be a diagnostic indicator of DLBP [8]. Young et al. [9] indicated a specificity of 100%, an odds ratio (OR) of 2.13, and a confidence interval (CI) of 1.28 ~ 3.52. In a recent study [10], the CP observed in discographies of patients with severe disabilities was 97% specific to DLBP, supporting the above findings. Furthermore, the CP may be a good predictor for chronic LBP relief with surgery [11] because patients with the CP had an increased level of satisfaction with surgery, had more pain relief, and returned to work faster than patients with no CP [12,13]. However, most people believe that the role of the CP in the diagnosis of DLBP is limited, not only because of its relatively low sensitivity and specificity, but also because of a lack of a uniform standard of identifying patients with the CP. Furthermore, some patients cannot finish spinal assessments, so the CP has a narrower than desired scope of clinical application as a diagnostic indicator.
BVT, which is the application of blunt electric vibrators to the spinous processes of vertebrae, which provokes pain originating from the disc, is considered by some to be a fast, safe and effective test for DLBP [14]. Yrjama and Vanharanta [15] first introduced BVT in 1994. In their analysis of 57 patients with chronic LBP, they found a high correlation between BVT and positive discography, with a sensitivity and specificity of 71% and 63%, respectively. These values rose to 96% and 72% when patients who previously received spinal surgery or had a herniated disc were excluded. Yrjama and Vanharant then conducted two additional experiments using BVT in combination with other imaging modalities [16,17]. The combination of BVT with ultrasound imaging was 90% sensitive and 75% specific for the diagnosis of DLBP. BVT in combination with MRI was found to be 88% sensitive and 75% specific. However, Steven et al. [14] commented that the accuracy of the Yrjama study was lacking because it included patients with radiculitis and did not show that BVT could substitute for discography. Thus, most researchers believe that BVT and the CP are of little utility and cannot effectively distinguish DLBP from other chronic LBP diseases.
Magnetic resonance imaging (MRI)
The most commonly used method for diagnosing DLBP is non-invasive MRI technology. An MRI of DLBP shows low signal intensity of the disc on T2W, a high-intensity zone (HIZ) at the rear of the disc, and end plate changes.
Low signal intensity of the disc on sagittal T2W
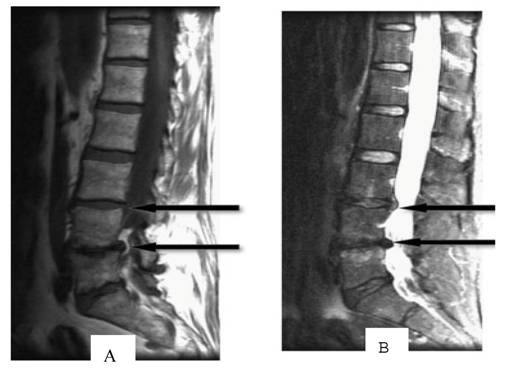
Age-related disc degeneration is associated with nucleus dehydration and matrix degradation, causing the T2W MRI signal intensity to decrease and resulting in a "black disc" (Figure 2). Studies have suggested that almost all discs showed reduced signal intensity upon sagittal T2W imaging in patients with varying degrees of disc degeneration and chronic LBP [18]. According to the extent of the reduced signal strength, Pfirrmann et al. [19] classified degeneration into five grades: I, which represents a normal disc, and II, III, IV and V, which respectively represent light to severe degeneration. However, many scholars believe that the parameter of low-signal intensity does not reflect a clear change in disc morphology and is only minimally associated with the amount of pain caused by DLBP [20-22]. In addition, in degenerative segments of lumbar vertebrae, it is not possible to distinguish which disc in the low signal intensity area has actually generated pain. In a study of healthy discs, Collins [20] found that 17% of discs had low signal intensity on T2W imaging. Therefore, low signal intensity of the disc has almost 100% sensitivity but a low specificity for DLBP; therefore, it is not suitable as a diagnostic tool.
T1 (A)- and T2 (B)-weighted MRI images of the spine show intervertebral disc signal intensity variations. Arrows point to pathological features (Adopted from Majumdar [18]).
High-intensity zone (HIZ)
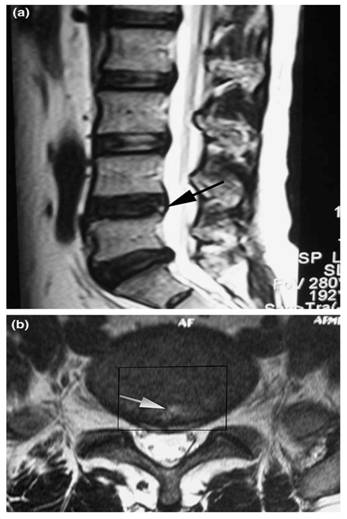
In 1992, Aprill and Bogduk [23] first described what is now known as the High-intensity zone (HIZ) seen on MRI of the lumbar spine. HIZ was a 'high-intensity signal' (bright white) located in the posterior annulus fibrosus. It is clearly dissociated from the signal of the nucleus pulposus in that it is surrounded superiorly, inferiorly, posteriorly and anteriorly by the low-intensity (black) signal of the annulus fibrosus and is appreciably brighter than the signal of the nucleus (Figure 3). A close association between HIZ and disc pain was observed in some studies. It is suggested that inflammation of the annular fibrosus fissure causes the HIZ to appear, and this inflammation also causes irritation of pain fibers. The presence of the HIZ has a sensitivity of 82%, a specificity of 89%, and a positive predictive value of 90% for DLBP. Other studies have indicated that the presence of the HIZ is a good indicator for DLBP. One study [24] found that HIZ had a specificity of 92.5% and a positive predictive value (PPV) of 88.9%, but a sensitivity of only 26.7% for DLBP. Another study [25] showed a sensitivity of 81%, a specificity of 79% and a PPV of 87% for HIZ as an indicator of DLBP. Peng et al. [26] found that the HIZ had a 100% sensitivity and specificity for discs classified as having a grade 3 tear according to the Dallas discogram description. However, some scholars question the utility of the presence of the HIZ because the mechanism causing it is still unproven, and the asymptomatic normal population has a high proportion of HIZ on imaging as well. Carragee et al. [27,28] found the occurrence rate of the HIZ to be 59% in patients compared to 25% in asymptomatic volunteers, and there was no relationship between the presence of the HIZ and chronic LBP. Another study of asymptomatic volunteers found the incidence of the HIZ to be 39% [29]. In a longitudinal study, Mitraet et al. [30] showed no relationship between the presence of the HIZ and both the visual analog scale (VAS) of DLBP pain intensity and the OQS score of disability. This study also determined that several factors were responsible for the high positive rate of HIZ presence on imaging; these factors included a small sample, loose exclusion standards, and research method bias. Overall, most clinicians and academicians consider the presence of the HIZ to be an indicator with a high sensitivity and low specificity.
Sagittal T2-weighted magnetic resonance image (MRI) shows a high-intensity zone (arrow) within the posterior annulus at L4-L5 (a). Axial T2-weighted MRI shows a high-intensity zone (arrow) within the posterior annulus at L4-L5 (b). The rectangle indicates the range of disc excision (PLIF procedure) that is used for histological examination (Adopted from Baogan Peng et al. [26]).
Modic changes
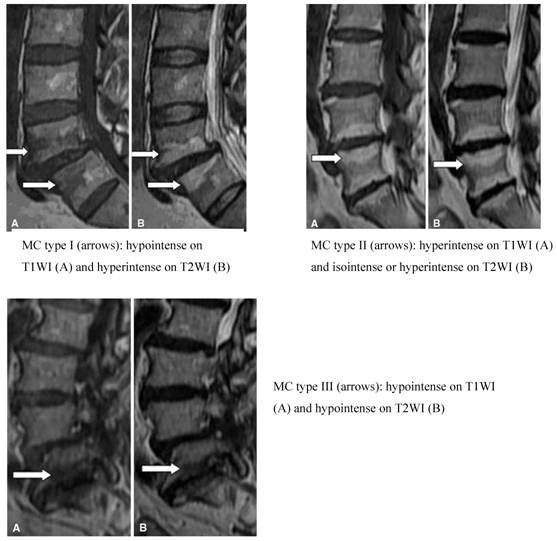
Altered signal strength is often seen in MRIs of degenerative spinal disease in the vertebral end plate and bone under the cartilage. In 1998, Modic et al. [31,32] summarized these changes into groups known as Modic Changes (MCs). The MCs classification is divided into three groups. Type I, also known as the inflammatory phase, is denoted by inflammation of fibrous tissue, low signal intensity on T1W and high signal intensity on T2W imaging. Type II, known as the fat phase, is marked by a large deposition of fat cells in the end plate and the area underneath it, as well as a high signal intensity on T1W and an equivalent or mildly high signal on T2W imaging. Type III, also known as the bone sclerosis period because the bone becomes hardened in the end plate and the area underneath it, is also characterized by low signal intensity in T1W and T2W imaging (Figure 4). Although the etiology has not been fully elucidated, MCs remains a useful parameter set for characterizing morphological changes to the disc. Studies have found that the prevalence of MCs varies from 18 to 62% in patients with chronic LBP, with different ratios relative to asymptomatic patients for each type. Specifically, MCs types I and II were highly prevalent in patients with chronic LBP [34-37] and minimally prevalent in asymptomatic volunteer patients [38,39]. Albert et al. [34] found a strong correlation between MCs and chronic LBP, specifically type I MCs, which reflected the pathological results of changes to the end plate fissure and the subsequent inflammatory response. Kjaer et al. [40,41] reached a similar conclusion in an analysis of 412 40-year old Danish patients. Later, Kuisma et al. showed that type I MCs may be more related to chronic LBP than types II and III. At present, one study has shown a clear relationship between clinical symptoms and MCs on MRI [42]. Another study [43] using discography as a reference standard found that MCs were significantly related to pain of varying consistency. Buttermann et al. [44] found that the sensitivity of MCs for the diagnosis of discogenic pain was relatively high but did not give a specific value. In short, studies have found a close relationship between MC, the pain of DLBP and positive results with discography. The MC parameter has a high sensitivity but slightly lower specificity as an indicator of DLBP.
MC classification (Adopted from Yue-Hui Zhang et al. [33])
Discography
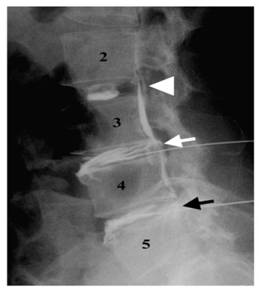
Discography, first reported in 1948 by Lindblom [45] and Hirsch [46], was initially used to diagnose diseases caused by disc damage and was especially useful for evaluating painful discs and making the choice of which segments to fuse intra-operatively in patients with LBP (Figure 5). Positive discography is defined as follows: 1) abnormal morphology of the examined disc; 2) consistency of pain by provocation; 3) no pain experienced by provocation of the nearest disc; and 4) less than 3 mL of injected contrast agent. [48] Because discography can show shape changes similar to non-invasive imaging (such as MRI), it can be used to locate the disc causing pain and determine the nature of the pain through pain provocation, the North American Spine Society made discography the diagnostic gold standard for DLBP in 1988. Many reports verified the clinical value of discography for the diagnosis of DLBP. For example, Walsh et al. [49] found the false positive rate of discography to be zero, with a specificity of 100%. In a study of the relationship between DLBP and the degree of disc degeneration, Peng et al. [26] found a clear relationship between DLBP and the Dallas discogram description grade. Almost all patients with a grade 3 tear according to the Dallas discogram description experienced pain. The development of new experimental methodologies and imaging technologies has included strict inclusion and exclusion standards, application of blinded studies, speed and pressure control for the injection of a contrast agent, a set definition of the degree of consistent pain and the evaluation of psychological factors in patients. For example, some recent studies have shown that if the contrast agent is injected with an opening pressure ≤ 50 psi and a speed of ≤ 0.08 ml/s, the stimulation of pain receptors was eliminated, reducing the potential confusion factor [28,50-52]. Other studies [51-53] found that the VAS score of consistent pain must be ≥ 4, or even ≥ 6, in order to reduce false positive results. Studies of the impact of psychological factors upon the diagnostic strength of discography [54] have increased its reliability and accuracy. Based on discography, some scholars have put forward discblock. [55] However, the utility of discography has been in dispute since it emerged as a diagnostic technique. The biggest flaw was that pain provocation is a subjective measure dependent on the patient, which despite quantification by the VAS, inevitably yields a high rate of false positives in patients with a psychological fear of pain or hyperesthesia from chronic pain. In a study of patients who had received surgery of the ilium and had no prior history of chronic back pain, Carragee et al. [56] found a false-positive rate for pain provocation of 50% during discography. Block et al. [57] found that patients with LBP and mental disorders are likely to have a higher false positive rate during discography as well. Ohnmeiss et al. [58] performed the Minnesota Multiphasic Personality Inventory upon patients who showed normal disc morphology on imaging but who experienced pain with provocation and found that the inventory score of these patients were significantly higher than pain free people. Furthermore, due to its invasive nature, discography has many complications, including allergic reaction to contrast agent, discitis, epidural abscesses, and acute protrusion of the intervertebral disc. Discography might help in surgical decision for level localization but is not a gold standard for diagnosing DLBP, its many problems make it an unsatisfactory technique for DLBP diagnosis.
Lateral discograms show a type 2 lobular pattern at L2-L3 (arrowhead), a type 5 ruptured pattern at L3-L4 (white arrow), and a type 4 fissured pattern at L4-L5 (black arrow). The patient was painless at L2-L3 and had concordant pain at L3-L4 and L4-L5 during discography. (Adopted from Chae-Hun Lim, et al. [47]).
Ultrasound imaging of intervertebral discs
Compared to photo imaging, ultrasound imaging is more sensitive to changes in the structure of soft tissue, and the use of ultrasound imaging can detect the specific site of a lesion by noting sites of changed density. Ultrasound imaging reveals detailed information regarding changes to the structure of the disc, especially the location and extent of fissures of the annular fibrosus, and, therefore, has a certain value for the diagnosis of discogenic LBP. Naish et al. [59] studied ultrasound imaging of dog intervertebral discs in vitro by dividing intact discs into three parts: the front annular fibrosus, the nucleus pulposus, and the rear annular fibrosus. Each segment was imaged, and Cronbach statistics were calculated. This study found imaging of each segment to be highly credible, with Cronbach values of 0.924, 0.821 and 0.882 for each respective segment. Thus, Naish and colleagues concluded that ultrasound imaging could measure the extent of disc degeneration and pathological position of disc diseases. As mentioned previously, Yrjama et al. [16] studied the combination of ultrasound imaging and vibration pain provocation compared with discography for the diagnosis of internal annular fissures of the lumbar spine, finding a 90% sensitivity and 75% specificity for the combination. This study concluded that the combination of these two non-invasive methods to accurately determine the source of pain from a torn disc could be a useful screening tool for the assessment of DLBP. Unfortunately, limited research about the utility of disc ultrasound caused many people to not understand its true clinical role. It is specifically useful for the detection of local lesions of the disc in DLBP.
High-sensitivity C-reactive protein
High-sensitivity C-reactive protein (hsCRP) is a sensitive systemic marker of low-grade inflammatory disease. IL-6, an inflammatory mediator, is the major up-regulator of hsCRP gene expression and causes elevated serum levels of hsCRP. Patients with chronic LBP due to structural damage of a disc have higher circulating levels of a number of inflammatory factors, such as IL-6 and IL-8, as well as elevated levels of hsCRP [3]. A correlation exists between the serum level of hsCRP and degree of LBP; therefore, hsCRP can be used to diagnose DLBP. A recent analysis [60] of the relationship between hsCRP and chronic LBP divided 36 patients with chronic LBP into three groups: MC 0, MC I and MC II, according to the MCs on MRI, and analyzed clinical data as well as serum hsCRP levels. Francois R, et al. found that serum hsCRP levels in the MC I group were significantly higher than the other two groups. Furthermore, they found that the MC I group experienced pain the most in the morning. This study concluded that hsCRP could be used to help clinicians diagnose chronic LBP. This conclusion was not without controversy, however. Sturmer et al. [61] found no clear relationship between hsCRP level and level of pain. In a prospective study, Gebhardt et al. [62] found that hsCRP level was not correlated with either level of pain or somatic function in patients with chronic LBP. Therefore, the utility of hsCRP as a marker for DLBP is uncertain, but it represents the first attempt at using a serologic marker to diagnose this condition.
Characteristics of articles reviewed for clinical diagnosis of DLBP
| Study/ Year | Number of patients | Type of study | Diagnostic indices | Sensitivity | Specificity |
|---|---|---|---|---|---|
| Donelson R et al. [7] 1997 | 63 | P; C | CP | 64% | 70% |
| Young S et al. [9] 2003 | 81 | P | CP | 47% | 100% |
| Laslett M et al. [10] 2005 | 107 | P; B | CP | 40% | 97% |
| Long A et al. [11] 1995 | 243 | P | CP | a higher return-to-work rate, 68%VS52% | |
| Karas R et al. [12] 1997 | 126 | P | CP | a higher return-to-work rate | |
| Werneke M et al. [13] 2001 | 223 | P | CP | a higher return-to-work rate | |
| Yrjama et al. [15] 1994 | 57 | P | BVT | 71% | 63% |
| Yrjama M et al. [17] 1997 | 33 | P | BVT&MRI | 88% | 75% |
| Collins C et al. [20] 2005 | 29 | P | Dark disc | 100% | 0% |
| Weishaupt D et al. [21] 2001 | 50 | P; C | Dark disc | 98% | 59% |
| Weishaupt D et al. [21] 2001 | 50 | P; C | HIZ | 27% | 85% |
| Aprill C et al. [23] 1992 | 500 | P | HIZ | 82% | 89% |
| Saifuddin et al. [24] 1998 | 58 | P | HIZ | 26.7% | 92.5% |
| Lam KS et al. [25] 2000 | 73 | P; B | HIZ | 81% | 79% |
| Baogan Peng et al. [26] 2006 | 52 | P | HIZ | 100% | 100% |
| Carragee E et al. [27] 2000 | 54 (asymptomatic) | P; C | HIZ | 24% | 16% |
| Mitra D et al. [30] 2004 | 56 | R | HIZ | 58% | U |
| Albert H et al. [34] 2007 | 181 | RA; C | MC | 60% | U |
| Karchevsky M et al. [35] 2005 | 106 | P | MC | 58% | U |
| Kleinstuck F et al. [36] 2006 | 53 | P | MC | 62% | U |
| Mitra D et al. [37] 2004 | 670 | P | MC | strong correlation with symptoms | |
| Chung C et al. [38] 2004 | 59 (asymptomatic) | P | MC | 25.4% | U |
| Weishaupt D et al. [39] 1998 | 60 (asymptomatic) | P | MC | 10% | U |
| Kjaer P et al. [41] 2005 | 412 (asymptomatic) | P | MC | 25% | U |
| Braithwaite I et al. [43] 1998 | 58 | P; C | MC | 23.3% | 96.8% |
| Weishaupt D et al. [21] 2001 | 50 | P; C | Discography | 38% | 100% |
| Chae-Hun Lim et al. [47] 2005 | 57 | P; C | Discography | 57% | 97% |
| Derby R et al. [51] 2005 | 13 | P | Discography | 44% | 90% |
| Derby R et al. [52] 2005 | 86 | P | Discography | U | 94.6% |
| Derby R et al. [53] 2005 | 106 | P; C | Discography | U | 70.6% |
| Franc O et al. [61] 2007 | 36 | P | hsCRP | correlated with MC I signal changes | |
| Sturmer T et al. [61] 2005 | 72 | P | hsCRP | correlated with acute lumbosciatic pain | |
| Gebhardt K et al. [62] 2006 | 72 | P | hsCRP | correlated with acute lumbosciatic pain | |
P=prospective; R=retrospective; C=controlled; RA=randomized; B=blinded; U=unknown
Serodiagnosis
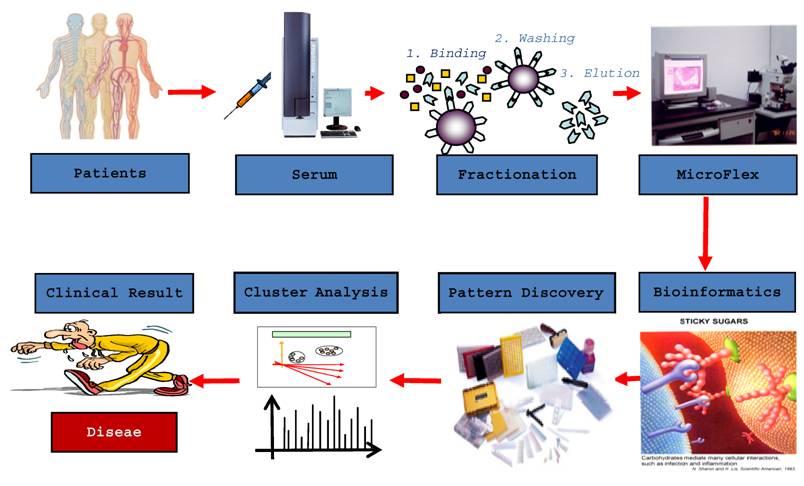
The most important features for a diagnostic test are accuracy, safety and repeatability. The accuracy of a diagnostic test is reflected by its sensitivity and specificity. Incidence of false positives is reflected by a lower specificity, and the incidence of false negatives is reflected by a lower sensitivity. Unfortunately, all currently existing diagnostic methods for DLBP are not ideal in that they lack accuracy; therefore, a more accurate and reliable method of diagnosis is required. With the completion of the human genome project, scientists have realized that proteins are the major executor of physiological functions. Research has often focused on a single protein, but with modern technology, analysis of multiple proteins at the same time is now possible through proteomics. Proteomics is defined as the functional study of a group of proteins to clarify their expression, function and interactions in order to understand their role in organisms and cells. In recent years, proteomics research has undergone unprecedented development, resulting in a large number of available methods to apply to clinical research. This development has enabled in-depth searches for complex disease biomarkers [63,64]. Biomarkers offer superior methods for the diagnosis of disease as well as monitoring of therapy. Proteomics enables analysis of serum proteins, which are an important element of blood that play an important role in regulating the stability of blood, transport of materials, and coordinate the immune response. During the pathogenesis, progression and treatment of a disease, proteins from damaged cells can enter the bloodstream, altering the spectrum of proteins in blood. Certain serum proteins can serve as diagnostic markers of the disease that caused their release from cells [65]. For example, a myocardial infarction causes injury or death to myocardial cells, which then release creatine kinase into the blood. Increased levels of this protein are used to diagnose the occurrence of a myocardial infarction. Thus, clinical analysis of serum has become incredibly important in healthcare. Recognizing the significance of serum proteins, the International Human Proteomic Organization launched the Human Plasma Proteome Project (HPPP) in 2002. The scientific objectives of the HPPP include a comprehensive analysis of plasma proteins to understand ethnic differences in serum protein levels, as well as reveal protein level differences that denote various physiological and pathological conditions [66]. Most serum proteins, including disease biomarkers, are often present in small amounts that are difficult to detect using proteomic analysis of a small number of samples. Understanding how to capture low-abundance proteins is critical to facilitating the diagnosis of disease. Rapid developments in experimental biology, including liquid protein fingerprinting (Figure 6), which combines MALDI-TOF-MS with nano-magnetic microspheres, have enabled the acquisition of hydrophobic low-abundance proteins of low molecular weight. This technique will allow discovery of better biomarkers of disease that will be reliable and accurate.
At present, there is still no ideal diagnostic method for DLBP in clinical practice, prompting many academicians and clinicians to search for an accurate and reliable method of diagnosis. Based on proteomics strategies that are already in use in a number of complex diseases, such as cancer, liver disease and asthma, we suggest that a serum biomarker might exist for the accurate and reliable diagnosis of DLBP. Disc degeneration due to biomechanical factors generates tears or disruptions in the end plate and the outermost third of the annular fibrosis, causing irritation of pain fibers by inflammatory mediators. Although blood vessels and nerve endings only exist in the end plate and the outermost third of the annular fibrosis of the disc, the progression of disc degeneration causes new blood vessels and nerve endings to grow along the fissure and even into the internal nucleus pulposus. Eventually, bands of inflammatory granulation tissue are formed. Studies have found that discs that cause pain display growth of many micro-vessels and nerve endings, and this growth represents a non-physiologic situation [67]. As a result of this increased vascularity in the pained disc, the biological and chemical changes from disc damage are leaked into the circulatory system. Furthermore, through intracellular signal transduction in response to disc stress, a variety of genes are expressed, and these proteins can be released into the circulation. We believe that serum proteomics can detect the release of these released factors from damaged disc cells, reflecting the pathological changes of DLBP. Our group plans to conduct a proteomic analysis of the serum of patients with DLBP to identify candidate proteins that may be serum biomarkers of the disease. The plan will divide into four groups: lumbar disc herniation group, discogenic low back pain group, the non-discogenic chronic low back pain group, the control group without low back pain. Our aim is to prove whether there are differences among the four groups serum protein profiling, whether there is a common expression between intervertebral disc herniation group and discogenic low back pain group, so as to clarify the pathogenesis of discogenic low back pain and improve the diagnostic level.
CLINPROT: biomarker profiling
DLBP is a multi-factorial and complex disease. Identified specific serum markers of DLBP can be used as a diagnostic method for the disease. These serum markers represent the likely best clinical method for diagnosis for multiple reasons. First, harvesting serum is a simple, convenient and safe procedure. Second, serum biomarkers tend to have a high sensitivity and specificity. Third, biomarker analysis is easy to standardize and reproduce. Serum proteomics research may also contribute to the understanding of the pathogenesis of DLBP at the molecular level and result in a satisfactory treatment method.
Diagnosis of a disease is often conducted by analysis of symptoms combined with physical examination, imaging studies and laboratory tests. Physical examination detects disease-induced dysfunction, imaging detects foci of tissue damage, and laboratory tests are often an indirect reflection of tissue damage. The diagnosis of DLBP remains an intractable problem, despite the gold standard of discography in current clinical practice. Undoubtedly, researchers will continue to pursue diagnostic methods that are convenient and economically feasible yet are highly specific and sensitive. Serum-based diagnostic methods may represent the next direction in diagnostic method research for DLBP.
Acknowledgements
We are grateful for the support from The Natural Scientific Fund of China (No. No.30400163) and The Clinical Researched Fund of First Affiliated Hospital of Medical College of Xi'an Jiaotong University.
Conflict of Interest
The authors have declared that no conflict of interest exists.
References
1. Zhang YG, Sun ZM, Liu JT, Wang SJ, Ren FL, Guo X. Features of intervertebral disc degeneration in rat's aging process. J Zhejiang Univ Sci B. 2009;10:522-527
2. Sun ZM, Miao L, Zhang YG, Ming L. Association between the -1562 C/T polymorphism of matrix metal proteinase-9 gene and lumbar disc disease in the young adult population in North China. Connect Tissue Res. 2009;50:181-185
3. Zhang Y, Sun Z, Liu J, Guo X. Advances in susceptibility genetics of intervertebral degenerative disc disease. Int J Biol Sci. 2008;4:283-290
4. Anderson D, Tannoury C. Molecular pathogenic factors in symptomatic disc degeneration. Spine J. 2005;5:260S-266S
5. Burke JG, Watson RW, McCormack D, Dowling FE, Walsh MG, Fitzpatrick JM. Intervertebral discs which cause low back pain secrete high levels of proinflammatory mediators. J Bone Joint Surg Br. 2002;84:196-201
6. Wetzel FT, Donelson R. The role of repeated end-range/pain response assessment in the management of symptomatic lumbar discs. Spine J. 2003;3:146-154
7. Donelson R, Aprill C, Medcalf R, Grant W. A prospective study of centralization of lumbar and referred pain. A predictor of symptomatic discs and anular competence. Spine (Phila Pa 1976). 1997;22:1115-1122
8. Berthelot JM, Delecrin J, Maugars Y, Passuti N. Contribution of centralization phenomenon to the diagnosis, prognosis, and treatment of diskogenic low back pain. Joint Bone Spine. 2007;74:319-323
9. Young S, Aprill C, Laslett M. Correlation of clinical examination characteristics with three sources of chronic low back pain. Spine J. 2003;3:460-465
10. Laslett M, Oberg B, Aprill CN, McDonald B. Centralization as a predictor of provocation discography results in chronic low back pain, and the influence of disability and distress on diagnostic power. Spine J. 2005;5:370-380
11. Long AL. The centralization phenomenon: its usefulness as a predictor of outcome in conservative treatment of chronic low back pain (a pilot study). Spine (Phila Pa 1976). 1995;20:2513-2520
12. Karas R, McIntosh G, Hall H, Wilson L, Melles T. The relationship between nonorganic signs and centralization of symptoms in the prediction of return to work for patients with low back pain. Phys Ther. 1997;77:354-360
13. Werneke M, Hart DL. Centralization phenomenon as a prognostic factor for chronic low back pain and disability. Spine (Phila Pa 1976). 2001;26:758-764
14. Cohen SP, Larkin TM, Barna SA, Palmer WE, Hecht AC, Stojanovic MP. Lumbar discography: a comprehensive review of outcome studies, diagnostic accuracy, and principles. Reg Anesth Pain Med. 2005;30:163-183
15. Yrjämä M, Vanharanta H. Bony vibration stimulation: A new, non-invasive method for examining intradiscal pain. Eur Spine. 1994;3:233-235
16. Yrjämä M, Tervonen O, Vanharanta H. Ultrasonic imaging of lumber discs combined with vibration pain provocation compared with discography in the diagnosis of internal anular fissures of the lumbar spine. Spine (Phila Pa 1976). 1996;21:571-575
17. Yrjämä M, Tervonen O, Kurunlahti M, Vanharanta H. Bony vibration stimulation test combined with magnetic resonance imaging. Can discography be replaced?. Spine(Phila Pa 1976). 1997;22:808-813
18. Pearce RH, Thompson JP, Bebault GM, Flak B. Magnetic resonance imaging reflects the chemical changes of aging degeneration in the human intervertebral disk. J Rheumatol Suppl. 1991;27:42-43
19. Pfirrmann CW, Metzdorf A, Zanetti M, Hodler J, Boos N. Magnetic resonance classification of lumbar intervertebral disc degeneration. Spine (Phila Pa 1976). 2001;26:1873-1878
20. Collins CD, Stack JP, O'Connell DJ, Walsh M, McManus FP, Redmond OM, Ennis JT. The role of discography in lumbar disc disease: a comparative study of magnetic resonance imaging and discography. Clin Radiol. 1990;4:252-257
21. Weishaupt D, Zanetti M, Hodler J, Min K, Fuchs B, Pfirrmann CW, Boos N. Painful lumbar disk derangement: relevance of endplate abnormalities at MR imaging. Radiology. 2001;218:420-427
22. Kluner C, Kivelitz D, Rogalla P, Putzier M, Hamm B, Enzweiler C. Percutaneous discography: comparison of low-dose CT, fluoroscopy and MRI in the diagnosis of lumbar disc disruption. Eur Spine. 2006;15:620-626
23. Aprill C, Bogduk N. High-Intensity zone: a diagnostic sign of painful lumbar disc on magnetic resonance imaging. Br J Radiol. 1992;773:361-369
24. Saifuddin A, Braithwaite I, White J, Taylor BA, Renton P. The value of lumbar spine magnetic resonance imaging in the demonstration of annular tears. Spine. 1998;23:453-457
25. Lam KS, Carlin D, Mulholland RC. Lumbar disc high-intensity zone: the value and significance of provocative discography in the determination of the discogenic pain source. Eur Spine. 2000;9:36-41
26. Peng B, Hou S, Wu W, Zhang C, Yang Y. The pathogenesis and clinical significance of a high-intensity zone (HIZ) of lumbar intervertebral disc on MR imaging in the patient with discogenic low back pain. Eur Spine. 2006;15:583-587
27. Carragee E, Paragioudakis SJ, Khurana S. 2000 Volvo Award winner in clinical studies: Lumbar high-intensity zone and discography in subjects without low back problems. Spine (Phila Pa 1976). 2000;25:2987-2992
28. Carragee EJ, Lincoln T, Parmar VS, Alamin T. A gold standard evaluation of the "discogenic pain" diagnosis as determined by provocative discography. Spine (Phila Pa 1976). 2006;31:2115-2123
29. Boden SD, McCowin PR, Davis DO, Dina TS, Mark AS, Wiesel S. Abnormal magnetic-resonance scans of the lumbar spine in asymptomatic subjects. A prospective investigation. J Bone Joint Surg Am. 1990;72:403-408
30. Mitra D, Cassar-Pullicino VN, McCall IW. Longitudinal study of high intensity zones on MR of lumbar intervertebral discs. Clinical Radiology. 2004;59:1002-1008
31. Modic MT, Masaryk TJ, Ross JS, Carter JR. Imaging of degenerative disk disease. Radiology. 1988;168:177-186
32. Modic MT, Steinberg PM, Ross JS, Masaryk TJ, Carter JR. Degenerative disk disease: assessment of changes in vertebral body marrow with MR imaging. Radiology. 1988;166:193-199
33. Zhang YH, Zhao CQ, Jiang LS, Chen XD, Dai LY. Modic changes: a systematic review of the literature. Eur Spine J. 2008;17:1289-1299
34. Albert HB, Manniche C. Modic changes following lumbar disc herniation. Eur Spine. 2007;16:977-982
35. Karchevsky M, Schweitzer ME, Carrino JA, Zoga A, Montgomery D, Parker L. Reactive endplate marrow changes: asystematic morphologic and epidemiologic evaluation. Skeletal Radiol. 2005;34:125-129
36. Kleinstück F, Dvorak J, Mannion AF. Are “structural abnormalities” on magnetic resonance imaging a contraindication to the successful conservative treatment of chronic nonspecific low back pain?. Spine (Phila Pa 1976). 2006;31:2250-2257
37. Mitra D, Cassar-Pullicino VN, McCall IW. Longitudinal study of vertebral type-1 end-plate changes on MR of the lumbar spine. Eur Radiol. 2004;14:1574-1581
38. Chung CB, Vande Berg BC, Tavernier T, Cotten A, Laredo JD, Vallee C, Malghem J. Endplate marrow changes in the asymptomatic lumbosacral spine: frequency, distribution and correlation with age and degenerative changes. Skeletal Radiol. 2004;33:399-404
39. Weishaupt D, Zanetti M, Hodler J, Boos N. MR imaging of the lumbar spine: prevalence of intervertebral disk extrusion and sequestration, nerve root compression, end plate abnormalities,and osteoarthritis of the facet joints in asymptomatic volunteers. Radiology. 1998;209:661-666
40. Kjaer P, Korsholm L, Bendix T, Sorensen JS, Leboeuf-Yde C. Modic changes and their associations with clinical findings. Eur Spine. 2006;15:1312-1319
41. Kjaer P, Leboeuf-Yde C, Korsholm L, Sorensen JS, Bendix T. Magnetic resonance imaging and low back pain in adults: a diagnostic imaging study of 40-year-old men and women. Spine. 2005;30:1173-80
42. Marshman LA, Trewhella M, Friesem T, Bhatia CK, Krishna M. Reverse transformation of Modic type 2 changes to Modic type 1 changes during sustained chronic low-back pain severity. Report of two cases and review of the literature. J Neurosurg Spine. 2007;6:152-155
43. Braithwaite I, White J, Saifuddin A, Renton P, Taylor BA. Vertebral end-plate (Modic) changes on lumbar spine MRI: correlation with pain reproduction at lumbar discography. Eur Spine. 1998;7:363-368
44. Buttermann GR. The effect of spinal steroid injections for degenerative disc disease. Spine J. 2004;4:495-505
45. Lindblom K. Diagnostic puncture of the intervertebral discs in sciatica. Acta Orthop Scand. 1948;17:231-239
46. Hirsch C. An attempt to diagnose level of disc lesion clinically by disc puncture. Acta Orthop Scand. 1948;18:132-140
47. Lim CH, Jee WH, Son BC, Kim DH, Ha KY, Park CK. Discogenic lumbar pain: association with MR imaging and CT discography. Eur J Radiol. 2005;54:431-437
48. Saboeiro GR. Lumbar discography. Radiol Clin North Am. 2009;47(3):421-33
49. Walsh TR, Weinstein JN, Spratt KF, Lehmann TR, Aprill C, Sayre H. Lumbar discography in normal subjects. A controlled, prospective study. J Bone Joint Surg Am. 1990;72:1081-1088
50. Seo KS, Derby R, Date ES, Lee SH, Kim BJ, Lee CH. In vitro measurement of pressure differences using manometry at various injection speeds during discography. Spine J. 2007;7:68-73
51. Derby R, Lee SH, Kim BJ, Chen Y, Aprill C, Bogduk N. Pressure-controlled lumbar discography in volunteers with low back pain symptoms. Pain Med. 2005;6:213-221
52. Derby R, Kim BJ, Chen Y, Seo KS, Lee SH. The relation between annular disruption on computed tomography scan and pressure-controlled diskography. Arch Phys Med Rehabil. 2005;86:1534-1538
53. Derby R, Kim BJ, Lee SH, Chen Y, Seo KS, Aprill C. Comparison of discographic findings in asymptomatic subject discs and negative discs of chronic LBP patients: Can discography distinguish asymptomatic discs among morphologically abnormal discs?. Spine J. 2005;5:389-394
54. Wasan AD, Kaptchuk TJ, Davar G, Jamison RN. The association between psychopathology and placebo analgesia in patients with discogenic low back pain. Pain Med. 2006;3:217-228
55. Ohtori S, Kinoshita T, Yamashita M, Inoue G, Yamauchi K, Koshi T, Suzuki M, Orita S, Eguchi Y, Nakamura S, Yamagata M, Takaso M, Ochiai N, Kishida S, Aoki Y, Takahashi K. Results of surgery for discogenic low back pain: a randomized study using discography versus discoblock for diagnosis. Spine (Phila Pa 1976). 2009;34(13):1345-8
56. Carragee EJ, Tanner CM, Yang B, Brito JL, Truong T. False-positive findings on lumbar discography. Reliability of subjective concordance assessment during provocative disc injection. Spine (Phila Pa 1976). 1999;24:2542-2547
57. Block AR, Vanharanta H, Ohnmeiss DD, Guyer RD. Discographic pain report. Influence of psychological factors. Spine (Phila Pa 1976). 1996;21:334-338
58. Ohnmeiss DD, Vanharanta H, Guyer RD. The association between pain drawings and computed tomographic/discographic pain responses. Spine (Phila Pa 1976). 1995;20:729-733
59. Naish C, Mitchell R, Innes J, Halliwell M, McNally D. Ultrasound imaging of the intervertebral disc. Spine (Phila Pa 1976). 2003;28:107-113
60. Rannou F, Ouanes W, Boutron I, Lovisi B, Fayad F, Macé Y, Borderie D, Guerini H, Poiraudeau S, Revel M. High-sensitivity C-reactive protein in chronic low back pain with vertebral end-plate Modic signal changes. Arthritis Rheum. 2007;57(7):1311-5
61. Stürmer T, Raum E, Buchner M, Gebhardt K, Schiltenwolf M, Richter W, Brenner H. Pain and high sensitivity C-reactive protein in patients with chronic low back pain and acute sciatic pain. Ann Rheum Dis. 2005;64:921-925
62. Gebhardt K, Brenner H, Stürmer T, Raum E, Richter W, Schiltenwolf M, Buchner M. The course of high-sensitive C-reactive protein in correlation with pain and clinical function in patients with acute lumbosciatic pain and chronic low back pain: a 6 months prospective longitudinal study. Eur J Pain. 2006;10:711-719
63. Choi J, Malakowsky CA, Talent JM, Conrad CC, Gracy RW. Identification of oxidized plasma proteins in Alzheimer's disease. Biochem Biophys Res Commun. 2002;293:1566-1570
64. Hayman MW, Przyborski SA. Proteomic identification of biomarkers expressed by human pluripotent stem cells. Biochem Biophys Res Commun. 2004;316:918-923
65. Andersom NL, Anderson NG. The human p lasma p roteome: history, character, and diagnostic prospects. Mol Cell Proteomics. 2002;1:845-867
66. Omenn GS, States DJ, Adamski M, Blackwell TW, Menon R, Hermjakob H, Apweiler R, Haab BB, Simpson RJ, Eddes JS, Kapp EA, Moritz RL, Chan DW, Rai AJ, Admon A, Aebersold R, Eng J, Hancock WS, Hefta SA, Meyer H, Paik YK, Yoo JS, Ping P, Pounds J, Adkins J, Qian X, Wang R, Wasinger V, Wu CY, Zhao X, Zeng R, Archakov A, Tsugita A, Beer I, Pandey A, Pisano M, Andrews P, Tammen H, Speicher DW, Hanash SM. Overview of the HUPO plasma proteome project: results from the pilot phase with 35 collaborating laboratories and multiple analytical groups, generating acore datasets of 3020 proteins and a publicly-available database. Proteomics. 2005;5:3226-3245
67. Podichetty VK. The aging spine: the role of inflammatory mediators in intervertebral disc degeneration. Cell Mol Biol (Noisy-le-grand). 2007;53:4-18
Author contact
![]() Correspondence to: Dr. Yin'gang Zhang, Department of Orthopaedics of the First Affiliated Hospital, Medical College of Xi'an Jiaotong University, Xi'an, 710061, China, E-mail: zyingangxjtu.edu.cn, Tel: +86-029-85323935
Correspondence to: Dr. Yin'gang Zhang, Department of Orthopaedics of the First Affiliated Hospital, Medical College of Xi'an Jiaotong University, Xi'an, 710061, China, E-mail: zyingangxjtu.edu.cn, Tel: +86-029-85323935
Received 2009-8-20
Accepted 2009-10-9
Published 2009-10-13