Impact Factor ISSN: 1449-2288

 Global reach, higher impact
Int J Biol Sci 2013; 9(1):22-33. doi:10.7150/ijbs.5371 This issue Cite
Research Paper
A Simple Method for Predicting Transmembrane Proteins Based on Wavelet Transform
Bin Yu1 ![]() , Yan Zhang2
, Yan Zhang2
1. College of Mathematics and Physics, Qingdao University of Science and Technology; Qingdao, Shandong, China;
2. College of Electromechanical Engineering, Qingdao University of Science and Technology; Qingdao, Shandong, China.
Received 2012-10-11; Accepted 2012-12-2; Published 2012-12-19
Abstract
The increasing protein sequences from the genome project require theoretical methods to predict transmembrane helical segments (TMHs). So far, several prediction methods have been reported, but there are some deficiencies in prediction accuracy and adaptability in these methods. In this paper, a method based on discrete wavelet transform (DWT) has been developed to predict the number and location of TMHs in membrane proteins. PDB coded as 1KQG is chosen as an example to describe the prediction process by this method. 80 proteins with known 3D structure from Mptopo database are chosen at random as data sets (including 325 TMHs) and 80 sequences are divided into 13 groups according to their function and type. TMHs prediction is carried out for each group of membrane protein sequences and obtain satisfactory result. To verify the feasibility of this method, 80 membrane protein sequences are treated as test sets, 308 TMHs can be predicted and the prediction accuracy is 96.3%. Compared with the main prediction results of seven popular prediction methods, the obtained results indicate that the proposed method in this paper has higher prediction accuracy.
Keywords: Membrane protein, Transmembrane helical segments, Discrete wavelet transform, Hydrophobicity.
Introduction
With the accomplishment of human genome project (HGP), post-genome era has come with the main character functional genomics and proteomics. Along with the HGP, a new subject—bioinformatics has developed. However the obtained massive biological data which is still in the rapid increase and the complexity of the life essence challenged young bioinformatics, so bioinformatics needs constant innovation and development in various aspects of technical means, methods and correlative field.
The study of structure and function of membrane protein is one important subject in bioinformatics. The knowledge of the function of membrane protein itself has been expanded enormously and deeply, and the more study of it can be used as a breakthrough of studying protein structure and function and the genetic information in DNA sequence. In order to explore the relationship between membrane protein structure and function, understand various work mechanism in membrane protein life activities, bioinformatics methods and techniques of developing the study of membrane protein are needed.
In the genome data, a large portion (about 20%-30%) of proteins in a genome encodes membrane protein [1-4], the proportion of such shows the importance of membrane protein in biology. Membrane protein, especially transmembrane proteinin has very important function in organism, such as photosynthesis, respiration, neural signaling, immune response, nutrient absorption and so on, and it is also the important drug target. Of the drug target known and being researched is about 70% of the membrane protein [5]. For example, G protein-coupled receptors (GPCRs) is a kind of transmembrane protein receptors with one article of peptide chains and seven transmembrane helical segments (TMHs), as shown in Figure 1 below. It is a kind of very important molecular receptors and the biggest transmembrane protein family in the eukaryotes [6]. GPCRs has the largest gene families coding in animal genome. The known 1% of the fruit flies genes and more than 5% of the nematode gene are responsible for coding GPCRs, and more than 1% of the gene in human genome is used to encode more than 1000 GPCRs [7].
Schematic drawing of a G protein-coupled receptor structure.
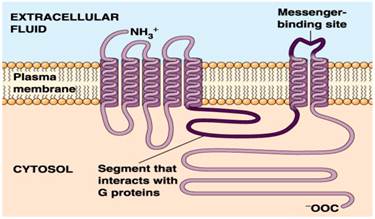
The dysfunction of GPCRs can lead to many diseases, such as Alzheimer's disease, parkinsonism syndrome, dwarfism, achromat, retinitis pigmentosa and asthma, etc. Through regulation GPCRs' signal transduction can treat depression, schizophrenia, insomnia, high blood pressure, kidney function decline, cerebrovascular disease, etc. Most of the drugs, through targeting effect on GPCRs, achieve remedial effect. Currently in the small molecule drugs market of the world, more than a third of the drug's effect targets are GPCRs [8, 9]. More than 50% of the prescription drugs take effect through GPCRs [10]. In addition to GPCRs, there are some other important transmembrane protein family, including ion channels, actin and some of the proteins related to biological energy, for example, those proteins related to electronic transport system [11].
The hydrophobic nature of membrane proteins makes it form a stable natural conformation together with biological membrane, which goes against measuring its three-dimensional (3D) structure by using X-ray crystal diffraction method and nuclear magnetic resonance (NMR) technology. Among about 56000 kinds of protein data bank (PDB), less than 1% of the protein of known structure are membrane proteins [12,13]. Until now, what we know about 3D structure of membrane proteins with high-resolution are a few, such as bacteriorhodopsin (bR), photosynthetic reaction center, cytochrome C oxidase, etc. This shows that there is a big gap between the number of the known membrane protein sequence and the known membrane protein structure, which greatly restricted the deep research of the function of membrane protein. With functional genomics and proteomics research developing, the launch of the analysis of membrane protein sequence increase rapidly, urgently needing the effective, high accuracy of the algorithm to predict the membrane protein TMHs and transmembrane direction to guide the research of membrane protein; On the other hand, through the comparison of the prediction accuracy of different algorithms, the hidden biological significance can be revealed, so as to guide the membrane protein biological experiment. Therefore, the membrane protein structure prediction, especially the prediction of transmembrane helical segments in membrane proteins has caused strong interest of the researchers.
So far many transmembrane helical segments (TMHs) predicting algorithms for membrane proteins have been proposed. In 1982 Kyte and Doolittle firstly suggested a hydrophobicity analysis method of membrane protein sequences [14]. Thereafter von Heijne put forward the well-known "positive-inside rule" to guide prediction in 1986 [15]. SOSUI [16], PRED-TMR [17] were based on the foregoing two methods. In recent years, some statistical methods have been developed that like DAS [18], TMAP [19], neural networks PHDhtm [20, 21], TMHMM [1, 22] and HMMTOP [23, 24] based on hidden Markov model, MEMSAT-SVM prediction method based on support vector machine [25, 26]. Wavelet transform was first introduced into bioinformatics research in 1996 [27] and raised extensive attention immediately [28-37]. Liò et al [29] proposed a non-parametric method based on a wavelet data-dependent threshold technique for change-point analysis which was applied to predict TMHs in membrane proteins. Continuous wavelet transform (CWT) for predicting the number and location of helices in membrane proteins is presented by Qiu et al [31]. Pashou et al [32] applied a dynamic programming algorithm on wavelet-denoised 'hydropathy' signals to determine membrane spanning segments.
In this paper, we make full use of the hydrophobicity of amino acids and multiresolution feature of discrete wavelet transform (DWT) to decompose the amino acids of TM proteins into a series of structures in different layers, then predicting the location of TMHs according to the information of the amino acids sequence in different scales. 80 proteins with known 3D structure are chosen at random as data sets. Firstly, cross-validation method is introduced and five commonly used hydrophobic parameters are used to predict the position and number of TMHs based on two different levels in order to find the best hydrophobic parameters, offer help for further membrane protein work and reduce the blindness of choosing hydrophobic parameters. Results show that the best membrane proteins TMHs is achieved when choosing FP and KD hydrophobic parameters. Secondly, take one membrane protein sequence as an example to bat around and do comparison combined with the prediction results by the other seven methods in order to confirm the effectiveness of WavePrd method. The above 80 membrane proteins are divided into 13 groups according to their function and type. The prediction of TMHs of the 13 groups by using KD hydrophobicity parameters is satisfying. 308 TMHs of 80 proteins (including 325 TMHs) can be predicted and the prediction accuracy is 96.3%. The prediction accuracy of rate of amino acid residues reaches 83.5%. Compared with the main prediction results of seven popular prediction methods, DAS [18], HMMTOP2.0 [23, 24], PHDhtm [20, 21], PRED-TMR2 [17], SOSUI [16], TMAP [19], TMHMM2.0[1, 22], the obtained results indicate that the proposed method in this paper has higher prediction accuracy.
Materials and Methods
Materials
The test dataset is retrieved from the latest MPtopo database [38], which collects a set of membrane protein structure data identified by crystallography or other experimental technologies such that they can be treated as reliable samples. One group of test data sets that contain total 80 protein sequences with known 3D structure including 325 TMHS and 19396 amino acid residues. The data can be obtained from http://blanco.biomol.uci.edu/mptopo. According to the function and type of membrane proteins, we divided 80 membrane proteins sequences into 13 groups, which are shown in Table 1.
Membrane protein families used in our predictions.
| Family name | PDB code | |||||
|---|---|---|---|---|---|---|
| ABC transporters | 1jsq | 1l7vA | 1pf4 | |||
| Bacteriorhodopsin | 1ap9 | |||||
| Channel proteins | 1fqyA | 1fx8A | 1msl | 1mxm | 1oedA | 1oedB |
| 1oedC | 1oedE | 1p7b | 1rc2A | 1rhzA | 1rhzB | |
| Cytochrome bc1 complexes | 1bgyE | 1bgyJ | 1bgyK | |||
| Cytochrome b6f complexes | 1um3A | 1um3B | 1um3D | 1um3F | 1um3G | 1um3H |
| Cytochrome c oxidases | 1ehkA | 1ehkB | 1ehkC | 1occA | 1occB | 1occC |
| 1occD | 1occG | 1occI | 1occJ | 1occK | 1occL | |
| 1occM | 1qleA | 1qleB | 1qleC | 1qleD | ||
| Glycophorin | 1afoA | |||||
| Light-harvesting complexes | 1kzuA | 1lghA | ||||
| Photosynthetic reaction centers | 1eysH | 1eysL | 1eysM | 1prcH | 1prcL | 1prcM |
| 2rcrL | 2rcrM | |||||
| Photosystems | 1jboA | 1jboB | 1jboF | 1jboI | 1jboJ | 1jboK |
| 1jboL | 1jboM | |||||
| Respiratory proteins | 1a91C | 1fftA | 1fftB | 1fftC | 1fumC | 1kqgB |
| 1kqgC | 1lovD | 1nekC | 1nekD | 1okcA | 1q16C | |
| 1qlaC | ||||||
| Rhodopsins | 1f88 | 1h2sB | 1h68A | |||
| Translocation proteins | 1pw4A | 1s7b | 2cpb | |||
Methods
As is known to all, the feature of protein structure is the balance between hydrophobic and hydrophilic and the structure stability depends heavily on molecules' hydrophobic effects [39-41]. The determination of hydrophobic value of amino acid is mainly calculated according to distribution coefficient in which various amino acid is in organic solvent and water. Due to the different laboratory test equipment, experimental conditions, organic solvents and calculation methods, hydrophobicity values obtained are also of considerable gap. So when we map the amino acid sequence of protein onto a sequence of hydrophobicity, we need to optimize a variety of different hydrophobic parameters. Here, we list five commonly used hydrophobic parameter values, as is shown in Table 2. 80 membrane protein sequence data set are used to verify their actual effect one by one, so as to find out the best hydrophobic parameters, offer help for further research work of membrane protein and reduce blindness of the selection of hydrophobic parameters.
Five different hydrophobicity values.
| Amino acids | FPa | KDb | PPc | EId | JTTe |
|---|---|---|---|---|---|
| A | 0.62 | 1.80 | 0.324 | 0.62 | 0.595 |
| C | 0.29 | 2.50 | 0.184 | 0.29 | 0.205 |
| D | -1.05 | -3.50 | -1.877 | -0.90 | -1.276 |
| E | -0.87 | -3.50 | -2.033 | -0.74 | -1.291 |
| F | 1.19 | 2.80 | 0.804 | 1.19 | 1.467 |
| G | 0.48 | -0.40 | 0.147 | 0.48 | 0.065 |
| H | -0.40 | -3.20 | -0.930 | 0.30 | -0.387 |
| I | 1.38 | 4.50 | 0.734 | 1.38 | 1.888 |
| K | -1.35 | -3.90 | -2.230 | -1.50 | -1.245 |
| L | 1.06 | 3.80 | 0.612 | 1.06 | 1.234 |
| M | 0.64 | 1.90 | 0.407 | 0.64 | 0.626 |
| N | -0.85 | -3.50 | -0.944 | -0.78 | -0.870 |
| P | 0.12 | -1.60 | -0.516 | 0.12 | -0.746 |
| Q | -0.78 | -3.50 | -1.300 | -0.85 | -0.995 |
| R | -1.37 | -4.50 | -2.085 | -2.53 | -1.073 |
| S | -0.18 | -0.80 | -0.216 | -0.18 | -0.247 |
| T | -0.05 | -0.70 | -0.129 | -0.05 | -0.154 |
| V | 1.08 | 4.20 | 0.563 | 1.08 | 1.280 |
| W | 0.81 | -0.90 | 0.582 | 0.81 | 0.891 |
| Y | 0.26 | -1.30 | 0.073 | 0.26 | 0.034 |
Method of wavelet analysis
The wavelet transform (WT) is relatively analysis methods with the changeable time-frequency window, which has very good localization properties in the time and frequency intra-areas. The discrete wavelet transform (DWT) decomposes a function into its wavelet coefficients. From a computational point of view, it proceeds by recursively applying two convolution functions, known as quadrature mirror filters, each producing an output stream that is half length of the original input, until the resolution level zero is reached. Mallat brought out the most important concept multiresolution analysis (MRA) in a discrete wavelet theory as well as fast algorithm of orthonormal wavelet tranform—Mallat algorithm[45].
Let φ(x) be a scaling function which satisfies the following two-scale equation:
(1)
Where Z is a set of integers, and the coefficients {hn, n ∈ Z} denote a low-pass filter (H). The wavelet function ψ(x) can be constructed using the scaling functionφ(x) as
(2)
where the coefficients {gn, n ∈ Z} denote a high-pass filter (G).
Assume that the shifted scaling function {φ(x-k), k ∈ Z} and the shifted wavelet functions {ψ (x-k), k ∈ Z} are orthonormal, respectively. Let {cl0} denote a sequence of hydrophobicity values, and we define a linear combination f(x) of the sequence with scaling functions {φ(x-k), k ∈ Z}:
(3)
According to a wavelet theory, we have another expansion of f(x):
(4)
From Eqs (3) and (4) and using orthonormality of the scaling and wavelet functions, we can decompose the sequence {cl0} into low frequency and high frequency components.
(5)
and
(6)
Repeatedly application of this decomposition, we can deduce
(7)
And
(8)
Conversely, we can derive a reconstruction formula form Eqs (3) and (4):
(9)
Above-mentioned formulas can refer to the literature of Mallat [45].
In Eqs. (7) and (8), the sequences {ckj+1} and {dkj+1} mean low and high frequencies. In this paper, only the first formula Eq. (9) is used because as far as most of the protein hydrophobicity signals are concerned, low frequency domain is especially important and it can reflect the general characteristics of signals. However the high frequency domain is always connected with noise and disturbance, so the basic features of signals will be reserved when the high frequency domain is discarded by putting {dkj+1} =0. Using Eq. (9), we reconstruct a new sequence  only from {ckj+1}, that is, we utilize low-pass filtering of wavelet transform. In wavelet analysis, the low frequency can be easily obtained from a raw function by the decomposition and reconstruction formula. So high frequency domain is deleted and low frequency region is left for reconstructing wavelet because we only study the general features of protein sequences. In the results, we obtain precise filtering signals that can help us to find the actual location and number of TMHs in the protein sequences.
In order to predict TMHs of membrane protein sequence, with the condition of selecting the suitable wavelet basis functions, the best scale level and threshold are particularly important. Here cross-validation method is introduced, that is, m sequences of are selected at random as training set from n membrane protein sequences, the remaining n-m sequences are treated as test set, generating a set of samples. According to this step multiple sample sets can be generated to optimize threshold. The threshold here is determined by the maximum average prediction accuracy of training set. Using this threshold, we are able to predict TMHs among membrane protein sequences from test set. Then we experiment at five different scale levels utilizing Mallat algorithm using cross-validation method.
Its realization procedure is as follows:
Step 1 According to their own hydrophobic amino acid value, map 80 amino acid sequence of membrane protein into a sequence of hydrophobicity value.
Step 2 Six-fold cross-validation method is introduced, namely, 50 sequences are chosen at random as the training set from 80 sequences, the rest 30 sequences as test set, generating a set of samples, according to this step, six groups of random samples are generated altogether.
Step 3 According to the data of training set, analyze and determine wavelet function.
Step 4 Decompose the original signal into low frequency domain and high frequency domain by using the Eqs. (7) and (8), then reconstruct wavelet to restore the original signal by using the Eqs. (9). Putting dkj+1=0, reconstruct a new sequence  by using {ckj+1}.
Step 5 In order to achieve higher prediction accuracy, according to the average length and inherent characteristics of biochemistry of each TMH, the post-treatment can be generalized in the following steps:Step 5.1 Discard those predicted TMHs that have less than 7 amino acid residues.
Step 5.2 If the predicted TMHs is between 30 and 50 residues, which means the TMHs is too long and is not factual, then the TMHs is expanded 10 amino acid residues from the two sides respectively and further we cut this TMHs into two equal parts to seek for potential TMHs.
Step 5.3 If the length of the predicted TMHs is greater than 50 residues, then the TMHs is cut into three equal parts using the same method above.
Step 6 According to step 3 to 5, learn samples of the training set, and finally determine the optimal wavelet basis, scale level and optimal threshold value.
Step 7 Get prediction result by predicting samples of the test set, and do statistics and analysis of the precision of prediction compared with experimental data.
For convenience, our prediction method is called WavePrd. We have implemented it in MATLAB 7.1 in windows XP running on a PC with system configuration Intel Pentium(R) Dual-Core processor (2.60 GHz) with 4 GB of RAM.
Selection of evaluation index
In order to test the accuracy of prediction methods, we study TM proteins from two aspects—TMHs and amino acid residues [33].
Because of the restriction of experimental condition and other extra conditions, we believe that the predicted TMHs are regarded as correct when over half of the predicted TMHs coincide with the observed TMHs. From the view of statistics, the average length of TMHs is 20 a.a. In our approach, we decide that predicted TMHs are correct when at least 9 continuous residues are contained in the observed TMHs. There are two important evaluation indexes: (1) Prediction accuracy of TMHs [23]: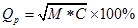 , here M=Ncor/Nobs (Ncor stands for the number of correctly predicted TMHs, Nobs stands for the number of observed TMHs), M can be regard as a measure index of sensitivity; C=Ncor/Nprd (Nprd stands for the total number of predicted TMHs), C is regarded as a measure index of specificity. (2) Prediction accuracy of residues is another evaluation index. The calculation fomula is FAAcor=(NAAcor/NAAall) × 100%, where NAAcor is the number of correctly predicted TMHs residues and NAAall is the total residues.
Results and Discussion
Through the analysis of the sample data of the training set, combined with a wavelet function main properties and five commonly used hydrophobic parameters characteristics, we choose Daubechies (dbN) wavelet and discrete Meyer wavelet (dmey) as mother wavelets. Using DWT low-pass filtering in the spatial frequency domain, according to the above steps in the part of method of wavelet anaysis, we analyze sample data and determine db10 and dmey as the optimal wavelet bases.
In the execution of wavelet transform under the trend of low frequency, we do verification at five different scale levels. From j=1 to 5, we found that, when scale level is 1, 2, 3, the filtering effect is not apparent, and when scale level is 5, excessive filter appear, which lose much useful information about the original sequences. Only when scale level is 4, the filtering effect is moderate and signal peak can basically show the true TMHs, getting satisfactory results. So through the analysis of the sample data of the training set, according to the five kinds of hydrophobic parameters, we choose j=4 as the optimal scale level.
For FP hydrophobic parameter sequences, through the analysis of the data of the training set, we determine db10 as the optimal wavelet basis and get the corresponding optimal threshold at the scale level j=4. From six-fold cross-validation results (see Table 3), threshold 0.422 appeared five times, and the corresponding prediction accuracy is higher, getting maximum average prediction accuracy of the membrane protein TMHs is 96.1%, with the largest average prediction accuracy of residue is 79.1%.
Prediction accuracy for each group of training set and test set of FP hydrophobic parameters.
| Set number | Qp % | FAAcor % | |
|---|---|---|---|
| Training set | Testing set | ||
| 1 | 96.7 (0.422) | 94.7 | 81.1 |
| 2 | 96.1 (0.422) | 93.8 | 81.6 |
| 3 | 96.3 (0.422) | 97.1 | 79.7 |
| 4 | 95.6 (0.433) | 95.4 | 82.9 |
| 5 | 95.1 (0.422) | 97.3 | 75.6 |
| 6 | 96.2 (0.422) | 95.1 | 77.6 |
For sequence of KD hydrophobic parameters, we determined db10 as the optimal wavelet basis. At scale level j=4, data of each group of training set obtained the corresponding optimal threshold. In six-fold cross-validation result (see Table 4), threshold 0.888 appeared twice, threshold 0.836 appeared three times. In the test set, through the comparative analysis, we use the threshold 0.836, get maximum average prediction accuracy of the membrane protein TMHs being 95.8%, maximum average prediction accuracy of residue being 83.1%.
Prediction accuracy for each group of training set and test set of KD hydrophobic parameters.
| Set number | Qp % | FAAcor % | |
|---|---|---|---|
| Training set | Testing set | ||
| 1 | 95.4 (0.888) | 93.0 | 85.3 |
| 2 | 95.6 (0.773) | 94.1 | 86.5 |
| 3 | 95.5 (0.836) | 95.8 | 81.5 |
| 4 | 95.9 (0.888) | 94.9 | 84.6 |
| 5 | 94.6 (0.836) | 96.7 | 82.3 |
| 6 | 95.5 (0.836) | 94.9 | 85.6 |
For sequence of PP hydrophobic parameters, we determined dmey as the optimal wavelet basis. At scale level j=4, data of each group of training set obtained the corresponding optimal threshold. In six-fold cross-validation result (see Table 5), threshold 0.050 appeared twice. In the test set, we use the threshold 0.050, get maximum average prediction accuracy of the membrane protein TMHs being 93.3%, maximum average prediction accuracy of residue being 80.8%.
Prediction accuracy for each group of training set and test set of PP hydrophobic parameters.
| Set number | Qp % | FAAcor % | |
|---|---|---|---|
| Training set | Testing set | ||
| 1 | 96.2 (0.022) | 90.2 | 77.8 |
| 2 | 94.7 (-0.074) | 89.5 | 67.3 |
| 3 | 95.8 (0.017) | 90.8 | 81.0 |
| 4 | 94.5 (0.050) | 92.0 | 81.8 |
| 5 | 93.9 (0.081) | 93.2 | 73.9 |
| 6 | 93.4 (0.050) | 94.5 | 79.8 |
For sequence of EI hydrophobic parameters, we determined db10 as the optimal wavelet basis. At scale level j=4, data of each group of training set obtained the corresponding optimal threshold. In six-fold cross-validation result (see Table 6), threshold 0.384 appeared three times. In the test set, we use the threshold 0.384, get maximum average prediction accuracy of the membrane protein TMHs being 93.0%, maximum average prediction accuracy of residue being 73.9%.
Prediction accuracy for each group of training set and test set of EI hydrophobic parameters.
| Set number | Qp % | FAAcor % | |
|---|---|---|---|
| Training set | Testing set | ||
| 1 | 94.0 (0.414) | 92.0 | 78.5 |
| 2 | 94.9 (0.384) | 92.8 | 76.2 |
| 3 | 95.9 (0.384) | 92.8 | 74.0 |
| 4 | 93.6 (0.436) | 93.2 | 81.3 |
| 5 | 92.8 (0.384) | 93.4 | 71.4 |
| 6 | 93.4 (0.413) | 91.9 | 76.6 |
For sequence of JTT hydrophobic parameters, we determined db10 as the optimal wavelet basis. At scale level j=4, data of each group of training set obtained the corresponding optimal threshold. In six-fold cross-validation result (see Table 7), threshold 0.411 appeared twice, threshold 0.409 appeared twice too. In the test set, through the comparative analysis, we use the threshold 0.411, get maximum average prediction accuracy of the membrane protein TMHs being 94.7%, maximum average prediction accuracy of residue being 82.0%.
Prediction accuracy for each group of training set and test set of JTT hydrophobic parameters.
| Set number | Qp % | FAAcor % | |
|---|---|---|---|
| Training set | Testing set | ||
| 1 | 95.4 (0.446) | 92.2 | 86.6 |
| 2 | 95.8 (0.411) | 94.0 | 83.5 |
| 3 | 95.8 (0.411) | 95.4 | 80.5 |
| 4 | 94.8 (0.409) | 94.6 | 82.8 |
| 5 | 94.6 (0.412) | 96.7 | 80.0 |
| 6 | 94.6 (0.409) | 93.0 | 81.1 |
For these hydrophobic sequences mapped by the five commonly used hydrophobic parameters, through six-fold cross-validation method, we utilize the low-pass component of DWT and get different prediction accuracy of membrane protein TMHs and residue one by one, with the main results being shown in Figure 2.
Prediction accuracy for test set of five kinds of hydrophobic parameters.
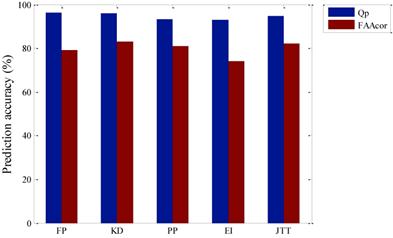
From Figure 2, prediction accuracy of the membrane protein TMHs by using FP hydrophobic parameters is the highest, which is 96.1%, but the prediction accuracy of residue is 79.1%. The second highest to predict residue is by using KD hydrophobic parameters, which is 83.1% and prediction accuracy of the membrane protein TMHs is also high, which only differ 0.3% compared with the prediction by FP hydrophobic parameters, that is, 95.8%. The third one is JTT hydrophobic parameters, with the prediction accuracy of the membrane protein TMHs and residue being 94.7% and 82.0% respectively. Lastly, prediction accuracy of the membrane protein TMHs and residue by EI hydrophobic parameters is the lowest, being 93.0% and 73.9% respectively. Through comparison, we think that choosing FP hydrophobic parameters is the best to only predict TMHs. While KD hydrophobic parameters is the best when combined with the prediction accuracy of residues.
We pick PDB ID 1KQG from MPtopo database as an example and choose KD hydrophobic parameters to describe this method to predict the number and position of membrane protein TMHs. Also we predict 13 groups of membrane protein sequence TMHs by using KD hydrophobicity scale values.
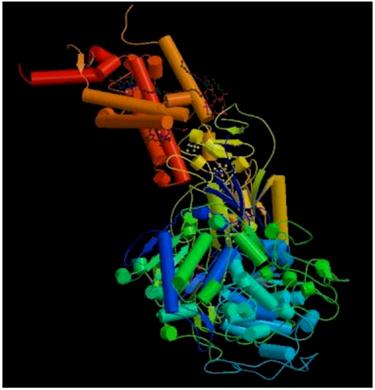
The 3D structure of protein 1KQG is measured by X-ray diffraction method, which is shown in Figure 3 [46]. It consists of three subunits, each subunit being transmembrane protein. Transmembrane segments traverse fat double as α helix. Here we mainly analyze transmembrane protein of γ subunit, which is four-transmembrane protein including 217 amino acid residues, as is shown in Figure 4.
The three-dimensional structure of protein 1KQG.
Linear sequence of the 1KQG protein and the parts of bold-face denote the real TMHs.
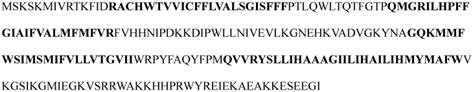
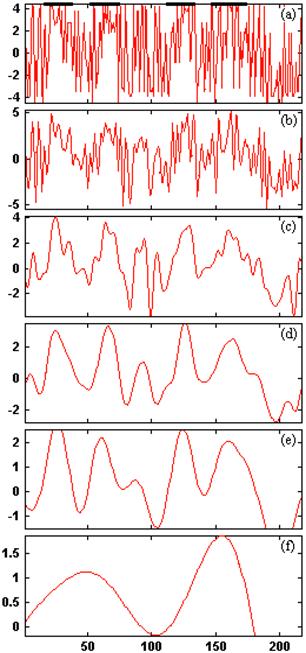
By using db10 wavelet basis, its original hydrophobic plots and reconstructed wavelet image at five different scale level is shown in Figure 5. We know that the signal peak after wavelet filter is corresponding to the real TMHs, each summit corresponding to the core of TMH. Through the above method, we can get a group of predicted TMHs. It can be seen that at the scale level 4, according to the wavelet filtering graph for the hydrophobicity sequence of 1KQG protein the predicted TMHs are correspondent well with the real TMHs. The selection of level 4 is based on our comparisons of wavelet filtering at each scale level. The effects of filtering at scale level 1, 2 and 3 are not apparent but the hydrophobicity signals are excessively filtered at scale level 5, which further results in the loss of much information about the original sequences. The TMHs prediction accuracy reaches 100% and the amino acid residues prediction accuracy reaches 98.8% at the scale level 4 with optimal threshold 0.836. The contrast data in Table 8 show above result more clearly. And amino acid sequence of membrane proteins 1KQG was prediced by the method DAS [18], HMMTOP2.0 [23, 24], PHDhtm [20, 21], PRED-TMR2 [17], SOSUI [16], TMAP [19], TMHMM2.0 [1, 22]. The result is shown in Table 8. From the Table 8, we can see the four TMHs of membrane proteins 1KQG were correspondence of TMHs we have predicted, i.e. All TMHs of membrane proteins have been predicted by WavePrd. One more TMHs was predicted by DAS; Three TMHs were predicted by PHDhtm and the third TMHs has 64 residues, i.e. the third and the fourth TMH were predicted together and result in big error. Good result has been achieved by other methods, yet TMHs and residues prediction accuracy are the highest by WavePrd.
The hydrophobicity signal plot and low frequencies at five different scale levels for 1KQG protein. (a) j=0; (b) j=1; (c) j=2; (d) j=3; (e) j=4; (f) j=5.
Location of TMHs of the sequence of 1KQG (top row), WavePrd prediction and results from other currently used prediction methods.
| TM1 | TM2 | TM3 | TM4 | ||
|---|---|---|---|---|---|
| Observed | 15-37 | 51-74 | 112-134 | 146-175 | |
| WavePrd | 17-36 | 53-70 | 116-134 | 149-176 | |
| DAS | 18-39 | 57-75 | 90-92 | 118-136 | 149-175 |
| HMMTOP2.0 | 20-38 | 55-73 | 116-135 | 152-176 | |
| PHDhtm | 18-45 | 55-76 | 117-180 | ||
| PRED-TMR2 | 19-37 | 55-73 | 115-135 | 156-176 | |
| SOSUI | 18-40 | 55-77 | 115-137 | 150-172 | |
| TMAP | 14-42 | 51-78 | 112-134 | 148-172 | |
| TMHMM2.0 | 21-40 | 55-77 | 117-139 | 154-176 |
According to the function and classification of membrane proteins, we divided 80 membrane proteins sequences into 13 groups, which was shown in Table 9. Mentioned above, the choosing of threshold was ascertained by the maximal and average prediction accuracy given by test data. For every group of membrane proteins, at the scale level 4, we tried to choose a proper threshold to raise prediction accuracy. Prediction accuracy in each protein family by using threshold 0.836 is shown in Table 9. As is mentioned above, threshold 0.836 is determined by cross-validation and is the optimal threshold obtained from the training set samples. Membrane proteins of the same family are homologous, so the optimal threshold of each group of membrane proteins may be different. The values of parenthesis in Table 9 are the optimal threshold used in prediction.
Prediction accuracy of TMHs in each protein family based on different thresholds.
| Family name | Prediction accuracy % | |||
|---|---|---|---|---|
| Qp a | FAAcora | Qp b | FAAcorb | |
| ABC transporters | 95.3 (0.836) | 74.8 | 100 (0.566) | 75.6 |
| Bacteriorhodopsin | 100 (0.836) | 70.7 | 100 (0.885) | 71.3 |
| Channel proteins | 91.4 (0.836) | 81.1 | 91.4 (0.847) | 81.3 |
| Cytochrome bc1 complexes | 86.6 (0.836) | 66.7 | 86.6 (0.765) | 68.9 |
| Cytochrome b6f complexes | 95.7 (0.836) | 82.5 | 95.7 (0.891) | 82.6 |
| Cytochrome c oxidases | 99.2 (0.836) | 93.7 | 99.2 (0.836) | 93.7 |
| Glycophorin | 100 (0.836) | 91.3 | 100 (0.668) | 92.0 |
| Light-harvesting complexes | 100 (0.836) | 93.9 | 100 (0.915) | 97.9 |
| Photosynthetic reaction centers | 98.4 (0.836) | 90.6 | 98.4 (0.866) | 91.2 |
| Photosystems | 97.0 (0.836) | 82.6 | 97.0 (0.836) | 82.6 |
| Respiratory proteins Rhodopsins | 93.7 (0.836) 100 (0.836) | 91.6 79.5 | 93.7 (0.836) 100 (0.885) | 91.6 79.9 |
| Translocation proteins | 97.0 (0.836) | 88.1 | 97.0 (0.868) | 88.5 |
| Average | 96.5 | 83.6 | 96.8 | 84.4 |
aThe average prediction accuracy of every group of membrane proteins with the threshold 0.836. bWith the different threshold for every group of membrane proteins , the prediction accuracy will be raised.
From Table 9, we can see that to choose different threshold for every group of membrane proteins can raise the prediction accuracy of TMHs and residues. With the threshold 0.566, the prediction accuracy of TMHs of ABC transporters is from 95.3% to 100%; With the threshold 0.915, the prediction accuracy of residues of light-harvesting complexes is from 93.9% to 97.9%. From another angle, we can see the TMHs and residues average prediction accuracy of the five groups of membrane proteins are the best, which are cytochrome C oxidases, glycophorin, light-harvesting complexes, respiratory proteins and photosynthetic reaction centers. For the thirteen groups of membrane proteins data, with the threshold 0.836, the maximal and average prediction accuracy of membrane proteins TMHs is 96.5% and that of residues is 83.6%. But by choosing different threshold for every group of membrane proteins of data base, the average prediction accuracy of TMHs and residues is the highest, which are 96.8% and 84.4%.
To access the effect of the method, 80 membrane proteins with known 3D structure are selected as test sets to be predicted by WavePrd, including 325 TMHs, 19396 amino acid residues altogether. Through analysis, we choose db10 as the optimal wavelet basis. The total number of predicted TMHs is 315 at the scale level 4 with optimal threshold 0.836, among which 308 TMHs are identical to real TMHs. The average prediction accuracy of TMHs is 96.3% and that of residues is 83.5%. The total residues of TMHs is 6580, among which 5495 are predicted rightly. The number of false positive segments is 7 and the number of false negative segments is 17. These results are better than that obtained by using other wavelets or levels. We predict 80 set of membrane proteins by 7 methods—DAS [18], HMMTOP2.0 [23, 24], PHDhtm [20, 21], PRED-TMR2 [17], SOSUI [16], TMAP [19], TMHMM2.0 [1, 22] and the prediction result can be found in Table 10.
Main results of eight prediction methods.
| Method | Nobs | Nprd | Ncor | Qp % | M | C | FP | FN | FAAcor % |
|---|---|---|---|---|---|---|---|---|---|
| WavePrd | 325 | 315 | 308 | 96.3 | 94.8 | 97.8 | 7 | 17 | 83.5 |
| DAS | 325 | 357 | 308 | 90.4 | 94.8 | 86.3 | 49 | 17 | 77.6 |
| HMMTOP2 | 325 | 321 | 308 | 95.4 | 94.8 | 96.0 | 13 | 17 | 84.3 |
| PHDhtm | 325 | 286 | 269 | 88.3 | 82.8 | 94.1 | 17 | 56 | 72.5 |
| PRED-TMR2 | 325 | 285 | 279 | 91.7 | 85.9 | 97.9 | 6 | 46 | 76.8 |
| SOSUI | 325 | 297 | 288 | 92.7 | 88.6 | 97.0 | 9 | 37 | 78.9 |
| TMAP | 325 | 299 | 291 | 93.4 | 89.5 | 97.3 | 8 | 34 | 81.7 |
| TMHMM2.0 | 325 | 307 | 299 | 94.7 | 92.0 | 97.4 | 8 | 26 | 84.6 |
Nobs, Nprd and Ncor are the number of observed, predicted and correctly predicted TMHs, respectively. Qp stands for prediction accuracy of TMHs, M and C stand for the measure indexes of sensitivity and specificity. FP and FN are the number of wrongly predicted TMHs and the number of not-predicted TMHs, respectively. FAAcor is the prediction accuracy of residues.
From Table 10, the prediction accuracy of TMHs by WavePrd is the highest, which is 96.3%. The next highest prediction method which is based on hidden Markov model are HMMTOP2.0, TMHMM2.0, with prediction accuracy being 95.4% and 94.7% respectively. The prediction accuracy of PHDhtm method based on neural network is the lowest, which is only 88.3%, short of 8.0% compared with WavePrd method. The highest prediction method of residue is TMHMM2.0 and HMMTOP2.0 methods, which is 84.6% and 84.3% respectively. The second highest prediction method of residue is WavePrd method, with the prediction accuracy being 83.5%. The above eight methods do prediction according to single sequence information. These comparisons indicate that our method is more accurate and effective in predicting the TMHs number and location of membrane proteins, which provide important information for research of membrane protein structure and function.
Conclusion
With the advancement of high-throughput sequencing technology and the practice of sequencing model organisms' genomes, more and more DNA and protein sequences are swarming into biological sequence databases with an unprecedented rate. How to mine valuable information efficiently from mass biological sequences is crucial to the research of bioinformatics as well as to many significant fields of functional genomics. The study of the structure and function of TM proteins is increasingly emphasized since TM proteins play an extraordinarily important role in the life activity of the cells, such as signal transduction, immune response and membrane transport. However, the structural determination of proteins needs a considerable number of purified proteins and it is a hard task because the peptide chains of the TM proteins span a lipid bilayer and sometimes transverse membrane many times [47]. Because transmembrane helix combine closely with membrane, first of all, the membrane must be disintegrated by eradicator to separate TM proteins. Then, the TM protein can be purified and made crystal. This is not only difficult in technique, but is also expensive. Thus, the high-resolution 3D structural determination and analysis of TM proteins cannot answer the need of the research for TM protein functions. The computer prediction and analysis of the TMHs is able to provide much important information to disclose the relationship between the structure and function of TM proteins.
We make use of multiresolution analysis theory to decompose the original signals into low frequency and high frequency domains in amino acid hydrophobicity scale format. In wavelet analysis, the low frequency can be easily obtained from a raw function by the decomposition and reconstruction formula. So high frequency domain is deleted and low frequency region is left for reconstructing wavelet because we only study the general features of protein sequences. In the results, we obtain precise filtering signals that can help us to find the actual location of TMHs in the protein sequences. The post-treatment of the filtering signals through reconstructing is very important in order to reach a high accuracy when we predict TMHs of protein sequences. 80 membrane proteins with known 3D structure are selected as test sets to be predicted by WavePrd. Firstly, six-fold cross-validation method is introduced and five commonly used hydrophobic parameters are used to predict the position and number of TMHs based on two different levels in order to find the best hydrophobic parameters, offer help for further membrane protein work and reduce the blindness of choosing hydrophobic parameters. Results show that the best membrane proteins TMHs is achieved when choosing FP and KD hydrophobic parameters. Secondly, take one membrane protein sequence as an example to bat around and do comparison combined with the prediction results by the other seven methods in order to confirm the effectiveness of WavePrd method. A group of TMHs are predicted for 13 groups of membrane protein sequences by using KD hydrophobic parameters. At last, in order to prove the feasibility of the method, 80 membrane proteins are selected as test sets. Compared with the main prediction results of seven popular prediction methods, the obtained results indicate that WavePrd method proposed in this paper has higher prediction accuracy.
Although the proposed method has the characteristics of simplicity, visual process, and high accuracy, through the analysis of the predicted results of data set, we found that compared with the actual structure of membrane protein, there still exist some differences in the position and number of the predicted TMHs. They are as follows: too much prediction, that is the position and number of the predicted TMHs and the actual structure is not completely corresponding; less prediction, i.e. we haven't predicted all the position and number of the actual structure of TMHs. This is because: (1) While doing wavelet transform, we just map the amino acid sequence of membrane protein into hydrophobic value sequence. Although hydrophobic effect is the most important factor to determine the stability of protein structure, it is not the only factor. In addition to hydrophobic effect, there are hydrogen bond, ionic bond and van der Waals force and disulfide bond of peptide chain, etc; (2) The volume of protein molecules, electric charge and many kinds of factors all have the regulation effects on the protein structure and stability; (3) According to the signal peptide hypothesis, the signal peptide can form TMHs in protein synthesis, auxiliary peptide chain across the endoplasmic reticulum (ER) membrane, so in forecasting TMHs, it is very normal that signal peptide is contained. In addition, because hydrophobicity is the main sequence characteristic of transmembrane helices, and there are likely to be long hydrophobic sequence in the hydrophobic core of water-soluble globular protein, which also can produce false positive results. In view of many kinds of factors, we think while we predict the position and number of membrane protein TMHs by mapping the amino acid sequence into hydrophobic value sequence, the deviation within the scope is allowed. If the above many factors are considered, the prediction accuracy can be improved. In this paper, we only predict the location and number of TMHs of membrane protein without considering the orientation of N-terminus of membrane protein. If we consider the physicochemical property of membrane protein and analyze membrane protein sequence by combining and altering "positive-inside-rule" in particular, we can better solve the above problems, which is our next research direction.
Acknowledgements
The authors sincerely thank all the reviewers for their valuable comments that contributed to improve this paper in many ways. This work was supported by the National Natural Science Foundation of China (Nos. 30871341, 40931053, 40974081), and Scientific Research Foundation for the Excellent Youth Scholars of Shandong Province of China (No. BS2012DX009).
Competing Interests
The authors have declared that no competing interest exists.
References
1. Krogh A, Larsson B, von Heijne G, Sonnhammer EL. Predicting transmembrane protein topology with a hidden Markov model: application to complete genomes. J Mol Biol. 2001;305:567-580
2. Tusnady GE, Dosztanyi Z, Simon I. PDB_TM: selection and membrane localization of transmembrane proteins in the protein data bank. Nucleic Acids Research. 2005;33:D275-D278
3. Ikeda M, Arai1 M, Okuno T, Shimizu T. TMPDB: a database of experimentally-characterized transmembrane topologies. Nucleic Acids Research. 2003;31:406-409
4. Liu J, Rost B. Comparing function and structure between entire proteomes. Protein Sci. 2001;10:1970-1979
5. Yildirim MA, Goh KI, Cusick ME, Barabasi AL, Vidal M. Drug-target network. Nature Biotechnology. 2007;25:1119-1126
6. Bockaert J, Pin JP. Molecular tinkering of G protein-coupled receptors:an evolutionary success. EMBO J. 1999;18:1723-1729
7. Marinissen MJ, Gutkind JS. G protein-coupled receptors and signaling networks: emerging paradigms. Trends Pharmacol Sci. 2001;22:368-376
8. Chen CP, Rost B. State-of-the-art in membrane protein prediction. Applied Bioinformatics. 2002;1:21-35
9. Howard AD, Mcallister G, Feighner SD, Liu Q, Nargund RP, Van der Ploeg LHT, Patchett AA. Orphan G protein-coupled receptors and natural ligand discovery. Trends Pharmacol Sci. 2001;22:132-140
10. Attwood TK. A compendium of specific motifs for diagnosing GPCR subtypes. Trends Pharmacol Sci. 2001;22:162-165
11. Kihara D, Shimizu T, Kanehisa M. Prediction of membrane proteins based on classification of transmembrane segments. Protein Engin. 1998;11:961-970
12. Melen K, Krogh A, von Heijne G. Reliability measures for membrane protein topology prediction algorithms. J Mol Biol. 2003;327:735-744
13. White S. The progress of membrane protein structure determination. Protein Sci. 2004;13:1948-1949
14. Kyte J, Doolittle RF. A simple method for displaying the hydrophathic character of a protein. J Mol Biol. 1982;157:105-132
15. von Heijne G. The distribution of positively charged residues in bacterial inner membrane proteins correlates with the transmembrane topology. EMBO J. 1986;5:3021-3027
16. Hirokawa T, Boon-Chieng S, Mitaku S. SOSUI: classification and secondary structure prediction system for membrane proteins. Bioinformatics. 1998;14:378-379
17. Pasquier C, Promponas VJ, Palaios GA, Hamodrakas JS, Hamodrakas SJ. A novel method for predicting trsnsmembrane segments in proteins based on a statistical analysis of the SwissProt database: the PRED-TMR algorithm. Protein Eng. 1999;12:381-385
18. Cserzö M, Wallin E, Simon I, von Heijne G, Elofsson A. Prediction of transmembrane alpha-helices in prokaryotic membrane proteins: the dense alignment surface method. Protein Eng. 1997;10:673-676
19. Persson B, Argos P. Prediction of transmembrane segments in proteins utilizing multiple sequence alignments. J Mol Biol. 1994;237:182-192
20. Rost B, Casadio R, Fariselli P. Topology prediction for helical transmembrane segments at 86% accuracy. Protein Sci. 1996;5:1704-1718
21. Rost B, Casadio R, Fariselli P, Sander C. Prediction of helical transmembrane proteins at 95% accuracy. Protein Sci. 1995;4:521-533
22. Sonnhammer EL, von Heijne G, Krogh A. A hidden Markov model for predicting transmembrane helices in protein sequences. Proc Int Conf Intell Syst Mol Biol. 1998;6:175-182
23. Tusnady GE, Simon I. Principles governing amino acid composition of integral membrane proteins: application to topology prediction. J Mol Biol. 1998;283:489-506
24. Tusnady GE, Simon I. Topology of membrane proteins. J Chem Inf Comput Sci. 2001;41:364-368
25. Nugent T, Jones DT. Transmembrane protein topology prediction using support vector machines. BMC Bioinformatics. 2009;10:159
26. Nugent T, Jones DT. Detecting pore-lining regions in transmembrane protein sequences. BMC Bioinformatics. 2012;13:169
27. Altaiski M, Mornev M, Polozov R. Wavelet analysis of DNA sequence. Genet Anal. 1996;12:165-168
28. Hirakawa H, Muta S, Kuhara S. The hydrophobic cores of proteins predicted by wavelet analysis. Bioinformatics. 1999;15:141-148
29. Liò P, Vannucci M. Wavelet change-point prediction of transmembrane proteins. Bioinformatics. 2000;16:376-382
30. Liò P. Wavelets in bioinformatics and computational biology: state of art and perspectives. Bioinformatics. 2003;19:2-9
31. Qiu J, Liang R, Zou X, Mo J. Prediction of transmembrane proteins based on the continuous wavelet transform. J Chem Inf Comput Sci. 2004;44:741-747
32. Pashou EE, Litou ZI, Liakopoulos TD, Hamodrakas SJ. waveTM: Wavelet-based transmembrane segment prediction. In Silico Biol. 2004;4:127-131
33. Yu B, Meng XH, Liu HJ, Wang YF. Prediction of transmembrane helical segments in transmembrane proteins based on wavelet transform. Journal of Shanghai University (English Edition). 2006;10:308-318
34. Mena-Chalco JP, Zana Y, Cesar-Jr RM. Identification of protein coding regions using the modified Gabor-wavelet transform. IEEE/ACM Transactions on Computational Biology and Bioinformatics. 2008;5:198-207
35. Price TS, Baggs JE, Curtis AM, FitzGerald GA, Hogenesch JB. WAVECLOCK: wavelet analysis of circadian oscillation. Bioinformatics. 2008;24:2794-2795
36. Wang PH, Yang PY, Arthur J, Yang JYH. A dynamic wavelet-based algorithm for pre-processing tandem mass spectrometry data. Bioinformatics. 2010;26:2242-2249
37. Liu Z, Abbas A, Jing BY, Gao X. WaVPeak: picking NMR peaks through wavelet-based smoothing and volume-based filtering. Bioinformatics. 2012;28:914-920
38. Jayasinghe S, Hristova K, White SH. MPtopo: A database of membrane protein topology. Protein Sci. 2001;10:455-458
39. Eisenberg D, Mclachlan AD. Solvation energy in protein folding and binding. Nature. 1986;319:199-203
40. Schwehm JM, Kristyanne ES, Biggers CC, Stites WE. Stability effects of increasing the hydrophobicity of solvent-exposed side chains in staphylococcal nuclease. Biochemistry. 1998;37:6939-6948
41. Huang DS, Xing-Ming Zhao XM, Huang GB, Cheung YM. Classifying protein sequences using hydropathy blocks. Pattern Recognition. 2006;39:2293-2300
42. Fauchere JL, Pliska V. Hydrophobic parameters-pi of amino-acid side-chains from the partitioning of n-acetyl-amino-acid amides. Eur J Med Chem. 1983;18:369-375
43. Eisenberg D, Schwarz E, Komaromy M, Wall R. Analysis of membrane and surface protein sequences with the hydrophobic moment plot. J Mol Biol. 1984;179:125-142
44. Boyd D, Schierle C, Bechwith J. How many membrane proteins are there. Protein Sci. 1998;7:201-205
45. Mallat S. A theory for multiresolution signal decomposition: the wavelet representation. IEEE Trans Pattern Anal Math Intell. 1989;11:674-693
46. Jormakka M, Tornroth S, Byrne B, Iwata S. Molecular basis of proton motive force generation: structure of formate dehydrogenase-N. Science. 2002;295:1863-1868
47. Hong H, Tamm LK. Elastic coupling of integral membrane protein stability to lipid bilayer forces. Proc Natl Acad Sci USA. 2004;101:4065-4070
Author contact
![]() Corresponding author: Tel./fax: 86-532-88958923 E-mail address: yubinedu.cn.
Corresponding author: Tel./fax: 86-532-88958923 E-mail address: yubinedu.cn.