ISSN: 1449-2288International Journal of Biological Sciences
- Current issue
- Volume 20; 2024
- Volume 19; 2023
- Volume 18; 2022
- Volume 17; 2021
- Volume 16; 2020
- Archive
- Advance articles
- Cover images
- Index & coverage
- Cover suggestion
- Special issues
Introduction
Materials and Methods
Results
Discussion
Conclusions
Supplementary Material
Acknowledgements
References

Int J Biol Sci 2016; 12(7):786-798. doi:10.7150/ijbs.13851 This issue Cite
Research Paper
Fenofibrate Suppresses Oral Tumorigenesis via Reprogramming Metabolic Processes: Potential Drug Repurposing for Oral Cancer
Chia-Ing Jan1,2, Ming-Hsui Tsai3, Chang-Fang Chiu4, Yi-Ping Huang5, Chia Jen Liu6, Nai Wen Chang6 ![]()
1. Department of Pathology, China Medical University and Hospital, Taichung, Taiwan, ROC
2. Department of Pathology, China Medical University and Beigang Hospital, Yunlin, Taiwan.TOC.
3. Department of Otolaryngology, China Medical University and Hospital, Taichung, Taiwan, ROC.
4. Department of Hematology Oncology, China Medical University and Hospital, Taichung, Taiwan, ROC.
5. Department of Physiology, College of Medicine, China Medical University, Taichung, Taiwan, ROC.
6. Department of Biochemistry, College of Medicine, China Medical University, Taichung, Taiwan, ROC.
Abstract

One anticancer strategy suggests targeting mitochondrial metabolism to trigger cell death through slowing down energy production from the Warburg effect. Fenofibrate is a clinical lipid-lowering agent and an effective anticancer drug. In the present study, we demonstrate that fenofibrate provided novel mechanisms for delaying oral tumor development via the reprogramming of metabolic processes. Fenofibrate induced cytotoxicity by decreasing oxygen consumption rate (OCR) that was accompanied with increasing extracellular acidification rate (ECAR) and reducing ATP content. Moreover, fenofibrate caused changes in the protein expressions of hexokinase II (HK II), pyruvate kinase, pyruvate dehydrogenase, and voltage-dependent anion channel (VDAC), which are associated with the Warburg effect. In addition, fenofibrate reprogrammed the metabolic pathway by interrupting the binding of HK II to VDAC. In an oral cancer mouse model, fenofibrate exhibited both preventive and therapeutic efficacy on oral tumorigenesis. Fenofibrate administration suppressed the incidence rate of tongue lesions, reduced the tumor sizes, decreased the tumor multiplicity, and decreased the immunoreactivities of VDAC and mTOR. The molecular mechanisms involved in fenofibrate's ability to delay tumor development included the down-regulation of mTOR activity via TSC1/2-dependent signaling through activation of AMPK and inactivation of Akt, or via a TSC1/2-independent pathway through direct suppression of raptor. Our findings provide a molecular rationale whereby fenofibrate exerts anticancer and additional beneficial effects for the treatment of oral cancer patients.
Keywords: Fenofibrate, Oral cancer, Warburg effect, Metabolic reprogramming, mTOR
Introduction
Oral squamous cell carcinoma (OSCC) is the most commonly diagnosed oral cancer. Once the tumor metastasizes, the prognosis is poor even after treatment with chemotherapeutic and targeted agents. It is known that the basal requirement of cancer cells to drive proliferation relies on energy production from the Warburg effect [1]. The Warburg effect is the phenomena by which both normal proliferating cells or cancer cells metabolize nutrients in a manner that is less efficient at ATP production regardless of whether oxygen is present (aerobic glycolysis). Cancer cells tend to compensate for their energy needs by increasing the rate of glucose uptake compared to normal cells [2]. ATP deficiency in cells has been shown to induce cell cycle arrest or apoptosis [3, 4]. Therefore, the suggested therapeutic strategies to target the mitochondrial metabolism of cancer cells include inhibition of glycolysis, inhibition of lactate dehydrogenase activity, and disruption of the interaction between hexokinase II (HKII) and voltage-dependent anion channel (VDAC) [1, 5, 6]. VDAC is a mitochondrial membrane protein that mediates the permeation of metabolites between the mitochondria and cytosol [7]. Studies suggest that interrupting the binding of HKII to VDAC may decrease cancer cell viability [8─10].
Activation of peroxisome proliferator-activated receptors (PPARs) has been reported to disrupt tumor metabolism through interfering with the Warburg effect [6]. Fenofibrate, the agonist of PPARα, is an especially potent clinical lipid-lowering agent and an effective anticancer drug that has relatively low systemic toxicity [11, 12]. The molecular mechanisms involved in the anticancer activities of fenofibrate include the following: (1) induction of apoptosis and reduction of the proliferation rate in Ishikawa endometrial cancer cells, melanoma cells, and mantle cell lymphoma [13, 14]; (2) attenuation of IGF-1 receptor signaling in medulloblastoma and glioma cell lines [15, 16]; (3) blocking tumor angiogenesis by reducing VEGF and FGF2 secretion with simultaneous enhancement of thrombospondin-1 production in the tumor stroma [17, 18]; (4) suppression of the inflammatory response and oxidative stress in hamster melanoma metastases [19]; and (5) suppression of B-cell lymphoma by modulating lipid utilization [20].
Our previous study demonstrated that fenofibrate reduced the tumor incidence rate, decreased the tumor size, and suppressed tumor progression into squamous cell carcinoma in an oral-specific 4-nitroquinoline 1-oxide (4-NQO)/arecoline mouse model [21]. Recently, we also found that fenofibrate inhibited the invasion and migration of CAL27 oral cancer cells, which correlated with adenosine 5'-monophosphate-activated protein kinase (AMPK) signaling [22]. AMPK is an energy sensor and a serine/threonine protein kinase that mediates systemic lipid and glucose homeostasis [12, 23]. Activation of AMPK has been reported to regulate the mechanistic targeting of the rapamycin complex 1 (mTORC1) pathway through TSC1/TSC2, which may link to induce a progressive metabolic reprogramming, thus leading to the promotion of cancer cell death [24]. However, it has not been investigated whether the anticancer properties of fenofibrate are involved in mTOR signaling mediated by AMPK.
Therefore, we hypothesized that the mechanism by which fenofibrate suppresses oral tumor development might mediate metabolic changes through regulation of the Warburg effect and/or down-regulation of mTOR activity through activation of AMPK signaling. In this study, we aimed to explore the anti-tumorigenic effect of fenofibrate on metabolic reprogramming and mTOR signaling in both cell culture and 4-NQO/arecoline mouse models.
Materials and Methods
Cell culture
Two types of oral cancer cells were used in this study. The human oral cancer cell lines SAS (a high-grade malignant oral cancer cell line) and OECM1 (a low-grade malignant oral cancer cell line) were gifts from Dr. Chia-Ing Jan (Department of Pathology, China Medical University and Hospital, Taichung, Taiwan) [25]. We used the SAS and OECM1 human cell lines to study the mechanisms of fenofibrate on metabolic reprogramming and molecular signaling. Cells were grown in DMEM supplemented with 10% fetal bovine serum, 1% Antibiotic-Antimycotic and 2 mM L-glutamine (Gibco; Life Technology Corporation, NY, USA) at 37°C in a humidified 5% CO2 atmosphere incubator.
Cell viability assay
The SAS oral cancer cells were seeded in 24-well plates at a final density of 4×10⁴ cells/well. Cells were then incubated with fenofibrate (0, 25, 50, 75, and 100 μM) for 24 hours, and an equivalent volume of 0.1% DMSO was used as control. Viability and cell number counts were calculated with the trypan blue exclusion method. Samples were measured in three replicates, and each experiment was repeated at least three times.
Metabolic assay and measurement of cellular ATP content
The extracellular acidification rate (ECAR) and the oxygen consumption rate (OCR) were measured by a Seahorse XFe24 analyzer (Seahorse Bioscience, North Billerica, MA, USA), following the manufacturer's instructions. The SAS cells were seeded at 7×10⁴ cells per well in an XFe24 cell culture microplate and grown to approximate confluence in DMEM supplemented with 10% fetal bovine serum. Cells were further incubated at 37℃ with 5% CO2 overnight. Assays were initiated by removing the growth medium from each well and replacing it with 675 μl of unbuffered medium (DMEM supplemented with 2% fetal bovine serum) prewarmed to 37°C. After 4 baseline measurements, fenofibrate was injected (0, 50, or 100 μM) and the response to ECAR and OCR was monitored for a further 120 mins. Then, 50 mM of 2-deoxyglucose (2-DG) was injected for 32 mins. The values of OCR and ECAR were normalized to the total protein levels (BCA protein assay, Pierce) in each well. All data are expressed as a percentage of OCR or ECAR change over baseline. Additional measurements of glycolysis stress test were performed after SAS cells were pretreated with DMSO (control), fenofibrate (50 μM), GW6471 (20 μM), and fenofibrate (50 μM) + GW6471 (20 μM) for 2 hrs. Then, growth medium was replaced with XF medium (Seahorse Bioscience), free of sodium bicarbonate and glucose for 32 mins. The ECAR and OCR values were calculated after sequential injections of glucose (10 mM) for 24 mins, oligomycin (1 μM) for 24 mins, and 2-DG (50 mM) for 24 mins. SeaHorse XFe24 analyzer was run using the 8 mins cyclic protocol commands (mix for 3 mins, wait for 2 mins, and measure for 3 mins).
Cellular ATP content was assessed by using the ADP/ATP ratio assay kit (Abnova, Taipei, Taiwan), following the manufacturer's instructions. SAS cells were plated at 4×10⁴ cells/ml on white opaque 96-well microplate. Cells were then incubated with 50 μM fenofibrate for 2 hours, and an equivalent volume of 0.1% DMSO was used as control.
Protein extraction and Western blotting
To analyze protein levels in SAS and OECM1 cells, cell lysates were prepared and subjected to Western blot analysis as previously described [26]. Total protein contents were determined using Bio-Rad protein assay reagent (Bio-Rad Laboratories, CA, USA) with bovine serum albumin as a standard. Mitochondrial proteins were extracted using the mitochondria isolation kit(Thermo Scientific Pierce, IL, USA), following the manufacturer instructions. Mitochondrial protein contents were determined using the bicinchoninic acid assay (Thermo Scientific Pierce, IL, USA) with bovine serum albumin as a standard. Primary antibodies included hexokinase ΙΙ, lactate dehydrogenase, AKT1+2+3, phospho-Akt (Ser473), pyruvate kinase II (PKM2), mechanistic target of rapamycin (mTOR), and phospho-mTOR (ser2448) (GeneTex, CA, USA) were used at a 1:1000 dilution. VDAC, pyruvate dehydrogenase, AMPKα, phospho-AMPKα (Thr172), AMPKβ1/2, phospho-AMPKβ1 (Ser108), AMPKγ1, tuberous sclerosis complex-1 (TSC1), Ras homolog enriched in brain (Rheb), raptor, phospho-raptor (Ser792), PRAS40, and phospho-PRAS40 (Thr246) antibodies (Cell signaling Technology, MA, USA) were used at a 1:1000 dilution. TSC2 antibody (Epitomics, CA, USA) were used at a 1:1000 dilution. Internal control, β-actin (Santa Cruz, CA, USA) and cytochrome c oxidase (COXIV, Cell signaling Technology, MA, USA) antibodies, were used at a 1:2000 and a 1:1000 dilution, respectively. Western blots were quantified by densitometric analysis using KODAK image analysis software (Kodak EDAS290, Eastman Kodak, Rochester, NY, USA).
Hexokinase II and VDAC interaction was detected by immunoprecipitating with mouse monoclonal antibody of VDAC according to the manufacture's protocol (Santa Cruz, CA, USA). The immunoprecipate was resolved by an SDS-PAGE gel and blotted onto PVDF membrane. The membrane was then probed with an anti-hexokinase II antibody.
Immuno-cytofluorescence and co-localization of proteins
SAS cells (5×10⁴ cells/well) on cover slides were treated with 50 μM fenofibrate for 4 hr. Cells were then fixed in 3% formaldehyde (Sigma-Aldrich Corporation, MO, USA) in PBS for 15 min, permeabilized in 0.1% Triton X-100 in PBS for 20 min and stained with primary antibodies, including anti-Hexokinase II at 1:150 dilution overnight at 4°C. FITC-conjugated secondary antibodies were used at 1:100 dilutions for 1 hr at room temperature as previously described [22]. We utilized triple color co-localization analysis. Cells were stained with MitoTracker (red fluorescence) for mitochondria, DAPI (blue fluorescence) for nuclei, and hexokinase II-associated green fluorescence for tracing its localization. Cover slides were then mounted before photomicrographs were subjected to confocal microscopy analysis (Leica TCS SP2 Microsystems, Heidelberg, Mannheim, Germany). Co-localization analysis was performed using the MetaMorph software 7.6.2 (MSD Analytical Technologies, Downingtown, PA, USA).
Animal studies
Six-week-old male C57BL/6JNarl mice (n=150) were purchased from the National Laboratory Animal Center. The mice were handled in accordance with the Animal Care and Use Guidelines of the China Medical University, and the study protocol was approved by the Institutional Animal Care Use Committee. Mice were randomized assigned into one of nine groups. The experiments were controlled as previously described [27]. The carcinogens, 200 μg/ml 4-nitroquinoline 1-oxide (4-NQO; Sigma-Aldrich, St. Louis, MO, USA) and 500 μg/ml arecoline hydrobromide (Tokyo Chemical Industry Co. LTD, Tokyo, Japan), were used to induce oral tumorigenesis in mice. The experimental diets were prepared by mixing fenofibrate (0.3%, w/w) with the powdered chow diets (Prolab® RMH 2500 PMI Nutrition International, LLC, MO, USA). At the end of 28 weeks, all mice were euthanized. The tongues were then excised and prepared for pathological, immunohistochemical, and Western blot analysis.
Tongue lesion and pathological examination
Paraffin-embedded tongue specimens were stained with hematoxylin and eosin for histopathological examination. The lesions observed were classified as hyperplasia, low-grade dysplasia (LGD), high-grade dysplasia (HGD), and squamous cell carcinoma (SCC). The tumor sizes of visible lesions in each tongue were measured individually in width (mm) and only the largest lesion is presented in statistics. The multiplicity from all tumor lesions in each tongue was evaluated as previously described [21], thus the number of every macroscopic tumor lesions was counted.
Immunohistochemical analysis
Primary antibodies (GeneTex, CA, USA) were used for immunohistochemical analysis at the following dilutions: hexokinase II (1:500, GeneTex, CA, USA), VDAC (1:100, Cell signaling Technology, MA, USA), and mTOR (1:300, GeneTex, CA, USA). The staining methods were used as previously described [21]. The staining intensities were graded as negative (-), weak positive (1+), moderate positive (2+), and strong positive (3+); the staining intensities were scored as 0, 1, 2, and 3, respectively.
Statistical analysis
All data were analyzed using SPSS 15.0 for Windows. Cell viability, OCR, and ECAR were compared using the one way analysis of variance (ANOVA). Statistical analyses of the tumor size and incidence of tongue lesions were performed using Fisher's exact probability test. Two-tailed, Mann-Whitney tests were used to analyze the differences in multiplicity of tongue lesions and IHC staining intensity of hexokinase II, VDAC, and mTOR. Differences were considered significant at P<0.05. All experiments were repeated at least twice. All Western blot experiments were repeated at least three times with a different cell preparation.
Results
Fenofibrate suppressed cell proliferation
To assess whether fenofibrate influenced cell viability, the SAS oral cancer cells were treated with various doses of fenofibrate for 24 hrs. As shown in the Supplementary Fig. 1, fenofibrate had a significant inhibitory effect on cell viability in a dose-dependent manner. The 50% suppressive concentration was 49.1 μM. Therefore, we used fenofibrate at a concentration of 50 μM in subsequent studies.
Fenofibrate activated the glycolytic pathway and reduced mitochondrial respiration
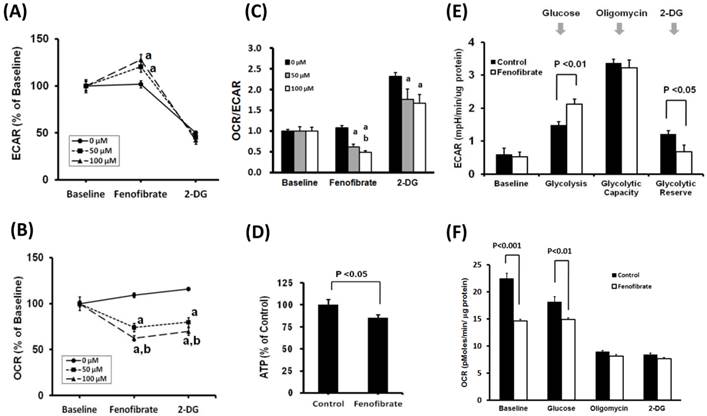
It is known that most cancer cells rely on the Warburg effect to generate the energy needed for cellular processes [1]. The Warburg effect is the observation that most cancer cells predominantly produce energy by a high rate of glycolysis followed by lactic acid fermentation in the cytosol, rather than using a comparatively low rate of glycolysis followed by oxidation of pyruvate in mitochondria like most normal cells. To investigate the effects of fenofibrate on the two major energy producing pathways (glycolysis and mitochondrial respiration), the ECAR and OCR were measured with XFe24 extracellular flux analyzer. The ECAR and OCR are indicators of the glycolytic pathway and mitochondrial respiration, respectively. We found that SAS cells treated with 50 or 100 μM fenofibrate for 2 hrs exhibited a significant increase in ECAR (Fig. 1A, P<0.001) and a decrease in OCR (Fig 1B, P<0.001) as compared with the control. Fenofibrate induced a dose-dependent decrease in OCR (Fig. 1B), however, ECAR did not showed a dose-responsive reaction (Fig. 1A). The final injection is 2-DG. 2-DG is a glucose analog, it inhibits glycolysis through competitive binding to hexokinase, and the resulted decreases in ECAR confirmed that the ECAR produced in the experiment is due to glycolysis. In addition, both 50 and 100 μM fenofibrate-treated cells exhibited significant decreases in the ratio of OCR/ECAR as compared to the control (P<0.001, Fig. 1C), indicating a decreased mitochondrial respiration. Finally, we determined the cellular ATP content to study whether the OCR response elicited by fenofibrate is linked to ATP production. We observed that fenofibrate significantly suppressed the ATP content when compared with the control (p<0.05; Fig. 1D). These findings suggested that fenofibrate induced cytotoxicity might be involved in metabolic shift through activating the glycolytic pathway and reducing mitochondrial respiration.
Next, to examine whether PPARα activity is associated with ECAR and OCR levels in glycolysis, SAS cells were pretreated with DMSO (control), fenofibrate, GW6471, and fenofibrate+GW6471 for 2 hrs. Then cells were transferred to glucose free medium to determine ECAR and OCR through glycolysis stress test (Fig. 1E, 1F, and Supplementary Fig. 2). Fenofibrate is an agonist of PPARα which transcribes gene expression of β-oxidation related proteins. GW6471, which inhibits the binding of PPARα to DNA, is a PPARα-specific inhibitor. In glycolysis stress test, the measurement of glycolysis rate is revealed by the ECAR reached by a given cell after the addition of saturating amounts of glucose. The measurement of glycolytic capacity is the maximum ECAR reached by a cell following the addition of oligomycin, which effectively shuts down oxidative phosphorylation and drives the cell to use glycolysis to its maximum capacity. The difference between glycolytic capacity and glycolysis rate defines glycolytic reserve. This measure indicates the reserve capacity available to utilize glycolysis beyond the basal rate. We found that fenofibrate significantly accelerated glycolysis rate and reduced glycolytic reserve as compared to the control (P<0.01 and P<0.05, respectively, Fig. 1E). However, no difference was found between both groups in glycolytic capacity after oligomycin injection (Fig. 1E), suggesting the acceleration of glycolysis rate induced by fenofibrate might contribute to compensate for the reduced mitochondrial respiration and for energy requirement of cell survival. At baseline, we found that OCR is lower in fenofibrate-treated cells than that in control cells because fenofibrate induced mitochondrial impairment after 2 hrs treatment (P<0.001, Fig. 1F and Supplementary Fig. 2B). After glucose injection, fenofibrate-treated cells alternatively used glucose as energy source and showed increased ECAR levels (Fig. 1E and Supplementary Fig. 2A), however, the oxidative phosphorylation is still proceeding. Fenofibrate did not change OCR levels during glucose injection (Fig. 1F and Supplementary Fig. 2B). These results indicated that an exception to the acceleration of glycolysis, mitochondrial oxidative phosphorylation still generated energy under mitochondrial impairment caused by fenofibrate treatment to compensate for reduced ATP content and for cell survival. Notably, when compared with the fenofibrate only group, GW6471 inhibited the effects of fenofibrate on OCR (Supplementary Fig. 2B, black line).
Fenofibrate alters the levels of Warburg effect-related proteins in SAS and OECM1 cells
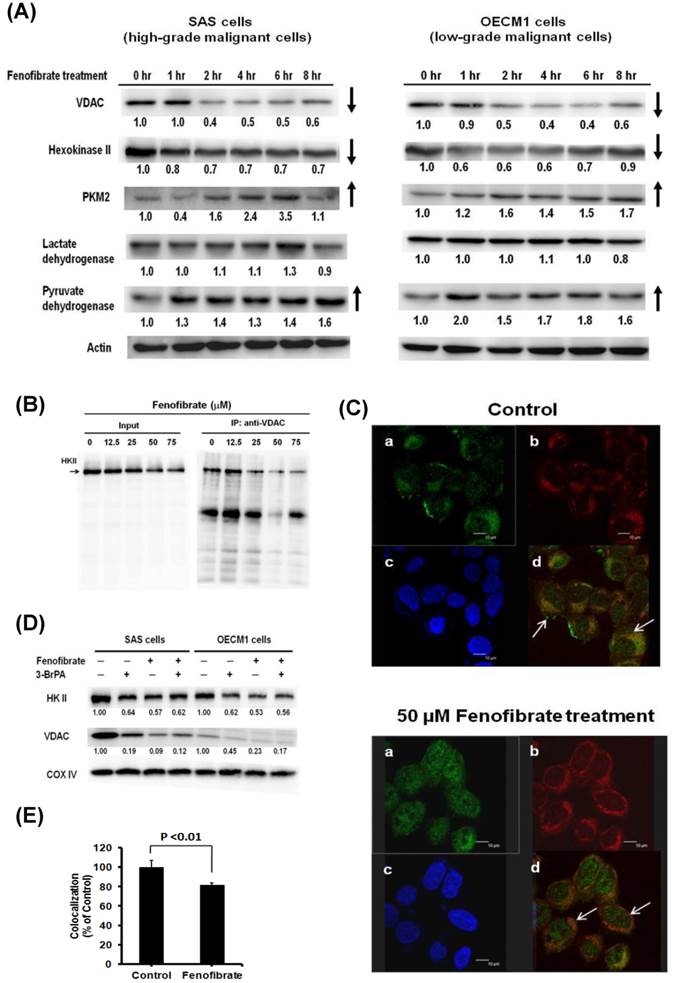
The speculation whether fenofibrate might induce metabolic shift in the proliferation process of oral cancer cells was then assessed by examining Warburg effect-related proteins in the SAS (a high-grade malignant cell) and OECM1(a low-grade malignant cell) human oral cancer cell lines. The protein expression levels were determined at 0, 1, 2, 4, 6, and 8 hrs by Western blot analysis after 50 μM fenofibrate treatment (Fig. 2A). We found that fenofibrate reduced the protein levels of VDAC and hexokinase II after 2 hr in both SAS and OECM1 cells, while the protein levels of pyruvate kinase II (PKM2) and pyruvate dehydrogenase were increased in both cell lines. However, there was no change in the expression of lactate dehydrogenase for up to 8 hr treatment. The reduced levels of VDAC and hexokinase II indicated that fenofibrate-induced cells rely less on energy production from the Warburg effect. The increased levels of PKM2 and pyruvate dehydrogenase suggested that fenofibrate switched the metabolic program into a lower rate of glycolysis.
Effects of fenofibrate on glycolysis in SAS cells. After establishing a baseline for 32 minutes, fenofibrate (0, 50, or 100 μM) was injected and (A) ECAR, (B) OCR or (C) OCR/ECAR was monitored for 120 minutes. 2-DG was then injected and ECAR or OCR was monitored for a another 32 minutes. ECAR and OCR are indicators of the glycolytic pathway and mitochondrial respiration, respectively. The OCR/ECAR represents overall bioenergetic state. a, P<0.001 compared to control (0 μM of fenofibrate treatment); b, P<0.05 compared to 50 μM of fenofibrate treatment. (D) Total ATP content was measured and expressed at percent of control as compared to 50 μM fenofibrate treatment. (E) and (F) Glycolysis stress test in SAS cells. Cells were pretreated with or without 50 μM fenofibrate for 2 hours, then measurements of ECAR and OCR were initiated by removing the growth medium from each well and replacing it with unbuffered XF medium (Seahorse Bioscience), free of sodium bicarbonate and glucose. The ECAR and OCR levels were calculated after one sequential addition of glucose (100 mM), Oligomycin (1 μM), and 2-DG (50 mM). All Data are shown as means ± SD; n = 4 per treatment group. All experiments were repeated at least twice. ECAR: extracellular acidification rate; OCR: oxygen consumption rate; 2-DG: 2-Deoxyglucose.
(A) Time-dependent changes in Warburg effect-related protein levels in SAS and OECM1 cells. Cells were exposed to 50 μM fenofibrate for 0, 1, 2, 4, 6, and 8 hrs. The total proteins were collected from total cell lysates, and the proteins levels were measured by Western blot analysis. VDAC: voltage- dependent anion channel. PKM2: pyruvate kinase II. (B) Effects of fenofibrate on the interaction between hexokinase II (HK II) and voltage-dependent anion channel (VDAC). Fenofibrate inhibited the binding of HK II to VDAC. Mitochondrial proteins were collected from SAS cells without (control) or with 50 μM fenofibrate treatment. HK II was co-immunoprecipitated by VDAC rabbit monoclonal antibody. The input and immunoprecipitated-VDAC products were then immunoblotted for HK II. (C) Fenofibrate triggered HK II dissociation from mitochondria. Confocal fluorescence microscopy showed (a) HK II (green color), (b) mitochondrial marker MitoTracker Red (red color), (c) nuclear marker DAPI (blue color), and (d) merged images in SAS cells without (control) or with 50 μM fenofibrate treatment. (D) Release of HK II from mitochondria was induced by fenofibrate and 3-bromopyurvate (3-BrPA). SAS and OECM1 cells were treated with fenofibrate and/or 3-BrPA for 6 hrs. 3-BrPA is a positive-control. The cells were collected, and mitochondrial lysates were immunoblotted for HK II and VDAC. (E) Co-localization analysis was measured using the MetaMorph software 7.6.2. The data were analyzed using a one-way ANOVA and presented as the mean ± SD.
Fenofibrate inhibited binding of hexokinase II to VDAC
It is known that aerobic glycolysis (Warburg effect) in cancer cell growth depends on the binding of hexokinase II to mitochondria through an interaction with VDAC [10]. VDAC is a pore protein located at the mitochondrial outer membrane that meditates the movement of metabolites across the mitochondrial membranes [7]. We next examined the effect of fenofibrate on the interaction of hexokinase II and VDAC in SAS cells. Hexokinase II was co-immunoprecipitated by VDAC rabbit monoclonal antibody, followed by immunoblotting with hexokinase II antibody. As shown in Fig. 2B, the results demonstrated that a higher dose of fenofibrate displayed a lower level of hexokinase II. Fenofibrate proportionally decreased the protein levels of hexokinase II in both the input and the immunoprecipitated-VDAC. This suggested that fenofibrate inhibited the binding of Hexokinase II to VDAC. Another result from confocal fluorescence microscopy showed that SAS cells stained with mitochondrial marker MitoTracker Red exhibited red color (Fig. 2C-b). The hexokinase II (green color) was less potent in the mitochondria of SAS cells treated with fenofibrate (Fig. 2C-a). Thus, SAS cells treated with fenofibrate exhibited more potent orange color when compared to control, which exhibited yellow color (Fig. 2C-d, shown by arrows in both groups). The intensity of mitochondrial hexokinase II was significantly lower in the fenofibrate-treated cells than in the control cells (P<0.01, Fig. 2E). These findings indicated that fenofibrate induced hexokinase II to dissociate from mitochondria, and it disrupted the interaction between Hexokinase II and VDAC. Furthermore, we used 3-bromopyruvate (3-BrPA) as a positive control to compare the effect of fenofibrate on the disruption of hexokinase II and VDAC interactions (Fig. 2D). 3-BrPA, a potent hexokinase II inhibitor, is known to directly trigger hexokinase II dissociation from the mitochondria [28]. SAS and OECM1 cells were treated with fenofibrate and/or 3-bromopyurvate (3-BrPA) for 6 hours, and then, the mitochondrial lysates were immunoblotted for HKII and VDAC. The results demonstrated that fenofibrate disrupted the interaction of hexokinase II and VDAC more potently than 3-BrPA in both SAS and OECM1 cells. However, fenofibrate did not exhibit additive inhibitory effects after concomitant treatment with 3-BrPA.
Fenofibrate had both preventive and therapeutic efficacy on oral tumorigenesis
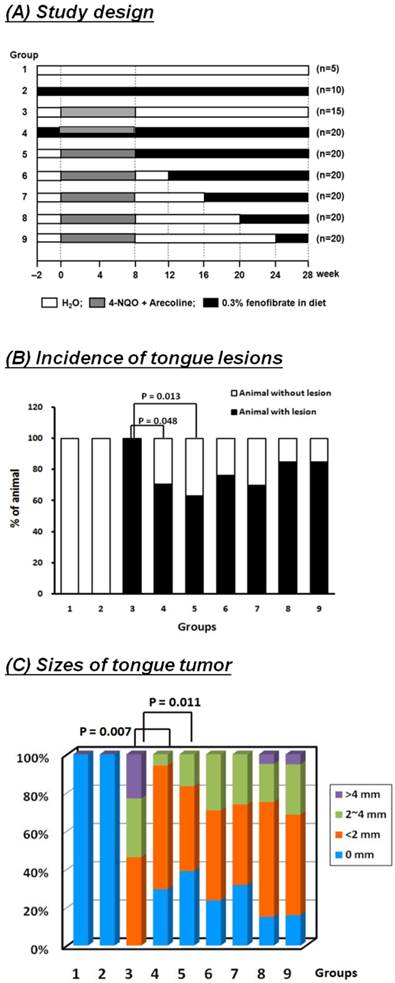
We next investigated whether the effects of fenofibrate on oral cancer cells were consistent in vivo using an oral cancer-specific mouse model. Our previous study indicated that fenofibrate exhibited a high potential to suppress the formation of squamous cell carcinoma in an oral-specific 4-NQO/arecoline mouse model [21]. Using this model, we assessed the preventive potential of fenofibrate and explored the optimal therapeutic time on tumor progression. Mice were divided into nine groups as shown in Fig. 3A. Mice in groups 2 and 4 were pre-treated with fenofibrate for 2 weeks in order to lower blood lipids. Administration of fenofibrate from week 2 to week 28 (a total of 30 weeks) in group 4 was designed to explore the preventive potential of fenofibrate on tumorigenesis. In addition, administration of fenofibrate from weeks 9, 13, 17, 21, or 25 to week 28, as shown in group 5 to group 9, was performed to evaluate the therapeutic efficacy of fenofibrate on tumor progression. After 28 weeks, half of the tongue samples from each group were fixed in 10% formaldehyde for pathological and immunohistochemical analysis. The results showed that the incidence rate of tongue lesions in the pre-treated fenofibrate mice (group 4) was significantly lower than that in the 4-NQO/arecoline only mice (group 3) (P<0.05, Fig. 3B). In addition, the tumor size was reduced in the pre-treated fenofibrate mice when compared to the tumor size in the 4-NQO/arecoline treated mice (P<0.01, Fig. 3C). These findings demonstrated that fenofibrate had preventive efficacy on tumor progression.
To assess the therapeutic efficacy in mice, the incidence rate of tongue lesions and the tumor size at different fenofibrate treatment durations were examined. We found that when mice were treated with fenofibrate at week 9, as well as at an early stage of tumor development, the incidence rate in mice (group 5) was significantly lower compared to mice treated with 4-NQO/arecoline (group 3) (P<0.05, Fig. 3B). The same result was found in the formation of tumor sizes (p<0.05, group 5 vs. group 3, Figure. 3C). Furthermore, administration of fenofibrate during the tumor development period (from week 13 to week 25) slightly decreased the incidence rate, but no significant difference was found in groups 6, 7, 8, and 9 when compared to group 3. In addition, no significant difference was observed in tumor size at a late stage of tumor development. These findings indicated that fenofibrate had more suppressive potential at an early stage of tumor development.
Incidence of tongue lesions and tumor sizes in mice. (A) Study design. (B) The incidence of tongue lesions was presented as the percentage of mice exhibiting tongue lesions after 28 weeks. Lesions included hyperplasia, low-grade dysplasia, high-grade dysplasia, and squamous cell carcinoma. (C) The tumor sizes in each group are presented as indicated. Statistical analysis of the incidence and tumor sizes of animals with tumor(s) was performed using the Fisher's exact probability test.
Fenofibrate reduced the multiplicity of tongue lesions
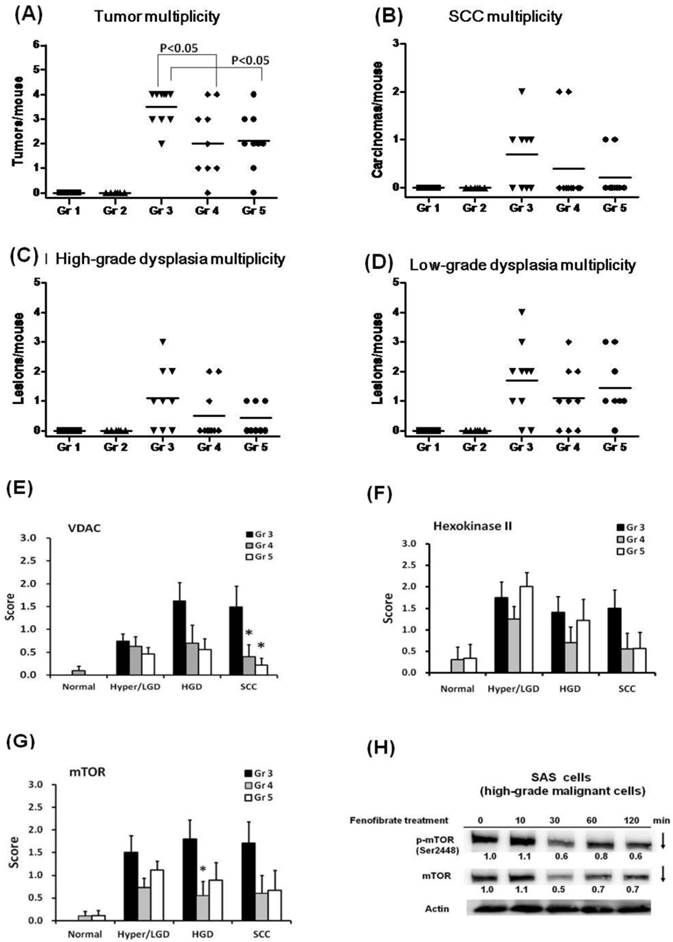
At the end of 28 weeks, all lesions in groups 1 to 5 were examined, and the results of histopathological diagnoses were graded as hyperplasia, low-grade dysplasia (LGD), high-grade dysplasia (HGD), and squamous cell carcinoma (SCC). As shown in Fig. 4A, fenofibrate treatment significantly reduced the multiplicity of tongue lesions in groups 4 and 5 when compared to group 3 (P<0.05). Notably, only 2 mice with lesions were observed with progression into SCC in the pre-treated fenofibrate group (group 4), while 5 mice with SCC lesions were diagnosed in the 4-NQO/arecoline induced mice (group 3, Fig. 4B). In addition, 2 mice with SCC lesions were observed in the therapeutic group (group 5). We also observed that fenofibrate was potent in suppressing formation of high-grade dysplastic lesions in groups 4 and 5 when compared to 4-NQO/arecoline induced mice (group 3, Fig. 4C). These results indicated that fenofibrate administration did not completely inhibit tumor lesion formation in mice; however, it delayed tumor development and was involved in reducing oral tumor multiplicity and suppressing tumor progression into SCC.
Fenofibrate decreased the expression of VDAC and mTOR
We analyzed the protein expression of hexokinase II, VDAC, and mTOR in tongue lesions from groups 3, 4, and 5. As shown in Fig. 4E, the expression of VDAC was significantly lower in SCC lesions from pre-treated fenofibrate mice (group 4) compared to 4-NQO/arecoline treated mice (group 3, P<0.05). A significantly suppressive effect was also observed in group 3 vs. group 5, which was treated with fenofibrate at an early stage of tumor development. These findings indicated that the suppression of tumor progression into SCC by fenofibrate was associated with the reduction of VDAC expression. Additionally, hexokinase II exhibited lower levels in SCC lesions from groups 4 and 5 (Fig. 4F).
We also determined the expression of mTOR, which plays an important role in promoting oral tumorigenesis. Lower levels of mTOR were observed in high-grade dysplasia lesions from fenofibrate treated mice (group 4) compared to untreated mice (group 3) (P<0.05; Fig. 4G). In addition, we also examined the effect of fenofibrate on mTOR protein levels in SAS cells, which are high-grade malignant cells. We observed that fenofibrate suppressed both mTOR and p-mTOR (Ser2448) expression levels in SAS cells (Fig. 4H).
(A-D) Multiplicity of tongue lesions in mice after fenofibrate treatment for 28 weeks. The tongue lesions were classified into four categories: hyperplasia, low-grade dysplasia, high-grade dysplasia, and squamous cell carcinoma (SCC). A statistical analysis of the tumor multiplicity was performed by the two-tailed Mann-Whitney test. Each dot in each group represents a mouse. (E-G) Immunohistochemical staining of Hexokinase II, VDAC and mTOR in the 4-NQO/arecoline induced mouse oral cancer. Ten mice in each group were examined. The immunohistochemical staining intensity of each protein in the tongue lesions was determined using a scoring system with four grades from negative (0), weak positive (1), moderate positive (2), and strong positive immunoreactivity (3). The scores of hexokinase II, VDAC, and mTOR are expressed as the mean with standard error mean (mean ± SEM). Asterisks represent a significant difference from the group 3 at the same pathological stage (*P<0.05, Mann-Whitney test). (H) Time-dependent changes in protein levels of mTOR and p-mTOR (Ser2448) in SAS cells treated with 50 μM fenofibrate.
Dose-dependent changes in AMPK/mTOR or Akt/mTOR signaling protein levels in SAS cells treated with fenofibrate. SAS cells were treated with 0, 12.5, 25, 50, and 75 μM fenofibrate for 4 hrs. Changes in the expression levels of AMPKα, p-AMPKα (Thr172), AMPKβ1/2, p-AMPKβ1 (Ser108), AMPKγ1, Akt1+2+3, p-Akt1(Ser473), tuberous sclerosis complex-1 (TSC1), TSC2, Ras homolog enriched in brain (Rheb), raptor, p-raptor (Ser792), PRAS40, and p-PRAS40 (Thr246) were measured by Western blot analysis. β-Actin was used as an internal control.
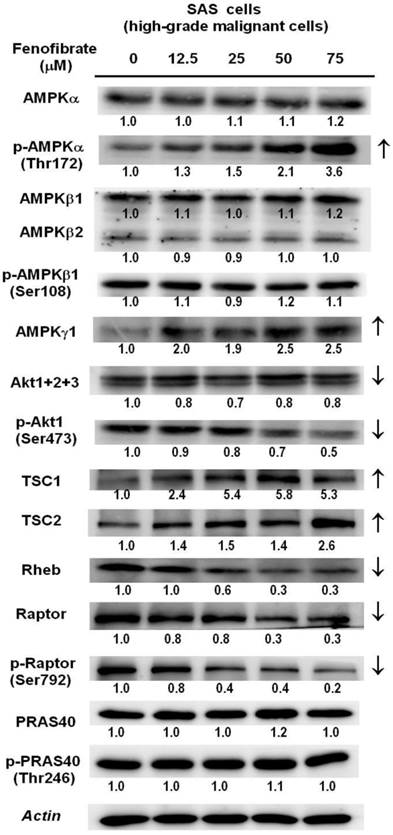
Fenofibrate suppresses cell proliferation by targeting the mTOR signaling pathway
It is known that the mTOR signaling pathway integrates oxidative metabolism and energy homeostasis through AMPK or Akt [24]. We determined the protein levels of AMPK subunits and Akt using Western blot analysis in SAS cells (Fig. 5). The protein levels of p-AMPKα (Thr172) and AMPKγ1 were increased in a dose-dependent manner. The downstream regulator of AMPK is the TSC1 and TSC2 complex, which functions as a GTPase activating protein for the Ras homolog enriched in brain (Rheb) small GTPase. TSC1/2 negatively regulates mTORC1 by converting Rheb into its inactive GDP-bound state [24]. As shown in Fig. 5, fenofibrate treatment increased the protein levels of TSC1 and TSC2 and reduced the protein levels of Rheb. This finding indicated that fenofibrate activated AMPK, which induced an increase in the TSC1 and TSC2 complex, leading to inactivation of Rheb and suppression of mTOR activity. Moreover, activation of Akt has been reported to inactivate the TSC1/2 complex, leading to increased active GTP-bound Rheb, which activates mTOR [29]. We found that fenofibrate inhibited the protein levels of p-Akt1(Ser 473) in a dose-dependent manner (Fig. 5). This finding suggested that fenofibrate also signaled to mTOR in an AMPK-independent fashion by inhibiting Akt activity, leading to activation of the TSC1/2 complex, which inactivated Rheb and then suppressed mTOR activity. In addition, the raptor protein is an mTOR activator, while the PRAS40 is an mTOR inhibitor [30]. We found that the protein levels of raptor and p-raptor (Ser792) were suppressed by fenofibrate in a dose-dependent manner (Fig. 5). However, no changes in PRAS40 and p-PRAS40 (Thr246) were observed. Taken together, these data indicate that fenofibrate suppressed mTOR activity by activating AMPK signaling and inactivating Akt signaling in a TSC1/2-dependent pathway. Additionally, fenofibrate modulated mTOR activity in a TSC1/2-independent pathway through direct suppression of raptor.
Discussion
Blocking the Warburg effect has been shown to selectively promote cancer cell death by switching to less efficient energy metabolism [1, 5]. AMPK plays a key role in metabolic control [6]. Indeed, we have recently demonstrated that fenofibrate inhibits the invasion of CAL27 cells (a human oral cancer cell line) through activation of AMPK (via the tumor suppressor LKB1), and the effect of fenofibrate on AMPK inhibition was attenuated by an AMPK inhibitor (compound C) and by a dominant negative-AMPK mutant [22]. In this study, we demonstrated that fenofibrate had both preventive and therapeutic efficacy on oral tumorigenesis, and the molecular mechanisms involved reprogramming of the metabolic pathway and reduction of mTOR activity.
The clinical lipid-lowering agent, fenofibrate, was demonstrated to have anticancer effects on oral tumorigenesis in our previous study [21]. To explore the mechanism, we analyzed ECAR and OCR in fenofibrate-treated cells and found that fenofibrate induced cytotoxicity was involved in decreasing mitochondrial respiration rate (OCR/ECAR) and reducing ATP content. Fenofibrate also down-regulated expression levels of VDAC and hexokinase II and up-regulated expression levels of PKM2 and pyruvate dehydrogenase during fenofibrate supplementation as shown in Fig. 2A. The low-activity form of PKM2 has been reported to be predominant in cancer cells [31]. Thus, fenofibrate increased the protein levels of PKM2 and pyruvate dehydrogenase may further direct the aerobic processes (Warburg effect) of cancer cells towards the TCA cycle and shift the energy production pathway. Our preliminary data showed that fenofibrate increased cellular levels of the TCA cycle intermediates such as citrate, isocitrate, α-ketoglutarate, fumarate, and L-malate after 2- and 4-hour treatments (data not shown). However, future studies will need to collect more evidence to prove how fenofibrate regulates these intermediates production.
The checkpoint for the energy production shift is the binding of hexokinase II to mitochondrial VDAC, which has been reported to prevent mitochondrial dysfunction and inhibit apoptosis [8, 9]. In our study, fenofibrate induced the dissociation of hexokinase II from mitochondria and exhibited a significant preventive effect against the hexokinase II and VDAC interaction (Fig. 2). An enhanced binding of hexokinase II to mitochondrial VDAC has been found to promote mitochondrial permeability transition pore closure and cell survival; and detachment of hexokinase II from VDAC by hexokinase II-displacing peptides specifically blocks the anti-survival effects of the mTOR kinase inhibitor [32]. Taken together, the dose-dependent cytotoxic action of fenofibrate in oral cancer cells might be related to inhibition of VDAC and hexokinase II production and disruption of the interaction between hexokinase II and VDAC, leading to induction of metabolic reprogramming and, thus, production of ATP through aerobic glycolysis. As a consequence, the levels of PKM2 and pyruvate dehydrogenase were increased to accelerate the citric acid cycle and the flux of electrons into the electron transport chain (Fig. 6A).
Metabolic reprogramming means that cancer cells must shift between aerobic glycolysis and Warburg effects. AMPK is a metabolic checkpoint sensitive to intracellular ATP content [6]. It is known that activating AMPK to down-regulate mTOR activity is associated with a lower risk for the development of head and neck cell carcinoma [33]. In this study, we demonstrated that fenofibrate induced a decrease in ATP content (Fig. 1 D) and an increase in the expression levels of phospho-AMPKα (Thr172) and AMPKγ1 and a parallel decrease in the expression levels of mTOR and phospho-mTOR (Ser2448) (Figs. 4H and 5). Consistent with these results, activation of phospho-AMPKα (Thr172) accompanied a decrease in the phosphorylation level of mTOR in breast cancer cells [23, 34]. However, the mechanisms by which fenofibrate reduced mTOR activity through AMPK remain to be elucidated. One possibility is that fenofibrate regulates the upstream regulator of mTOR such as TSC1, TSC2, and Rheb GTPase activity via AMPK [35, 36]. Our results demonstrated that fenofibrate enhanced the expression levels of TSC1 and TSC2 in a dose-dependent manner leading to reduced Rheb levels (Fig. 5) and then inactivation of mTOR activity (Fig. 4H). Another possibility is that AMPK phosphorylates the mTOR binding partner raptor and suppresses mTORC1 activity [30]. However, our results revealed that both the raptor and phospho-raptor (Ser792) levels were inhibited by fenofibrate in a dose-dependent manner (Fig. 5). This might explain why fenofibrate directly inhibited the expression levels of raptor and phospho-raptor, thereby blocking the formation of the mTOR-raptor complex and inactivating mTOR. The proposed AMPK/mTOR signaling pathways induced by fenofibrate are shown in Fig. 6B. However, it is still under investigation whether the antitumor effect of fenofibrate on metabolic reprogramming is directly regulated by mTOR signaling because mTOR triggers numerous signals that greatly complicate its cellular effects [24].
Like AMPK, Akt also communicates directly with mTOR. Akt-mediated activation of mTOR is controlled by TSC2 and PRAS40 [30]. We found that fenofibrate reduced Akt and phospho-Akt1 (Ser473) levels, thereby transmitting cellular signals that stimulate TSC2 expression, antagonize Rheb, and reduce mTOR activity (Figs. 5 and 4H). Moreover, PRAS40 is an inhibitor of mTOR. Akt-mediated phosphorylation of PRAS40 induces mTOR activation [30]. However, we did not observe any change in PRAS40 and phospho-PRAS40 (Thr246) expression levels. This indicates that the inhibition of mTOR activity by fenofibrate was not associated with Akt-mediated phosphorylation of PRAS40. This finding suggested that fenofibrate also targeted mTOR through Akt/TSC2/Rheb signaling, an AMPK-independent pathway (Fig. 6B).
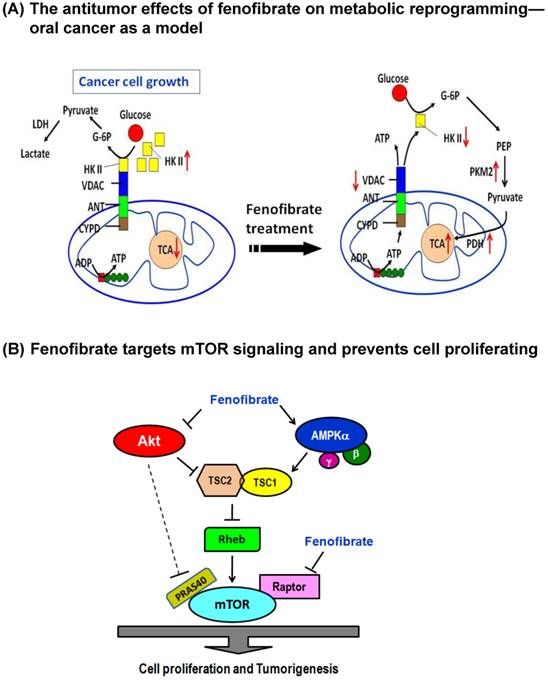
Dual mechanisms of fenofibrate on oral tumorigenesis. (A) Proposed model of fenofibrate treatment causing metabolic reprogramming in oral cancer cells. (B) Mechanism illustrates how fenofibrate affects tumorigenesis through mTOR signaling, including AMPK-dependent and Akt (AMPK-independent) pathways.
In addition, using an oral cancer-specific 4-NQO/arecoline mouse model, we found that fenofibrate reduced tongue lesions, tumor sizes, and tumor multiplicity at an early stage of tumor development (Figs. 3 and 4A). Indeed, we have reported that administration of fenofibrate suppresses tumor progression into SCC [21]. Our current study demonstrates several new findings. It should be noted that we do not know the time of tumor initiation. However, it is possible to trace tumor progression from clinical diagnoses. Thus, groups 5 to 9 in this study were designed to explore the optimal therapeutic time of fenofibrate from hyperplasia to SCC stages. The results indicated that fenofibrate treatment at an early stage exhibited high efficiency for lowering the incidence rate of tongue lesions and tumor sizes (Fig. 3). Fenofibrate administration delayed tumor development, which is involved in reducing tumor multiplicity (Fig. 4A) and suppressing tumor progression into SCC (Fig. 4B), and the mechanism is associated with lowering the expression levels of VDAC and hexokinase II (Figs. 4E and 4F). Moreover, mice pre-treated with fenofibrate in group 4, which continuously maintained low plasma lipid levels, were observed by IHC examination to have similar efficiency in lowering the expression of VDAC and hexokinase II. Notably, mice treated with fenofibrate had significantly lower mTOR immunoreactivity in high-grade dysplasia lesions than in untreated mice (Fig. 4G). Therefore, on the basis of in vitro and in vivo data, we suggested that fenofibrate had both preventive and therapeutic efficacy by inducing metabolic reprogramming and suppressing mTOR signaling. However, the association between metabolic reprogramming and mTOR inactivation remains to be elucidated. Further experiments will be designed to (1) test whether the reduction in mTOR-Akt action regulates glucose uptake in oral cancer cells and (2) confirm the specificity of PPARα activation on the expression of mTOR and ATP production with PPARα knockdown or pretreatment with PPARα antagonists.
Conclusions
This study, which was performed in an oral cancer cell culture model and in a 4NQO/arecoline induced mouse model, found that fenofibrate had both preventive and therapeutic efficacy by inducing metabolic reprogramming and by reducing mTOR activity. The molecular mechanisms involved are as follows: (1) fenofibrate disrupted the interaction between hexokinase II and VDAC, subsequently inducing metabolic reprogramming and leading to decreases in mitochondrial respiration and cellular ATP content; and (2) fenofibrate down-regulated the mTOR activity in TSC1/2-dependent signaling through activation of AMPK and inactivation of Akt; or in a TSC1/2-independent pathway through directly suppressing raptor.
Supplementary Material
Supplementary figures.
Acknowledgements
This study was supported by research grants from the Ministry of Science and Technology (NSC102-2320-B-039-009 and MOST104-2320-B039-035), Taiwan, ROC.
Competing Interests
The authors have declared that no competing interest exists.
References
1. Vander Heiden MG, Cantley LC, Thompson CB. Understanding the Warburg effect: the metabolic requirements of cell proliferation. Science. 2009;324:1029-33
2. Warburg O. On the origin of cancer cells. Science. 1956;123:309-14
3. Izyumov DS, Avetisyan AV, Pletjushkina OY, Sakharov DV, Wirtz KW, Chernyak BV. et al. "Wages of fear": transient threefold decrease in intracellular ATP level imposes apoptosis. Biochim Biophys Acta. 2004;1658:141-7
4. Hardie DG. AMP-activated/SNF1 protein kinases: conserved guardians of cellular energy. Nat Rev Mol Cell Biol. 2007;8:774-85
5. Fulda S, Galluzzi L, Kroemer G. Targeting mitochondria for cancer therapy. Nat Rev Drug Discov. 2010;9:447-64
6. Grabacka M, Pierzchalska M, Reiss K. Peroxisome proliferator activated receptor α ligands as anticancer drugs targeting mitochondrial metabolism. Curr Pharm Biotechnol. 2013;14:342-56
7. Colombini M. VDAC: the channel at the interface between mitochondria and the cytosol. Mol Cell Biochem. 2004;256-257:107-15
8. Gottlob K, Majewski N, Kennedy S, Kandel E, Robey RB, Hay N. Inhibition of early apoptotic events by Akt/PKB is dependent on the first committed step of glycolysis and mitochondrial hexokinase. Genes Dev. 2001;15:1406-18
9. Shimizu S, Matsuoka Y, Shinohara Y, Yoneda Y, Tsujimoto Y. Essential role of voltage-dependent anion channel in various forms of apoptosis in mammalian cells. J Cell Biol. 2001;152:237-50
10. Pastorino JG, Hoek JB, Shulga N. Activation of glycogen synthase kinase 3beta disrupts the binding of hexokinase II to mitochondria by phosphorylating voltage-dependent anion channel and potentiates chemotherapy-induced cytotoxicity. Cancer Res. 2005;65:10545-54
11. Grabacka M, Reiss K. Anticancer properties of PPAR alpha-Effects on cellular metabolism and inflammation. PPAR Res. 2008;2008:930705
12. Vamecq J, Colet JM, Vanden Eynde JJ, Briand G, Porchet N, Rocchi S. PPARs: interference with Warburg' effect and clinical anticancer trials. PPAR Res. 2012;2012:304760
13. Saidi SA, Holland CM, Charnock-Jones DS, Smith SK. In vitro and in vivo effects of the PPARalpha agonists fenofibrate and retinoic acid in endometrial cancer. Mol Cancer. 2006;5:13
14. Zak Z, Gelebart P, Lai R. Fenofibrate induces effective apoptosis in mantle cell lymphoma by inhibiting the TNFalpha/NF-kappaB signaling axis. Leukemia. 2010;24:1476-86
15. Drukala J, Urbanska K, Wilk A, Grabacka M, Wybieralska E, Del Valle L. et al. ROS accumulation and IGF-IR inhibition contribute to fenofibrate/PPARalpha-mediated inhibition of Glioma cell notility in vitro. Mol Cancer. 2010;9:159
16. Urbanska K, Pannizzo P, Grabacka M, Croul S, Del Valle L, Khalili K. et al. Activation of PPARalpha inhibits IGF-I-mediated growth and survival responses in medulloblastoma cell lines. Int J Cancer. 2008;123:1015-24
17. Varet J, Vincent L, Mirshahi P, Pille JV, Legrand E, Opolon P. et al. Fenofibrate inhibits angiogenesis in vitro and in vivo. Cell Mol Life Sci. 2003;60:810-9
18. Panigrahy D, Kaipainen A, Huang S, Butterfield CE, Barnes CM, Fannon M. et al. PPARalpha agonist fenofibrate suppresses tumor growth through direct and indirect angiogenesis inhibition. Proc Natl Acad Sci. USA. 2008;105:985-90
19. Grabacka M, Placha W, Plonka PM, Pajak S, Urbanska K, Laidler P. et al. Inhibition of melanoma metastases by fenofibrate. Arch Dermatol Res. 2004;296:54-8
20. Huang J, Das SK, Jha P, Al Zoughbi W, Schauer S, Claudel T. et al. The PPARα agonist fenofibrate suppresses B-cell lymphoma in mice by modulating lipid metabolism. Biochim Biophys Acta. 2013;1831:1555-65
21. Chang NW, Tsai MH, Lin C, Hsu HT, Chu PY, Yeh CM. et al. Fenofibrate exhibits a high potential to suppress the formation of squamous cell carcinoma in an oral-specific 4-nitroquinoline 1-oxide/arecoline mouse model. Biochim Biophys Acta. 2011;1812:558-64
22. Tsai SC, Tsai MH, Chiu CF, Lu CC, Kuo SC, Chang NW. et al. AMPK-dependent signaling modulates the suppression of invasion and migration by fenofibrate in CAL 27 oral cancer cells through NF-κB pathway. Environ Toxicol. 2014 [Epub ahead of print]
23. Lee KH, Hsu EC, Guh JH, Yang HC, Wang D, Kulp SK. et al. Targeting energy metabolic and oncogenic signaling pathways in triple-negative breast cancer by a novel adenosine monophosphate-activated protein kinase (AMPK) activator. J Biol Chem. 2011;286:39247-58
24. Laplante M, Sabatini DM. mTOR signaling in growth control and disease. Cell. 2012;149:274-93
25. Chen CY, Chiou SH, Huang CY, Jan CI, Lin SC, Hu WY. et al. Tid1 functions as a tumour suppressor in head and neck squamous cell carcinoma. J Pathol. 2009;219:347-55
26. Chang NW, Wu CT, Chen DR, Yeh CY, Lin C. High levels of arachidonic acid and peroxisome proliferator-activated receptor-alpha in breast cancer tissues are associated with promoting cancer cell proliferation. J Nutr Biochem. 2013;24:274-81
27. Chang NW, Pei RJ, Tseng HC, Yeh KT, Chan HC, Lee MR. et al. Co-treating with arecoline and 4-nitroquinoline 1-oxide to establish a mouse model mimicking oral tumorigenesis. Chem Biol Interact. 2010;183:231-7
28. Chen Z, Zhang H, Lu W, Huang P. Role of mitochondria-associated hexokinase II in cancer cell death induced by 3-bromopyruvate. Biochim Biophy Acta. 2009;1787:553-60
29. Sengupta S, Peterson TR, Laplante M, Oh S, Sabatini DM. mTORC1 controls fasting-onduced ketogenesis and its modulation by aging. Nature. 2010;468:1100-4
30. Gwinn DM, Shackelford DB, Egan DF, Mihaylova MM, Mery A, Vasquez DS. et al. AMPK phosphorylation of raptor mediates a metabolic checkpoint. Mol Cell. 2008;30:214-26
31. Christofk HR, Vander Heiden MG, Harris MH, Ramanathan A, Gerszten RE, Wei R. et al. The M2 splice isoform of pyruvate kinase is important for cancer metabolism and tumour growth. Nature. 2008;452:230-3
32. Kim JE, He Q, Chen Y, Shi C, Yu K. mTOR-targeted therapy: Differential perturbation to mitochondrial membrane potential and permeability transition pore plays a role in therapeutic response. Biochem Biophys Res Commun. 2014;447:184-91
33. Vitale-Cross L, Molinolo AA, Martin D, Younis RH, Maruyama T. Metformin prevents the development of oral squamous cell carcinoma from carcinogen-induced premalignant lesions. Cancer Prev Res. 2012;5:562-73
34. Chapuis N, Tamburini J, Green AS, Willems L, Bardet V, Park S. et al. Perspectives on inhibiting mTOR as a future treatment strategy for hematological malignancies. Leukemia. 2010;24:1686-99
35. Inoki K, Li Y, Xu T, Guan KL. Rheb GTPase is a direct target of TSC2 GAP activity and regulates mTOR signaling. Genes Dev. 2003;17:1829-34
36. Tee AR, Manning BD, Roux PP, Cantley LC, Blenis J. Tuberous sclerosis complex gene products, Tuberin and Hamartin, control mTOR signaling by acting as a GTPase-activating protein complex toward Rheb. Curr Biol. 2003;13:1259-68
Author contact
![]() Corresponding author: Department of Biochemistry, College of Medicine, China Medical University, 91 Hsueh-Shih Road, Taichung 404, Taiwan, ROC. Tel: +886 4 22053366 ext 2151. Fax: +886 4 22053764. E-mail: nwchangcmu.edu.tw.
Corresponding author: Department of Biochemistry, College of Medicine, China Medical University, 91 Hsueh-Shih Road, Taichung 404, Taiwan, ROC. Tel: +886 4 22053366 ext 2151. Fax: +886 4 22053764. E-mail: nwchangcmu.edu.tw.
Received 2015-9-14
Accepted 2016-4-1
Published 2016-5-15