International Journal of Biological Sciences 10
Impact Factor
ISSN: 1449-2288
Impact Factor
ISSN: 1449-2288

 Global reach, higher impact
Int J Biol Sci 2008; 4(3):143-149. doi:10.7150/ijbs.4.143 This issue Cite
Research Paper
Genetic Linkage Map of Olive Flounder, Paralichthys olivaceus
Jung-Ha Kang1, Woo-Jin Kim1, Woo-Jai Lee2 ![]()
1. Biotechnology Research Institute, National Fisheries Research and Development Institute, 619-705, Busan, Republic of Korea
2. GenoMar ASA, Post Box Sentrum 1159, 0107 Oslo, Norway
Received 2008-3-28; Accepted 2008-5-8; Published 2008-5-10
Citation:
Kang JH, Kim WJ, Lee WJ. Genetic Linkage Map of Olive Flounder, Paralichthys olivaceus. Int J Biol Sci 2008; 4(3):143-149. doi:10.7150/ijbs.4.143. https://www.ijbs.com/v04p0143.htm
Other stylesAbstract
Olive flounder, Paralichthys olivaceus, is an important fish species in Asia, both for fisheries and aquaculture. As the first step for better understanding the genomic structure and functional analysis, we constructed a genetic linkage map for olive flounder based on 180 microsatellites and 31 expressed sequence tag (EST)-derived markers. Twenty-four linkage groups were identified, consistent with the 24 chromosomes of this species. The total map distance was 1,001.3 cM based on Kosambi sex-average mapping, and the average inter-locus distance was 4.7 cM. Linkage between the loci was identified by an LOD score of ≥3. This linkage map may be used to map quantitative trait loci associated with important traits of the species and may assist in breeding programs.
Keywords: EST, flounder, linkage, microsatellite, Paralichthys olivaceus
1. Introduction
Olive flounder, Paralichthys olivaceus, is an important fish species in Asia for both fisheries and aquaculture. In an effort to improve the productivity of olive flounder through genetic selection, a preliminary marker-assisted-selection (MAS) using markers involving a major disease gene of the species has been carried out [1, 2]. Since 2004, selective breeding with means of phenotypic selection and family effects for a fast growth rate of the flounder has been implemented at the National Fisheries Research and Development Institute (NFRDI, Busan, Korea). The MAS approach is expected to increase genetic response by improving the intensity and accuracy of selection [3]. Together with phenotypic selection, an important step in such genetic improvement schemes is to accelerate the genetic gains using markers closely linked with the target traits. Genetic maps provide the important information for genomic structure and allow exploration of QTL, which can be used to maximize the selection effects for target traits [4]. A previous olive flounder linkage map [5] identified 30 linkage groups spanning an sex averaged total map length of 705 cM based on 111 microsatellites and 346 amplified fragment length polymorphism (AFLP) markers in a panel of 44 offspring. Unfortunately, AFLP markers have limitations in reuse for other families or populations because of difficulty in determining the mode of inheritance owing to dominance/recessiveness and limited portability [6]. Here we report a microsatellite-based and more saturated genetic linkage map of olive flounder based on 211 microsatellites containing 31 expressed sequence tag (EST)-derived markers, which can be used to overcome the disadvantages of AFLP markers for locus specific genotyping. Since EST-based markers from gene sequences have a high probability of being associated with gene functions, the segregation of alleles of such markers can be tested for their link to predicted phenotypes [7]. Those markers derived from expressed genes provide clear information for synteny discovery between fish genomes [8]. Our improved linkage map may serve as a framework for QTL and gene mapping in olive flounder, and it should facilitate MAS breeding for the genetic improvement of the species.
2. Materials and Methods
2.1. Mapping family
We created an F1 mapping population by crossing one wild-stock female and one male olive flounder. A total of 100 unsexed progeny were used to create the linkage map.
2.2. Microsatellite markers
The microsatellite markers used in this study were taken from the following sources: 111 markers suffixed TUF [5], 27 (#1-27) markers prefixed Kop [9], 16 markers prefixed Po [10], and 5 markers prefixed Po1 [11]. An additional 33 markers (MHFS suffix) were previously posted as P. olivaceus microsatellites on the GenBank/EMBL/DDBJ database. The polymorphisms and mapping feasibility of these markers were evaluated by genotyping of parental DNA; only those markers that were suitable for PCR, easy to score, and informative were used in this study. In addition to the 192 previously reported markers, 28 new markers were developed from genomic libraries [9]. These markers are listed as part of the Kop series (after #27; Table 1). Null alleles were identified with non-mendelian inheritance observed in offspring. The offspring carry different homozygous genotypes from the parents at certain loci.
2.3. Type I markers
In this study, simple sequence repeat markers (SSRs) were defined as arrays of dinucleotide repeat motifs longer than 18 bp. A total of 3,500 EST sequences retrieved from the GenBank/EMBL/DDBJ databases were screened for mono-, di-, tri- and tetra-nucleotide microsatellites using Tendem repeat finder [12]. EST-SSR primer pairs were developed and 76 EST-SSRs were amplified. However, only 31 markers were found to be informative in this mapping family. The names, repeat motifs, primer sequences, and putative functions of the 31 informative EST-SSR primer pairs are listed in Table 2.
Table 1
Characterization of 28 microsatellite markers used for Paralichthys olivaceus map.
| Locus | Repeat motif | Primer sequence (5'→3') Forward Reverse | Ta1 (ºC) | LG2 | GenBank accession no. |
|---|---|---|---|---|---|
| KOP30 | (GT)9 | TCGCTGCCAACTACGGTTCTT CCTTGTTCTCTGGGTGGAGTCTG | 60 | 9 | EU307223 |
| KOP31 | (AC)12AT(AC)5 | GCAGTGTGGCTAAGTACTTC ACAATTGTTCTCTCTCTGTG | 56 | 18 | EU307224 |
| KOP32 | (AC)10 | TCAAACACTCATCCGTCTTC GTTTCTCATGACTGGCTTGTAG | 60 | 24 | EU307225 |
| KOP35 | (AC)35 | CAGAACACTTAGCACATGC AACTCATGAAAAGATGGTTTG | 60 | 18 | EU307226 |
| KOP36 | (AT)2(GT)6GC (GT)2 | CCTACACTGTTGGTGAGAAAAG GTCGAGTCATCTAAGGTTTGC | 60 | 20 | EU307227 |
| KOP38 | (AC)12 | TCTTATCTCCCACTTTCCTC TACGTGTTGGTGTATCTGACT | 56 | 16 | EU307229 |
| KOP41 | (GT)9 | TGGAAGAACAATAGTCAAGAGA GCACTGCACTCAAACAATG | 56 | 6 | EU307232 |
| KOP44 | (GT)11 | GATTCTCAAAGGCAGACCATT GATCCCACCTTCAAAGTCAG | 56 | 6 | EU307234 |
| KOP46 | (CA)14 | AGAGTAACTACAGGAACTGCC CAGTGCCCAACCTCTG | 56 | 1 | EU307237 |
| KOP55 | (AC)9 | CATCCGTCTTCTAGACTGCTC GCTGGATGGGATTTGTG | 56 | 24 | EU307245 |
| KOP57 | (AC)16 | GTTCATGTTTGACGGTCCTCG GGGATTTGAAAGCGGGATTAGG | 56 | 14 | EU307247 |
| KOP58 | (GT)10 | TTTCTCATGACTGGCTTGTAG CAAACACTCATCCGTCTTCTA | 56 | 24 | EU307248 |
| KOP60 | (AC)3AT(AC)6 | TTCTCTCCTGCTGAACTACAC CCTCTCTTGCTCTTCTCTCA | 56 | 8 | EU307250 |
| KOP63 | (AC)8AT(AC)11 | CCTCCCACCTCAACAC CTTACGACATGTAATGCTTG | 56 | 11 | EU307251 |
| KOP67 | (CTGT)3CT (CTGT)4 | CACCTCTGACACCCACAAAG CTAAAGGTGAAGTCTGTCTGA | 56 | 4 | EU307253 |
| KOP68 | (AAC)7 | AGGTCAGGGTCACTCGTG TGACAAGAGGAATCATCACAA | 56 | 16 | EU307254 |
| KOP69 | (CT)3CC(CT)24 | CAGCCAGTATTTTTGACTTAC AACTAGACATTGGCCTGAG | 50 | 3 | EU307255 |
| KOP74 | (GA)3 AA (GA)19AA(GA)9 | CGTGGTGAGATAACTGTTAGATG GTGAAGTTTCTCAGCGTTTG | 56 | 4 | EU307258 |
| KOP75 | (GA)33 | ACACCAACTTCTAAGAGACAC CCAGTATTTTTGAATTACTACCT | 56 | 3 | EU307259 |
| KOP76 | (AG)16TG(AG)10 AT(AG)13 | TTCATTCACAGCAGATTCAAGAA AAGTCACAGACTGGACCTCAAAC | 56 | 23 | EU307260 |
| KOP77 | (TC)3TT(TC)14 | GCAACGTAAGGGTGAGAGATG CACTGCCACACTCGACAGAG | 50 | 16 | EU307261 |
| KOP79 | (CT)9 | ATGCAGATGATGATGGATGGAG CCGCTGCTTGAATATGCAAAC | 60 | 18 | EU307262 |
| KOP82 | (TC)3TT(TC)16 | CACATACACAGTCTCTTTGCTCT AACGAAAGTGTGAGCAGC | 56 | 18 | EU307263 |
| KOP85 | (TC)5TT(TC)19 | TCACATACACAGTCTCTTTGC CGAAAGTGTGAGCAGCAG | 56 | 18 | EU307266 |
| KOP86 | (GT)5(GA)17 AA(GA)5 | TGTGGAAGAGAATCTG ACATACACAGTCTCTTTGC | 50 | 18 | EU307267 |
| KOP88 | (AG)29 | CGAAACCAGCCAAACTCT ATTCAAGCCAGTAATGCAGTC | 56 | 3 | EU307268 |
| KOP91 | (AC)14GC(AC)15 | GACGCTACAGCATCTGATGTCA GGTTCAAAATCAGTGCATCAAAC | 56 | 24 | EU307270 |
| KOP93 | (AC)11GC(AC)3 | GAGGAAGAAACTAGTGCAGAG GGGTCAACATGATGAAGC | 60 | 10 | EU307271 |
1 Ta is the optimal annealing temperature; 2 LG is linkage group
Table 2
Primer information of 31 mapped EST-SSR markers used in this study. The ESTs were retrieved from public databases
| Locus | Repeat motif | Primer sequence (5'→3') Forward Reverse | Ta1 (ºC) | LG2 | GenBank accession No. | Source of cDNA |
|---|---|---|---|---|---|---|
| EKOP1-Br | (AGC)6AGT (AGC)15 | CACGAGGACCAGCAGGTGTTCTA GCAAGTGGTGTGGGCAAAGTCTA | 60 | 16 | CX284385 | Brain |
| EKOP2-Br | (AT)8 | AACTGAGGCTCCATCACTT TCATTCATTGGGGAGTTATC | 56 | 24 | CX284457 | Brain |
| EKOP-E1-Br | (AGC)6AGT(AGC)15 | GGACCAGCAGGTGTTCTA TTCTCCAGCTCAGAGATGAT | 58 | 16 | CX284385 | Brain |
| EKOP2-Bo | (CA)15 | GAAGGTTTAAGGAGCCAGTGAC CGGTACAGGTTATTGTGATTGTC | 60 | 5 | FE042418 | Bowel |
| EKOP-E1-Ey | (AT)12~(AT)10 | GTCGAGCTTTTTCAAGATGA TACTTGTCATCCAGAGCAG | 58 | 22 | CX283063 | Eyes |
| EKOP-E2-Ey | (CA)5CT(CA)5 CT(CA)36 | GGACCGAGGCAGACATCACA TCACCACCAGTTACAGCCATCA | 58 | 21 | CX283155 | Eyes |
| EKOP6-Ey | (AC)15 | GGCAAGGTAGGGATGGTGATTC GTTGGGATGCACAGGAACTGAC | 60 | 2 | CX283268 | Eyes |
| EKOP3-Ey | (ATG)6 | ACCAGCCATTTCAACACAG CACGTGTACGTTGAGTTTTA | 56 | 17 | CX283116 | Eyes |
| EKOP1-Ge | (AG)8CG(AG)9 CG(AG)13 | CAGGCGACTTAAACCCGTTATC AGCAGCAGCAGCAGTGGA | 60 | 8 | CX286078 | Gonad |
| EKOP-E1-Ge | (AG)8CG(AG)9 CG(AG)13~(CTG)5 | CTGAATACACAGCTCGTCA AATGAAAGTGTCCCTTCAGA | 58 | 8 | CX286079 | Gonad |
| EKOP-E1-Gi | (AC)8AA(AC)6 | CTGATAACAATCACGTGGAA CGACCCCACATACAGTAG | 58 | 15 | CX283308 | Gill |
| EKOP-E2-Gi | (GA)12 | GCCCTCCCTCCATCAGCCATAA GAGACTGTCCATTCGGGGGTTCA | 60 | 16 | CX283298 | Gill |
| EKOP4-Gi | (TG)22 | GGTCGTCGCTCTGATGCTGGTCA CTTCCGCCCTCGCTCACTGTCA | 60 | 15 | CX283316 | Gill |
| EKOP9-Gi | (GT)11 | TGCATGGAGAGTAGCCTTCTTG GGTTTTCTTTTCCCCCTCAGA | 57 | 14 | CX283393 | Gill |
| EKOP10-Gi | (AT)6AA(AT)9 | GTTTGCACTAATGCGTGTCTC AGGCTAAACAACAACAATGTCC | 60 | 24 | CX283308 | Gill |
| EKOP11-Gi | (CT)19 | CCCTCTCCCCATCCCACCC GGAAGCCAACCCTCAACTCCTGA | 55 | 21 | CX283413 | Gill |
| EKOP12-Gi | (CA)35 | GATTTTGGCTGTTGGGTTC CAATGGCACAGTCATCTTTACTC | 60 | 24 | CX283331 | Gill |
| EKOP-E1-In | (AGC)5 ~ (GCAG)3 | GTTCAAAAACACTGCGACAG CTCTATTTTGTCGACGTTCC | 58 | 14 | CX285440 | Intestine |
| EKOP2-In | (CT)13TTCT(CA)7 | GGCTGTCAGAGTTCTCCTGGAA CTAACACCTCTGGTTTGGCATCA | 60 | 19 | CX285589 | Intestine |
| EKOP3-In | (AC)32 | CGAGGGCCCATTCATCTAGTTTA GGCCAAAAGCTTGATCCTGAC | 60 | 15 | CX285592 | Intestine |
| EKOP3-Ki | (AT)10 | GATGAATCACCTGCCAAAAG GCTTCATCAGTTTGAATGGT | 56 | 6 | CX283730 | Kidney |
| EKOP5-Li | (CA)22TA(CA)5 | CTTCCACAGTAACTTCACATCCA GCATTTAGAGCAGACAGCAGTC | 60 | 11 | CX285412 | Liver |
| EKOP6-Li | (CA)12 | GTAGCGATAAAAACAAAACAGG GCAGCAATAAGACTCACGAA | 57 | 18 | CX285421 | Liver |
| EKOP17-Li | (AC)10(ATAC)10 | TCTACTCAGAGCCAACAAG ATCAGTCTGCACCTGAATG | 56 | 7 | CX286761 | Liver |
| EKOP2-Mu | (TC)10 | CATTTCACACTGCGTTACTC AGATGAGGGGATCAGAAATG | 58 | 21 | CX283994 | Muscle |
| EKOP5-Sk | (TG)13 | CATACAGTAATCGGCATGTG TTCAAAAGAGAGGGACACAG | 58 | 1 | CX284321 | Skin |
| EKOP1-Sp | (ATC)8 | TTGGACACAGAACCAAGAG CTGCGTGAGTAAAATGTGAA | 56 | 11 | CX283759 | Spleen |
| EKOP-E1-Sp | (ATC)8 | TTGGACACAGAACCAAGAG CTGCGTGAGTAAAATGTGAA | 58 | 11 | CX283759 | Spleen |
| EKOP-E2-Sp | (TG)9 | GGAGGTAAAGTGATGAACC ATCAAAGTCCTGTCGTGTC | 58 | 12 | CX283892 | Spleen |
| EKOP6-St | (CA)19 | GACTGAAGTACTGCTGATGGATTA GCTTGTGACAACTGGGTTTAGA | 55 | 16 | CX284835 | Stomach |
| EKOP8-St | (GT)14 | GTAAGTACGAGCTGCATAATGTG CACCCTCACTCTCTCTCAATGTC | 60 | 4 | CX284949 | Stomach |
1 Ta is the optimal annealing temperature; 2 LG is linkage group.
2.4. Genotyping
DNA was extracted from fin samples using TNES-urea buffer (6 M urea, 10 mM Tris-HCl [pH 7.5], 125 mM NaCl, 10 mM EDTA, and 1% SDS) and proteinase K treatment followed by standard phenol extraction methods [13]. PCR was performed in a 10-μl reaction volume containing 50 ng of genomic DNA, 10 mM Tris-HCl (pH 8.8), 0.1% Triton X-100, 5 mM KCl, 1.5 mM MgCl2, 0.2 mM each dNTP, 5 pmol of each primer, and 0.5 U of Taq DNA polymerase (Promega, Madison, WI). Amplification was carried out using a PTC 200 MJ-Research thermocycler DNA engine under the following conditions: initial denaturation at 95°C for 15 min followed by 35 cycles of 20 s at 94°C, 40 s at a primer-specific annealing temperature between 58 and 62°C, 1 min at 72°C, and a final extension period of 10 min at 72°C.
For fluorescent detection of the PCR products, the forward primer in each pair was labeled with 6-FAM, NED, or HEX dye. The polymorphic microsatellite loci were revealed using an ABI PRISM 3100 automated DNA sequencer (Applied Biosystems, Foster City, CA, USA) and alleles were designated according to product size (GENESCAN 400HD ROX, PE Applied Biosystems). The genotypes were scored using GENESCAN and GENOTYPER (both version 3.7) software.
2.5. Linkage analysis
Linkage analysis and the building of the map were achieved using Crimap version 3.0 [14]. Linkage groups were identified by pair-wise two point analysis. Those markers with LOD scores of ≥3 were assigned to the same linkage group. The order of markers in each linkage group was confirmed based on the likelihood scores using the flips 6 option in the Crimap package. The linkage maps are theoretically sex averaged maps because the unsexed progeny should be assumed to be 1:1 sex ratio. The maps were visualized using MapChart version 2.2 [15].
3. Results and Discussion
3.1. Genetic markers
Where possible, we established correspondence with the previous map [5] with the intention of providing a stable nomenclature for the linkage groups. The markers on LG 23, 24, and 28 in the previous map coalesced with LG 11, 20, and 3, respectively, in the new map. The relationships between the markers in the two maps are outlined in Table 3. Eighty-four of 110 previously-mapped microsatellite markers with the suffix TUF were also found in our linkage map. The linkages and order of markers in the new map are largely concordant with those in the previous linkage map of Japanese flounder [5].
Table 3
Relationships between the markers from the previous [5] and new (this study) linkage maps of Paralichthys olivaceus
| Current LG | Common markers | Previous LG | Not mapped |
|---|---|---|---|
| 1 | Poli6TUF, Poli110TUF, Poli130TUF | 1 | Poli9-22TUF1, Poli100TUF2, PoliRC12TUF3, Poli9-67TUF1 |
| 2 | Poli23TUF, Poli30TUF | 2 | - |
| 3 | Poli18-2TUF, Poli18TUF, Poli192TUF, Poli13TUF, Poli170TUF, Poli188TUF, Poli138TUF, Poli146TUF | 3 + 28 | Poli153TUF3 , Poli9-48TUF1 |
| 4 | Poli148TUF, Poli29TUF, Poli111TUF, Poli128TUF, Poli181TUF, Poli55TUF, Poli38TUF, Poli156TUF | 4 | Poli140TUF3, Poli115TUF1, Poli19TUF1, Poli142TUF3, PoliRC35TUF3 |
| 5 | Poli151TUF, Poli43TUF, Poli9TUF | 5 | - |
| 6 | Poli190TUF, Poli143TUF, Poli172TUF, Poli107TUF | 6 | - |
| 7 | Poli18-55TUF, Poli177TUF, Poli154TUF, Poli117TUF | 7 | Poli112TUF1 |
| 8 | Poli194TUF, Poli136TUF, Poli166TUF, Poli162TUF, Poli106TUF, Poli126TUF, Poli202TUF, Poli116TUF | 8 | - |
| 9 | Poli163TUF, Poli182TUF, Poli200TUF, Poli180TUF, Poli16-39TUF, Poli129UF, Poli16-76TUF | 9 | Poli49TUF1 |
| 10 | Poli34TUF, Poli144TUF, Poli13-2TUF | 10 | Poli101TUF1, Poli158TUF3 |
| 11 | Poli176TUF, Poli174TUF, Poli154TUF | 11 + 23 | Poli132TUF3 |
| 12 | Poli149TUF, Poli16-24TUF, Poli16-911TUF, Poli9-52TUF | 12 | Poli1TUF1, Poli131TUF3, Poli189TUF1, Poli179TUF3 |
| 13 | Poli18-44TUF, Poli187TUF, Poli145TUF, Poli175TUF, Poli133TUF | 13 | - |
| 14 | Poli141TUF, PoliRC47-TUF | 14 | - |
| 15 | Poli121TUFPoli9-8TUF, Poli168TUF | 15 | Poli15-35TUF1 |
| 16 | Poli105TUF, Poli199TUF | 16 | - |
| 17 | Poli9-38TUF | 17 | Poli127TUF2, Poli11TUF1 |
| 18 | Poli147TUF, Poli16-79TUF | 18 | - |
| 19 | - | 19 | Poli108TUF1 |
| 20 | Poli9-58TUF, Poli139TUF | 20 + 24 | Poli123TUF3 |
| 21 | Poli28TUF | 21 | Poli113TUF1, Poli102TUF2 |
| 22 | Poli2TUF | 22 | - |
| 23 | Poli122TUF, Poli193TUF, Poli150TUF, Poli56TUF, Poli18-42TUF, Poli-RC27-TUF | 26 | - |
| 24 | Poli198TUF, Poli124TUF | 27 | - |
1Unlinked marker; 2 segregating null allele; 3 monomorphic markers
Figure 1
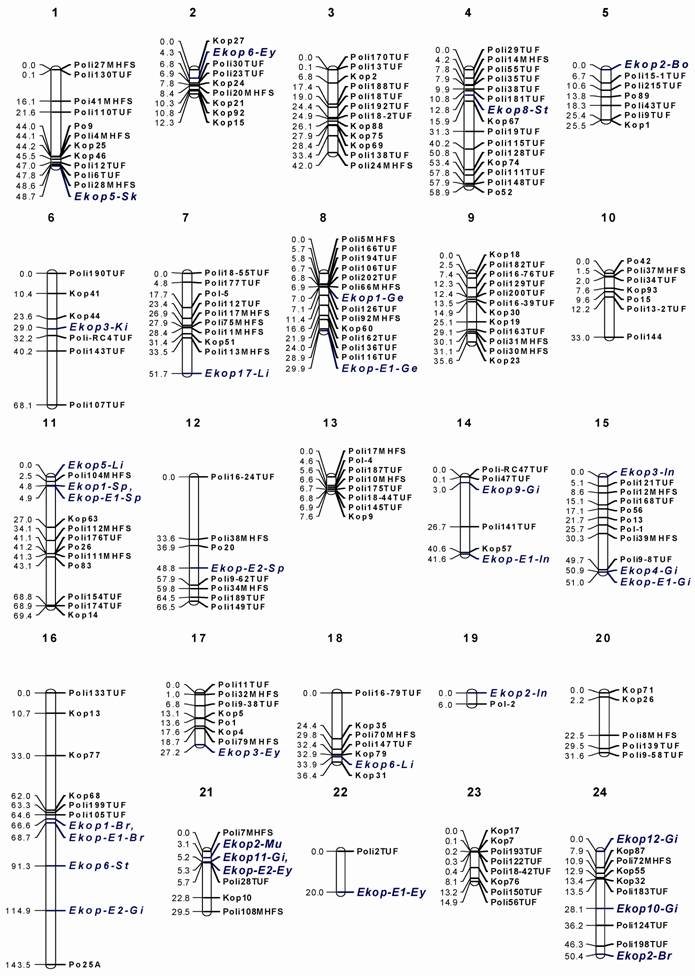
Linkage map for olive flounder (Paralichthys olivaceus). The nomenclature of linkage groups is consistent, where possible, with the previous map [5] and the marker distances are indicated in Kosambi centimorgan.
Twenty-six markers were not mapped in our analysis because of null or unlinked markers and homozygous genotypes. The segregation of null alleles was identified at three loci (Poli100TUF, Poli127TUF, and Poli102TUF). Thirteen markers (Poli9-22TUF, Poli115TUF, Poli9TUF, Poli112TUF, Poli15-35TUF, Poli11TUF, Poli9-6TUF, Poli9-48TUF, Poli49TUF, Poli101TUF, Poli1TUF, Poli108TUF, and Poli113TUF) were unlinked to any of the other markers and ten markers (PoliRC12TUF, Poli140TUF, Poli53TUF, Poli142TUF, PoliRC35TUF, Poli158TUF, Poli131TUF, Poli132TUF, Poli179TUF, and Poli123TUF) were not informative in this mapping family. The cross-species amplification of microsatellite markers between closely related species is an important issue for map construction because the interspecies use of markers can save a lot of resources and also indicate the relationships in genome structure and functions. Between Atlantic halibut and Japanese flounder genomes, around 63.9% of markers were amplified in both species and about half of the markers were polymorphic [16]. Using these markers, a comparative mapping between Atlantic halibut and Japanese flounder can be done in future. Especially it is interesting to see the genomic positions of the EST-derived markers.
3.2. Linkage map and genome size
Of the 220 microsatellite and 76 EST-derived markers tested, 180 (81.8%) informative microsatellite loci and 31 (40.8%) EST-based markers were assigned to the map. The sex-averaged map contained 211 markers in 24 linkage groups (Fig. 1). Ultimately, a total of the 211 markers were employed to successfully consolidate the current map into 24 linkage groups corresponding to the number of chromosome pairs in olive flounder [17]. The map covers 1,001.3 cM, with an average inter-marker distance of 4.7 cM. Marker density varies by linkage group, from 0.95 cM/marker on LG 13 to 20.0 cM/marker on LG 22. For a rough QTL analysis, the required minimum inter-marker distance is generally <20cM [18]. The map with an average marker distance of 4.7cM offers sufficient marker density for further genetic approach for the quantitative traits. The previously estimated genome size of the species was around 1,000 cM [5], which is similar with this map. The map with AFLP or EST derived markers deliver very close genome sizes, which indicates that the overall recombination rate of the markers is similar regardless the functions of markers and the variation in marker distribution throughout the genome. This seems indicating that marker density is more important than kinds of markers used for accurate estimate of genome sizes. The estimated genome sizes of fish species were from 700cM, Barramundi [19] and tiger pufferfish [20] to 1,500cM of atlantic halibut [16] and to 2,750cM of rainbow trout [21]. The olive founder genome size is in the moderate size range and can function as a bridge for fish genome evolution studies, which can be further understood with help from the genome sizes because the genome duplication in an ancestral lineage undoubtedly contribute to the genome size and structure of the species in that lineage [22].
Based on genome similarity, identified QTL and target EST sequences can be also applied between species and the structure and functions can be further clarified through positional cloning and comparative genomic analysis [23]. The olive flounder linkage map presented here provides the basis for further investigations into quantitative and comparative genomics of Pleuronectiformes.
Acknowledgements
This work was supported by grants from the National Fisheries Research and Development Institute (RP-2008-BT-007).
Conflict of interest
The authors have declared that no conflict of interest exists.
References
1. Fuji K, Kobayashi K, Hasegawa O. et al. Identification of a single major genetic locus controlling the resistance to lymphocystis disease in Japanese flounder (Paralichthys olivaceus). Aquaculture. 2006;254:203-210
2. Fuji K, Hasegawa O, Honda K. et al. Marker-assisted breeding of a lymphocystis disease-resistant Japanese flounder (Paralichthys olivaceus). Aquaculture. 2007;272:291-295
3. Bentsen HH, Gjerde B. Design of fish breeding programs. Proceedings of the 5th World Congress of Genetics Applied to Livestock Production. Guelph, ON: Department of Animal Science, University of Guelph. 1994:352-359
4. Wang CM, Lo LC, Zhu ZY. et al. A genome scan for quantitative trait loci affecting growth-related traits in an F1 family of Asian seabass (Lates calcarifer). BMC Genomics. 2006;7:274
5. Coimbra MRM, Kobayashi K, Koretsugu S. et al. A genetic linkage map of the Japanese flounder (Paralichthys olivaceus). Aquaculture. 2003;220:203-218
6. Danzmann RG, Gharbi K. Gene mapping in fishes: a means to and end. Genetica. 2001;111:3-23
7. Eujayl I, Sorrells ME, Wolters P. et al. Isolation of EST-derived microsatellite markers for genotyping the A and B genomes of wheat. Theor. Appl. Genet. 2004;104:399-407
8. Shimizu N, Sasaki T, Asakawa S. et al. Comparative genomics of medaka and fugu. Comp. Biochem. Physiol. 2006;1:6-12
9. Kim WJ, Kim KK, Lee JH. et al. Isolation and characterization of polymorphic microsatellite loci in the olive flounder (Paralichthys olivaceus). Molec. Ecol. Not. 2003;3:491-493
10. Sekino M, Hara M. Isolation and characterization of microsatellite DNA loci in Japanese flounder Paralichthys olivaceus (Pleuronectiformes, Pleuronectoidei, Paralichthyidae). Molec. Ecol. 2002;9:2200-2202
11. Takagi M, Yoshida K, Taniguchi N. Isolation of microsatellite loci from Japanese flounder Paralichthys olivaceus and detection of PCR fragments with simple Non-RI methods. Fish. Sci. 1999;65(3):486-487
12. Benson G. Tandem repeats finder: a program to analyze DNA sequence. Nucleic Acids Research. 1999;27:573-580
13. Asahida T, Kobayashi T, Saitoh K. et al. Tissue preservation and total DNA extraction from fish stored at ambient temperature using buffers containing high concentration of urea. Fish. Sci. 1996;62:727-730
14. Green P, Falls K, Crooks S. Documentation for CRI-MAP. St Louis, MI: Washington University School of Medicine. 1990
15. Voorrips R.E. MapChart software for the graphical presentation of linkage maps and QTLs. J. Hered. 2002;93:77-78
16. Reid DP, Smith CA, Rommens M. et al. A genetic linkage map of Atlantic halibut (Hippoglossus hippoglossus L). Genetics. 2007;177(2):1193-1205
17. Kikuno T, Ojima Y, Yamashita N. Chromosomes of flounder Paralichthys olivaceus. Proc. Japan Acad. 1986;62:194-196
18. Dekkers JCM, Hospital F. Multifactoral genetics: the use of molecular genetics in the improvement of agricultural populations. Nat. Rev. Genet. 2002;3:22-32
19. Wang CM, Zhu ZY, Lo LC. et al. A microsatellite linkage map of Barramundi, Lates calcarifer. Genetics. 2007;175:907-915
20. Kai W, Kikuchi K, Fujita M. et al. A genetic linkage map for the Tiger Pufferfish, Takifugu rubripes. Genetics. 2005;171:227-238
21. Guyomard R, Mauger S, Tabet-Canale K. et al. A type I and type II microsatellite linkage map of rainbow trout (Oncorhynchus mykiss) with presumptive coverage of all chromosome arms. BMC Genomics. 2006;7(302):1-13
22. Hoegg S, Brinkmann H. et al. Phylogenetic timing of the fish-specific genome duplication correlates with the diversification of teleost fish. J Mol Evol. 2004;59(2):190-203
23. Reid DP, Szanto A, Glebe B. et al. QTL for body weight and condition factor in Atlantic salmon (Salmo salar): comparative analysis with rainbow trout (Oncorhynchus mykiss) and Arctic charr (Salvelinus alpinus). Heredity. 2005;94:166-172
Author contact
![]() Correspondence to: Jung-Ha Kang, Biotechnology Research Institute, National Fisheries Research and Development Institute (NFRDI), 619-705, Busan, Republic of Korea. E-mail: jhkangre.kr
Correspondence to: Jung-Ha Kang, Biotechnology Research Institute, National Fisheries Research and Development Institute (NFRDI), 619-705, Busan, Republic of Korea. E-mail: jhkangre.kr
Citation styles
APA
Kang, J.H., Kim, W.J., Lee, W.J. (2008). Genetic Linkage Map of Olive Flounder, Paralichthys olivaceus. International Journal of Biological Sciences, 4(3), 143-149. https://doi.org/10.7150/ijbs.4.143.
ACS
Kang, J.H.; Kim, W.J.; Lee, W.J. Genetic Linkage Map of Olive Flounder, Paralichthys olivaceus. Int. J. Biol. Sci. 2008, 4 (3), 143-149. DOI: 10.7150/ijbs.4.143.
NLM
Kang JH, Kim WJ, Lee WJ. Genetic Linkage Map of Olive Flounder, Paralichthys olivaceus. Int J Biol Sci 2008; 4(3):143-149. doi:10.7150/ijbs.4.143. https://www.ijbs.com/v04p0143.htm
CSE
Kang JH, Kim WJ, Lee WJ. 2008. Genetic Linkage Map of Olive Flounder, Paralichthys olivaceus. Int J Biol Sci. 4(3):143-149.
This is an open access article distributed under the terms of the Creative Commons Attribution (CC BY-NC) License. See http://ivyspring.com/terms for full terms and conditions.