Impact Factor ISSN: 1449-2288

 Global reach, higher impact
Int J Biol Sci 2008; 4(4):215-222. doi:10.7150/ijbs.4.215 This issue Cite
Research Paper
Qualification and application of an ELISA for the determination of Tamm Horsfall Protein (THP) in human urine and its use for screening of Kidney Stone Disease
Wai-Hoe Lau1, Wing-Seng Leong2, Zhari Ismail1, Lay-Harn Gam1 ![]()
1. School of Pharmaceutical Sciences, Universiti Sains Malaysia, USM, Penang, Malaysia.
2. Lam Wah Ee Hospital, Penang, Malaysia.
Received 2008-4-29; Accepted 2008-8-2; Published 2008-8-4
Abstract
Kidney stone disease affects 1 - 20% of the general population. At present, the diagnosis of a stone is done using radiography method when noticeable symptoms appeared. We developed a non-invasive quantitative assay for urinary THP, namely ELISA; whereby our previous study and other reports had shown the usefulness of THP as biomarker for kidney stone disease. Since urine is biological fluid that is easily obtainable, this method could be used as a screening assay for kidney stone prior to confirmation with radiography. The ELISA gave assay linearity r2 > 0.999 within the range of 109 ng/mL to 945 ng/mL THP. Assay precisions were < 4% (C.V.) for repeatability and < 5% (C.V.) for reproducibility. Assay accuracy range from 97.7% to 101.2% at the various THP concentrations tested. Assay specificity and sensitivity were 80% and 86%, respectively. The cut-off points at P < 0.05 were 37.0 and 41.2 μg/mL for male and female, respectively. The assay is cost effective and rapid whereby the cost for assaying each urine sample in duplicate is approximately USD0.35 and within 5 hours, 37 samples can be assayed alongside full range of standards and 3 QC samples in each plate. Furthermore, sample preparation is relatively easy where urine sample was diluted 10 times in TEA buffer. The usability of the ELISA method for diagnosis of kidney stone disease is evaluated with 117 healthy subjects and 58 stone formers.
Keywords: Kidney stone disease, ELISA, Tamm-Horsfall protein, Screening assay
Introduction
Kidney stone disease affects 1 - 20% of the general population. The lifetime chance of an individual forming a kidney stone is 10 - 15% with the peak age of onset between 20 and 30 years old [1]. The risk of recurrence is 74% within 10 years for first-time stone formers [2]. Therefore, a rapid and reliable screening assay for kidney stones is highly desirable. In 1950, Tamm and Horsfall discovered a glycoprotein in urine that was named the Tamm Horsfall Glycoprotein (THP). THP is the most abundant protein present in the urine of healthy subjects [3]. It is secreted by the thick ascending limb of the loop of Henle [4, 5]. THP is inserted into the luminal cell surface by a glycosyl-phosphatidylinositol (GPI)-anchor and then excreted in urine at a rate of 50 - 100 mg/day [6, 7]. It is a monomeric glycoprotein of ~ 85 kDa with ~30% carbohydrate moiety that is heavily glycosylated by polyantennary sialated N-linked glycans [8, 9]. Sialic acid plays an important role in maintaining THP function during kidney stone formation [10]. THP has a strong tendency to forming macroaggregates of several million Daltons.
THP excretion decreases in stone formers and therefore it was proposed as a potential biomarker for kidney stone disease [11, 12]. Hess et al. [13] described THP as the major inhibitor to calcium oxalate crystal aggregation in the urine of healthy individuals. However, other reports showed that stone formers excreted defective urinary THP that devoid of sialic acid with a diminished effect on inhibiting stone formation [10, 13]. A number of assays have been developed to detect THP includes electroimmunodiffusion, gel electrophoresis, radioimmunoassay and enzyme-linked immunosorbent assays (ELISA). THP quantification has been limited by relatively insensitive assays and laborious pretreatment of urine sample i.e. dialysis, gel filtration, ultracentrifugation, freezing, incubation with detergents and pH adjustment [14]. Most of the assays require freezing of the urine for 24 hours followed by dilution in water or buffer at 1:20 to 1:100 before analysis in order to keep the THP soluble for quantification [11, 12, 14].
We developed an ELISA method for quantifying urinary THP. Wheat germ from Tirticum vulgaris (WGA) that specific to THP [15] was used to coat microtiter plates for capturing of urinary THP. WGA is a type of lectin that is specific to the receptor of THP [15]. WGA binds specifically to the di N-acetylglucosamine and sialic acid on the receptor of THP [15] but bind weakly to human chorionic gonadotropin that was excreted abundantly in urine of pregnant women [16]. The captured THP was recognized by an anti-THP antibody and the Ab-Ag complexes were then recaptured by a secondary antibody tagged with horseradish peroxidase (HRP), the amount of THP was quantified based on the intensity of the color reaction developed between the HRP and its substrate. Its reliability as screening assay for kidney stone disease is determined.
Methods
Urine specimen collection
Urine samples were collected from kidney stone patients provided by the Urology Clinic, General Hospital, Pulau Pinang and Lam Wah Ee Hospital, Pulau Pinang, Malaysia. Two cohorts were recruited in this study i.e. 58 stone formers (34 male, 24 female) age range from 28 – 74 years and 117 healthy subjects (41 male, 76 female) age range from 20 – 86 years. The stone formers comprise 39 staghorn calculi (23 male, 16 female) and 19 acute renal calculi (11 male, 8 female). All the stone formers were confirmed by radiography using Plain Abdominal Radiography (KUB) and/or Intravenous Urography (IVU) and they were afflicted by partial obstruction and non obstruction kidney stones. They have not been treated by surgery or medication. Healthy subjects had no previous history of kidney stones or other nephrolithiasic related diseases included staffs and students of the School of Pharmaceutical Sciences, USM and nurses from the nursing institute of Lam Wah Ee Hospital, Penang. The exclusion criterion for urine is a urinary creatinine concentration < 2.00 mmol/L or >19.00 mmol/L, normal range is 2.20 – 19.00 mmol/L based on the Cayman Chemical Creatinine Assay. Aliquots urine samples were stored at -20oC prior to the assay.
Urinary Creatinine Assay
Creatinine assay was carried out according to Cayman Chemical Creatinine Assay (Cayman Chemical Company, UK). The assay relies on Jaffe's reaction, wherein a yellow or orange color is formed when the metabolites are treated with alkaline picrate [17]. The color derived from the creatinine is destroyed at acidic pH. The difference in color intensity measured at OD495 before and after acidification is proportional to the creatinine concentration [17]. A creatinine standard curve was constructed for urine creatinine concentration determination.
Materials for ELISA
Capture material used for coating was WGA, a type of lectin from Triticum vulgaris (Sigma) and was purified by affinity chromatography. The primary antibody was a polyclonal anti-THP antibody (Biomedical Technologies Inc, USA) raised in rabbit and was claimed to have no significant cross reaction with other proteins by manufacturer. The secondary antibody was goat anti-rabbit IgG (H+L) horseradish peroxidase conjugate (BioRad). Substrate was TMB (3,3',5,5' Tetramethylbenzine, 1 mg) (Sigma). TMB substrate solution was freshly prepared by dissolving a tablet of TMB in 1 mL of dimethyl sulfoxide (DMSO) (Sigma) and added to 9 mL of 0.05 M phosphate-citrate buffer, pH 5.0. A volume of 2 μL 30% H2O2 was added to 10 mL of substrate solution.
Preparation of Standards and QC Materials
The standard THP was prepared from pooled normal urines using salt precipitation (1mL urine : 0.27g ammonium sulphate) and calibrated against commercial THP (Biomedical Technology, Inc., 1 μg/μL). The standard had a concentration of 945 ng/mL THP and was serial diluted to produce solutions with THP concentrations of 417, 236, 165, 123 and 109 ng/mL. The standards were used to construct standard curves for the assay. For long term storage, the standards were lyophilized, stored at -20oC and re-suspended in TEA buffer (0.5% Triton X-100, 20 mM EDTA, pH 7.5) before use. The lyophilized standards were stable for at least 6 months. In addition, three quality control (QC) samples at THP concentrations 908, 538 and 123 ng/mL were prepared in TEA buffer and labeled QC1, QC2 and QC3, respectively. The QC samples were aliquoted in microcentrifuge tubes at 300 μL/tube. For long term storage, the QC samples were lyophilized, stored at -20oC and re-suspended in TEA buffer before use.
Coating of Microtiter Plate
Each well on the 96-wells microtiter plate (Maxisorp™, Nunc) was coated with 100 μL of 10 μg/mL lectin WGA in coating buffer [5.0 mM Na2CO3, 34.9 mM NaHCO3, 0.02% (v/v) NaN3, pH 9.6]. The plates were covered with parafilm and incubated at 4oC overnight with shaking (100 rpm) on an orbital shaker (Protech). The plates were washed five times with freshly prepared washing buffer (0.1% Tween 20 in 10 mM phosphate buffer saline (PBS) pH 7.2 for 5 min each. The unoccupied sites on the microtiter plates were blocked with 200 μL blocking buffer (3% BSA in 10 mM PBS, pH 7.2) and incubated at room temperature for 2 hours with a slow rotation (50 rpm) on the orbital shaker. The plate was washed five times with washing buffer for 5 min each wash and dried in an oven at 37oC for 3 hours or until thoroughly dried. Finally, the plates were cooled to room temperature and sealed with an adhesive plate seal, wrapped in aluminum foil and stored at 4oC.
ELISA Screening Procedure for THP Measurement
WGA coated plates were brought to room temperature before use. The standards and QC samples were vortexed gently and added at 100 μL/well into the coated microtiter plate wells. The frozen samples were stabilized at room temperature and diluted 1:10 in TEA buffer. Urine samples and standards (109 – 945 ng/mL) were run in duplicate, and QC samples (908 ng/mL, 538 ng/mL and 123 ng/mL) were run in triplicate. TEA buffer was used as blank. After 1 hour incubation at 37oC, the plates were washed five times (rotation, 50 rpm) with 300 μL freshly prepared wash buffer (0.1% Tween 20 in 10 mM PBS, pH 7.2). The plates were placed top down on absorbent paper to remove residual buffer. Hundred microliter of 1:10,000 dilution anti-THP antibody in antibody diluent buffer (2% BSA, 0.1% Tween 20, 0.02% NaN3 in 10 mM PBS, pH 7.2) was dispensed in each well and the plates were incubated at 37oC for 1 hour. The plates were washed five times (rotation, 50 rpm) with 300 μL of freshly prepared wash buffer and the residual buffer was removed on absorbent paper. The plates were incubated at 37oC for 1 hour after adding the same volume of goat anti-rabbit IgG (H+L) horseradish peroxidase conjugate diluted 1:3,000 in antibody diluent. The plates were washed five times (rotation, 50 rpm) with 300 μL of freshly prepared wash buffer and residual buffer was removed on absorbent paper.
Colour was developed by adding 100 μL of TMB substrate solution to each well. The plates were incubated on orbital shaker (100 rpm) for 15 min at room temperature in the dark. The reaction was stopped by adding 100 μL of 4 M H2SO4 to each well. OD450 and OD620 (Thermo Labsystems Multikan Ascent, Finland) were read immediately. Urinary THP concentration was determined by referring to the standard curve.
SDS-PAGE for THP Measurement
The aliquot urine (1 mL) was thawed to room temperature and then added with 0.27 g ammonium sulphate, (NH4)2SO4. After vortex-mixing for 2 minute, the urine was centrifuged at 10,000 rpm for 20 minutes at 20oC and the supernatant decanted. The pellet was collected and dissolved in 80 μL of solubilizing buffer [10 mM Tris, 1 mM EDTA, 1% (w/v) SDS, pH 8.8] and vortex-mixed gently for 2 minutes. The mixture was then added with 20 μL reducing sample buffer, vortex-mixed and heat at 100oC for 10 minutes. After the mixture cool to room temperature, 10 μL of the mixture was loaded into each well of mini-slab gel. One microliter of the commercial THP standard (1 μg/μL) was loaded in separated well alongside the samples. Electrophoresis system used for quantification of THP was mini-slab gel (Protean 3, BioRad) composed of 4% stacking gel and 10% resolving gel with a gel thickness of 0.75 mm and gel size 8 x 7 cm. The electrophoresis run was at 200 volt for 50 minutes. The relative intensity of the bands was analyzed using Quantity One 1-D software of VersaDoc Imaging System (BioRad).
Assay Validation
Urine samples from 117 healthy subjects and 58 stone formers were assayed using a reference method namely SDS-PAGE, where the intensity of THP bands was quantify relatively to commercial THP at 1 μg/μL concentration. Using SDS-PAGE as the reference method, we defined true positive (TP) as urine with THP concentration below the cut-off value set when measured with both ELISA and SDS-PAGE methods while true negative (TN) as urine with THP concentration above the cut-off value set when measured with both ELISA and SDS-PAGE methods. In contrary, false positive (FP) were urine with THP concentration above cut-off value with SDS-PAGE but below cut-off value with ELISA and vice-versa with false negative (FN) urine. Sensitivity is calculated as TP/ (TP + FN) whereas specificity is TN/ (TN + FP) [18]; the results of both calculations are expressed as percentages.
Precision of the assay included repeatability and reproducibility [18]. The repeatability (within day precision) was calculated by the coefficient of variation (C.V.) for each set of the QC materials that were run on the same day, whereas reproducibility (between day precision) was calculated from the average of the within assay precision of each QC materials analyzed in three runs at different day. Assay accuracy was percentage of the average concentration of standard THP as compared to the reported concentration of the commercial THP.
Data analysis
Data was analysed by using the Statistical Package for Social Sciences (SPSS, version 15.0). For the correlation studies, Pearson correlation coefficient was employed and the level of significance was set to alpha = 0.01. Student's t-test was used to determine statistical significance between cohort groups (alpha = 0.05). Chi-square test was applied for correlation analysis between ELISA method and the reference method, SDS-PAGE.
Results
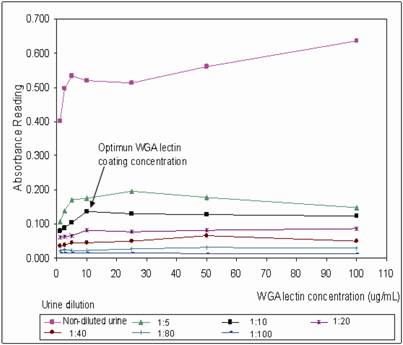
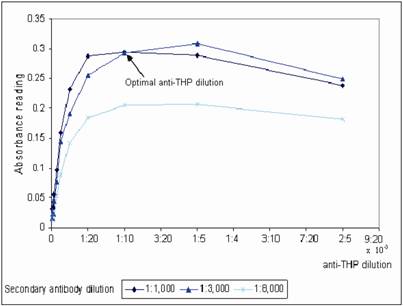
WGA coated mircotiter plates were prepared in batch-wise and stored at 4˚C. The plates were brought to room temperature before use. The optimum plate coating concentration for WGA was tested by coating the plate with a series of WGA concentration range from 1 – 100 μg/mL. The coated plates were then tested with non-diluted and a range of diluted urine from 1:5 to 1:100 dilution (Figure 1). At 1:10 urine dilution, the optimum WGA concentration for plate coating was found to be 10 μg/mL, where binding of urinary THP to WGA was a linear function from 1 – 10 μg/mL WGA, increasing in WGA concentration after 10 μg/mL does not improve the OD of the assay. Bovine serum albumin (BSA) was used to block the non-lectin binding sites on the plate since THP does not bind to BSA [19]. The WGA microtiter plates were sealed and stored at 4oC where they were stable for at least 6 weeks. Aggregation of THP results in reduced detection of the glycoprotein, optimum urine dilution with maximum disaggregation of THP occurring at 1:10 dilution (Figure 1). Increasing the urine dilution beyond this point reduced the detection of THP. The optimal primary and secondary antibody dilutions were found at 1:10,000 and 1:3,000, respectively (Figure 2).
Determination of the optimal concentration of WGA for coating onto microtiter plate. A series of diluted WGA from 1 - 100 μg/mL were investigated at a serial diluted urine (1:5, 1:10, 1:20, 1:40, 1:80, 1:100) and non-diluted urine. The anti-THP dilution and secondary HRP conjugate dilution were 1:10,000 and 1:3,000, respectively. The optimum WGA coating concentration was 10 μg/mL for urine diluted at 1:10.
Determination of the optimal anti-THP dilution and secondary antibody dilution for THP measurement. A serial dilution of anti-THP from 1:2,500 – 1:280,000 in antibody diluent were evaluated in three different dilution factor of secondary antibody that were 1:1,000, 1:3,000 and 1:8,000 diluted in same buffer, respectively. The microtiter plate was coated with 10 μg/mL WGA.
We validated the ELISA based on assay linearity, accuracy, repeatability and reproducibility. The assay had a linearity of r2 > 0.999 for the THP concentration range from 109 ng/mL to 945 ng/mL. The assay accuracy range from 97.7% to 101.2% over the range of THP concentrations from 109 ng/mL to 945 ng/mL (Table 1). The precision (C.V.) of each QC samples in triplicates was consistently < 10% (Table 2). Assay repeatability was < 4% C.V. and assay reproducibility was < 5% C.V. as measured by using the three QC samples (Table 2).
Accuracy of the assay
| Commercial THP concentration (ng/mL) | standard THP concentration (ng/mL) (n=3) | Mean standard THP concentration (ng/mL) | Standard Deviation (SD) | Coefficient of Variation (C.V.) | Accuracy | ||
|---|---|---|---|---|---|---|---|
| 1 | 2 | 3 | |||||
| 945.67 | 942.38 | 943.47 | 943.32 | 943.06 | 0.59 | 0.06 | 99.7% |
| 417.50 | 428.14 | 427.55 | 423.10 | 426.26 | 2.76 | 0.65 | 102.1% |
| 236.33 | 232.68 | 229.83 | 239.00 | 233.84 | 4.69 | 2.01 | 99.0% |
| 165.50 | 163.98 | 156.43 | 164.45 | 161.62 | 4.50 | 2.79 | 97.7% |
| 123.33 | 125.16 | 128.67 | 120.76 | 124.86 | 3.97 | 3.18 | 101.2% |
| 109.33 | 105.33 | 111.70 | 107.04 | 108.02 | 3.30 | 3.05 | 98.8% |
The repeatability and precision of the assay. The measurements of QC materials were carried out over 3 days.
| Repeatability (within day precision) | |||
|---|---|---|---|
| OD reading | THP concentration (μg/mL) | ||
| QC 1 | QC 2 | QC 3 | |
| 1 | 905.33 | 561.20 | 126.83 |
| 2 | 851.13 | 540.94 | 121.57 |
| 3 | 921.14 | 513.05 | 122.10 |
| 4 | 855.34 | 556.39 | 123.00 |
| 5 | 816.35 | 538.13 | 129.57 |
| 6 | 816.02 | 513.45 | 127.14 |
| Average | 860.89 | 537.19 | 125.04 |
| Standard Deviation | 44.11 | 20.53 | 3.26 |
| Coefficient of Variation | 5.1% | 3.8% | 2.6% |
| Reproducibility (between day precision) | |||
| OD reading (n=3) | THP concentration (μg/mL) | ||
| QC 1 | QC 2 | QC 3 | |
| Day 1 | 829.23 | 535.99 | 132.74 |
| Day 2 | 908.31 | 538.40 | 123.50 |
| Day 3 | 896.10 | 593.43 | 126.57 |
| Average | 877.88 | 555.94 | 127.60 |
| Standard Deviation | 42.57 | 32.49 | 4.71 |
| Coefficient of Variation | 4.9% | 5.8% | 3.7% |
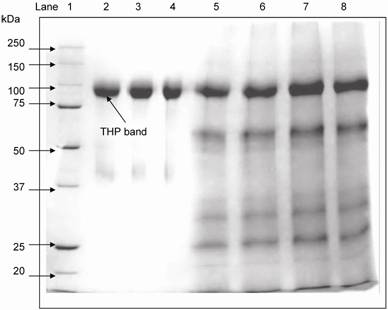
SDS-PAGE was used to separate the urinary proteins and THP band was detected at 97 kDa (Figure 3). The relative intensity of urinary THP to standard THP was used to estimate the concentration of urinary THP. Figure 4 shows the scatter plot of THP as measure by ELISA and SDS-PAGE where the THP concentration by ELISA was correlated positively to that of SDS-PAGE (r = 0.648, P = 0.0004).
Electrophoretic mobility of commercial THP and standard THP used for THP quantification in reference SDS-PAGE method. THP was detected at 97 kDa. Lane 1: molecular markers, lane 2 – 4: commercial THP and lane 5 – 8: urinary THP from healthy subjects after salt precipitation.
The correlation between ELISA and SDS-PAGE methods in measurement of urinary THP concentrations. The □ symbols represent an individual urine sample with its corresponding THP concentrations as measured by the methods. The THP concentrations assayed by ELISA method was correlated positively to SDS-PAGE (r = 0.648, P = 0.0004). The level of significance according to Pearson correlation of coefficient was set to alpha = 0.01.
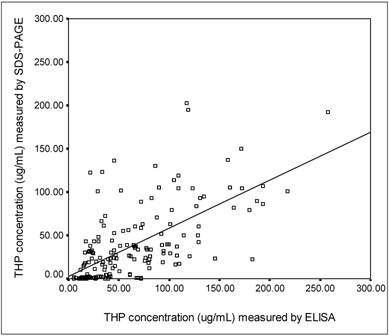
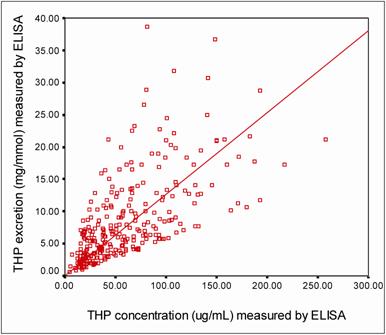
Figure 5 shows a strong positive correlation (r = 0.649, P = 0.0002) between THP concentrations and THP excretions (THP/Creatinine ratio) as measured by ELISA. By using description statistic analysis, the 95% confident interval of THP concentration in the healthy subjects was 55.00 – 77.90 μg/mL for male and 70.70 – 96.10 μg/mL for female. The THP excretion for female healthy subjects was significantly higher (THP excretion = 12.32 ± 0.86 mg/mmol, P = 0.029) than that of their counterpart (Table 3). There was no significant difference in THP concentration or THP excretion due to sex for stone formers. However significant differences in the THP concentration (26.00 ± 2.2 μg/mL, P = 0.0002) and THP excretion (4.02 ± 0.40 mg/mmol, P = 0.0001) were observed between stone formers and healthy subjects (Table 3).
The correlation between THP concentration and THP excretion measured by ELISA. The □ symbols represent an individual urine sample with its corresponding THP concentration and THP excretion. The THP concentration was correlated positively to THP excretion (r = 0.649, P = 0.0002). The level of significance according to Pearson correlation of coefficient was set to alpha = 0.01.
The average age, Creatinine concentration, THP concentration and THP/Creat ratio in healthy subjects, stone formers and subgroup of stone formers
| No. of sample | Age (Age range) (Years) | Creatinine concentration (mmol/L) | THP concentration (μg/mL) | THP/Creat ratio (mg/mmol) | |
|---|---|---|---|---|---|
| Healthy subjects | 117 | 32 (18 – 86) | 8.14 ± 0.40 | 77.66 ± 4.68 | 11.23 ± 0.68 |
| Male | 41 | 52 (19 – 86) | 9.15 ± 0.74 | 67.05 ± 5.97 | 9.25 ± 1.02 |
| Female | 76 | 21 (18 – 60) | 7.59 ± 0.46 | 83.38 ± 6.37 | 12.30 ± 0.86ª |
| Stone formers | 58 | 52 (28 – 74) | 7.94 ± 0.54 | 26.03 ± 2.21* | 4.02 ± 0.40† |
| Male | 34 | 52 (36 – 74) | 7.50 ± 0.67 | 24.56 ± 2.56 | 4.06 ± 0.55 |
| Female | 24 | 52 (28 – 68) | 8.57 ± 0.88 | 28.10 ± 3.96 | 3.95 ± 0.58 |
| Subgroup of stone formers | |||||
| Staghorn calculi | 39 | 50 (29 – 67) | 8.62 ± 0.71 | 26.80 ± 3.02 | 3.86 ± 0.53 |
| Acute renal calculi | 19 | 55 (28 – 74) | 6.55 ± 0.63 | 24.45 ± 2.76 | 4.34 ± 0.58 |
Footnote: All the value expressed as mean ± SE. Symbol ªindicates significant compared with male healthy subjects, P = 0.029; * significant compared with healthy subjects, P = 0.0002 and † significant compared with healthy subjects, P = 0.0001.
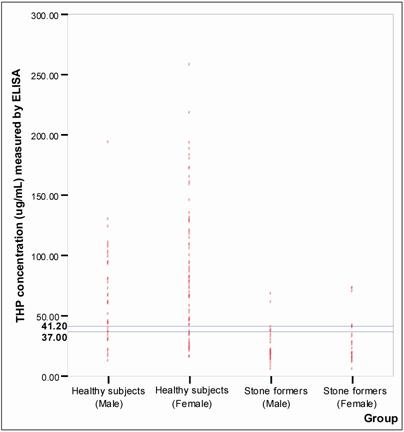
Figure 6 shows the distribution of THP concentration detected in healthy subjects and the stone formers. The best fit line to distinguish healthy subjects from stone formers was found at 37.00 μg/mL and 41.20 μg/mL THP concentrations (P < 0.05) for male and female, respectively. Using these cut off values, the specificity and sensitivity of the assay were 80% and 86%, respectively (Table 4).
Establishing of cut-off points for ELISA. The o symbols represent individual urinary THP concentration. The horizontal line indicated cut-off values selected for ELISA. The selected cut-off value for male was 37.00 μg/mL and for female was 41.20 μg/mL. The number of healthy subjects and stone formers tested were 117 and 58, respectively.
Sensitivity and specificity of the developed ELISA.
| SDS-PAGE method | |||
|---|---|---|---|
| Quantitatively high of urinary THP | Quantitatively low of urinary THP | ||
| ELISA method | Quantitatively high of urinary THP | 94 | 8 |
| Quantitatively low of urinary THP | 23 | 50 | |
| ELISA performance | Specificity = 80% | Sensitivity = 86% | |
Discussion
Tamm Horsfall glycoprotein has been identified as a useful urinary biomarker to determine the formation of a kidney stone. Upon evaluation of 117 healthy subjects and 58 stone formers by the currently developed ELISA, we found that THP can be used as a reliable biomarker for screening of kidney stone disease. The used of THP as biomarker for kidney stone disease was verified using SDS-PAGE, whereby a positive correlation (r = 0.648, P = 0.0004) between the SDS-PAGE and ELISA was observed. Although it is based on the common ELISA principle, we have shown that it is a cost effective and reliable screening assay.
In the preparation of the microtiter plate for capturing the urinary THP, WGA that is specific to THP is chosen. Binding of WGA to THP is through the di N-acetylglucosamine and sialic acid on the receptor of THP [15], however reports had shown stone formers excreted molecular defective urinary THP that devoid of sialic acid [10, 13] and thus may lower the detection of THP in the stone formers by ELISA. However, since low THP detection indicates stone formation, it will not interfere with the interpretation of positive result for stone formation. Nevertheless, we believe that low THP in the stone formers are of pathogenic importance and is due to a qualitative factor that is depressed synthesis or decreased cellular secretion of THP [11, 20] rather than quantitative defect. The binding of THP to the WGA is proportional to the amount of free THP in the urine as aggregation of THP results in hidden binding sites. The optimum urine dilution with maximum amount of free THP was found to be at 1:10 urine dilution. In addition, TEA buffer was found to be the best dilution buffer for the samples, standards and QCs. Whereby it contains Triton X-100 that enhances THP dissociation and EDTA that reduces the effects of Ca2+ chelation [14]. The pH of TEA buffer at 7.5 helps to solubilize THP and keeping it in a homogenous form [14, 21, 22]. Freezing of urine sample for 24 hours prior to analysis is required to produce consistent and reproducible results, which is agreed with those of Kobayashi & Fukuoka [21] and Goodall & Marshall [23]. Antibody is the most costly item in the development of immunoassay based technique. Therefore, it determines the cost of the assay. In this study, we minimized the wastage of antibody by selecting an optimum antibody dilution with the least amount of antibody usage but sufficient to give good sensitivity of the assay. The developed assay was validated to ensure its reliability in providing useful, consistent results [18].
Previous publications have shown that calcium stone formers as a group do not have reduced levels of urinary THP that may cause by renal obstruction and reduced renal function [24], although uric acid stone formers might [25]. In this study, urine was collected from patients irrespective of stone types whom were afflicted with partial or non obstructing stones, the data shown that reducing of urinary THP does not correspond to the degree of renal obstruction.
Urinary creatinine concentration is used as the correction factor for the effect of urine hydration on analyte concentration [26]. We used urinary creatinine concentration to estimate daily THP excretion, which was expressed as THP/Creat ratio. False positive samples were the main reason for reduced specificity of the assay. 20% of the healthy subjects had low THP concentration by ELISA but was found otherwise with SDS-PAGE. These healthy subjects were with no previous records of kidney stone disease and no symptoms of kidney stone disease at the time when urine was collected. False positive results detected in healthy subjects may be attributed by self-aggregation of THP molecules in acidic urine [12, 27], variation in sialic acid content of THP [10] and reduce in THP excretion in acidic urine [28]. In contrary, 14% of the stone formers was found to have high THP concentration by ELISA but low with SDS-PAGE, Since acidic urine may cause aggregation of THP, we adjusted the pH of these samples to 7.4 prior to SDS-PAGE analysis and detect no significant change in THP intensity.
Despite of these exceptional cases, the rest of the healthy subjects and stone formers can be diagnosed correctly using the currently developed assay. The assay can be effectively used as a method for prediction of kidney stone disease, whereby the patients whom were presented with certain clinical symptoms can be screened using this assay.
The cost of assaying each sample in duplicate is approximately USD0.35 and within 5 hours, 37 samples can be assayed alongside full range standards to construct a calibration curve and 3 QCs in each plate, whereby an analyst will be able to handle 3 plates concurrently. Furthermore, sample preparation is relatively easy where urine sample was diluted 10 times in TEA buffer. In view that kidney stone disease is the most common nephrolithiasic related disease, this non-invasive ELISA method may be the answer for screening of kidney stone disease prior to confirmation by using radiogram.
Acknowledgements
We thank the staff and patients of the urology clinics at Penang General Hospital, Lam Wah Ee hospital, and the students and staff of the School of Pharmaceutical Sciences, USM for providing the urine specimens in this study.
Conflict of Interest
The authors have declared that no conflict of interest exists.
References
1. Sandhu C, Anson KM, Patel U. Urinary tract stones - Part I: Role of radiological imaging in diagnosis and treatment planning. Clin Radiol. 2003;58(6):415-421
2. Lewandowski S, Rodgers AL. Idiopathic calcium oxalate urolithiasis: risk factors and conservative treatment. Clinica Chimica Acta. 2004;345:17-34
3. Tamm I, Horsfall FL. Characterization and separation of an inhibitor of viral hemagglutination present in urine. Proc Soc Exp Med. 1950;74:108-114
4. Gokhale JA, Glenton PA, Khan SR. Characterization of Tamm-Horsfall protein in a rat nephrolithiasis model. J Urol. 2001;166:1492-1497
5. Gokhale JA, Mckee MD, Khan SR. Immunocytochemical localization of Tamm-Horsfall protein in the kidneys of normal and nephrolithic rats. Urol Res. 1996;24:201
6. Rindler MJ, Naik SS, Li N, Hoops TC, Peraldi MN. Uromodulin (Tamm-Horsfall glycoprotein/uromucoid) is a phosphatidylinositol-linked membrane protein. J Biol Chem. 1990;265:20784-20789
7. Cavallone D, Malagolini N, Serafini-Cessi F. Mechanism of release of urinary Tamm-Horsfall glycoprotein from the kidney GPI-anchored counterpart. Biochem Biophys Res Commun. 2001;280:110-114
8. Serafini-Cessi F, Malagolini N, Hoops TC, Rindler MJ. Biosynthesis and oligosaccharide processing of human Tamm-Horsfall glycoprotein permanently expressed in HeLa cells. Biochem Biophys Res Commun. 1993;194:784-790
9. van Rooijen JJM, Kamerling JP, Vliegenthart JFG. Sulfated di-, tri- and tetraantennary N-glycans in human Tamm-Horsfall glycoprotein. Eur J Biochem. 1990;256:471-487
10. Knörle R, Schnierle P, Koch A, Buchholz NP, Hering F, Seiler H, Ackermann T, Rutishauser G. Tamm-Horsfall glycoprotein: role in inhibition and promotion of renal calcium oxalate stone formation studied with Fourier-Transform Infrared spectroscopy. Clin Chem. 1994;40(9):1739-1743
11. Ganter K, Bongartz D, Hesse A. Tamm-Horsfall protein excretion and its relation to citrate in urine of stone-forming patients. Urology. 1999;53:492-295
12. Glauser A, Horhreiter W, Jaeger P, Hess B. Determinants of urinary excretion of Tamm-Horsfall protein in non-selected kidney stone formers and healthy subjects. Nephrol Dial Transplant. 2000;15(3):1580-1587
13. Schnierle P, Hering F, Seiler H. A simple diagnostic method for the differentiation of Tamm-Horsfall glycoproteins from healthy probands and those from recurrent calcium oxalate renal stone formers. Experientia. 1995;51:1068-1072
14. Dawnay ABSJ, Thornley C, Cattell WR. An improved radioimmunoassay for urinary Tamm-Horsfall glycoprotein: Investigation and resolution of factors affecting its quantification. Biochem J. 1982;206:461-46
15. Wu AM, Watkins WM, Chen CP, Song SC, Chow LP, Lin JY. Native and/or asialo-Tamm-Horsfall glycoprotein Sd(a+) are important receptors for Triticum vulgaris (wheat germ) agglutinin and for three toxic lectins (abrin-a, ricin and mistletoe toxic lectin-I). FEBS. 1995;371:32-34
16. Kelly LS, Birken S, Puett D. Determination of hyperglycosylated human chorionic gonadotropin produced by malignant gestational trophoblastic neoplasias and male germ cell tumors using a lectin-based immunoassay and surface plasmon resonance. Mol Cel Endocrinol. 2007;260:33-39
17. Peake M, Whiting M. Measurement of Serum Creatinine - Current Status and Future Goals. Clin Biochem Rev. 2006;27(4):173-184
18. Jacobson RH. Principles of validation of diagnostic assay for infectious disease. Manual of standards for diagnostic tests and vaccines. France: OIE. 1996:8-15
19. Rhodes DCJ. Binding of Tamm-Horsfall protein to complement 1q measured by ELISA and resonant mirror biosensor techniques under various ionic-strength conditions. Immunol Cell Biol. 2000;78:474-482
20. Romero MC, Zanaro N, González L, Trigo P, Imventarza O, Nesse A. Tamm-Horsfall protein excretion to predict the onset of renal insufficiency. Clin Biochem. 2002;35:65-68
21. Kobayashi K, Fukuoka S. Conditions for solubilization of Tamm-Horsfall protein/uromodulin in human urine and establishment of a sensitive and accurate Enzyme-linked Immunosobent Assay (ELISA) method. Arch Biochem Biophys. 2001;388(1):113-120
22. Olczak T, Kubicz A, Kokot F, Dulawa J. Tamm-Horsfall protein isolated from urine of pregnant and non-pregnant women has similar oligosaccharides. Eur J Clin Invest. 1998;28(6):475-82
23. Goodall AA, Marshall RD. Effects of freezing on the estimated amounts of Tamm-Horsfall glycoprotein in urine, as determined by radioimmunoassay. Biochem J. 1980;189:533-539
24. Bichler KH, Kirchner C, Ideler V. Uromucoid excretion of normal individuals and stone formers. Br J Urol. 1976;47:733-738
25. Bichler K, Mittermuller B, Strohmaier WL, Feil G, Eipper E. Excretion of Tamm-Horsfall protein in patients with uric acid stones. Urol Int. 1999;62:87-92
26. Newman DJ, Pugia MJ, Lott JA, Wallace JF, Hiar AM. Urinary protein and albumin excretion corrected by creatinine and specific gravity. Clinica Chimica Acta. 2000;294:139-155
27. Hess B. Tamm-Horsfall glycoprotein and calcium nephrolithiasis. Miner Electrolyte Metab. 1994;20(6):393-398
28. Romero MC, Nocera S, Nesse AB. Decreased Tamm-Horsfall protein in lithiasic patients. Clin Biochem. 1997;30:63-67
Author contact
![]() Correspondence to: Lay-Harn Gam, School of Pharmaceutical Sciences, Universiti Sains Malaysia, 11800 USM. Penang, Malaysia. Telephone: 604-6533888 ext 2208 Fax no: 604-6570017. e-mail: layharnmy
Correspondence to: Lay-Harn Gam, School of Pharmaceutical Sciences, Universiti Sains Malaysia, 11800 USM. Penang, Malaysia. Telephone: 604-6533888 ext 2208 Fax no: 604-6570017. e-mail: layharnmy