Impact Factor ISSN: 1449-2288

 Global reach, higher impact
Int J Biol Sci 2008; 4(4):236-244. doi:10.7150/ijbs.4.236 This issue Cite
Research Paper
PPAR gamma agonist normalizes glomerular filtration rate, tissue levels of homocysteine, and attenuates endothelial-myocyte uncoupling in alloxan induced diabetic mice
Walter E. Rodriguez#, Utpal Sen#, Neetu Tyagi, Munish Kumar, Gene Carneal, Deep Aggrawal, Justin Newsome, Suresh C. Tyagi ![]()
Department of Physiology and Biophysics, University of Louisville School of Medicine, Louisville, Kentucky, USA
# Co-first authors contributed equally.
Received 2008-6-25; Accepted 2008-8-5; Published 2008-8-6
Abstract
Background: Homocysteine (Hcy) is an independent cardiovascular risk factor; however, in diabetes, the role of tissue Hcy leading to cardiac dysfunction is unclear.
Aims: To determine whether tissue Hcy caused endothelial-myocyte uncoupling and ventricular dysfunction in diabetes.
Methods: Diabetes was created in C57BL/6J male mice by injecting 65 mg/kg alloxan. To reverse diabetic complications, ciglitazone (CZ) was administered in the drinking water. Plasma glucose, Hcy, left ventricular (LV) tissue levels of Hcy and nitric oxide (NO) were measured. Glomerular filtration rate (GFR) was measured by inulin-FITC. Endothelial-myocyte coupling was measured in cardiac rings. In vivo diastolic relaxation and LV diameters were measured by a Millar catheter in LV and by M-mode echocardiography, respectively.
Results: Plasma glucose, GFR and LV tissue Hcy were increased in diabetic mice and were normalized after CZ treatment; whereas, elevated plasma Hcy level remained unchanged with or without CZ treatment. NO levels in the LV were found inversely related to tissue Hcy levels. Attenuated endothelial-myocyte function in diabetic mice was ameliorated by CZ treatment. Cardiac relaxation, the ratio of LV wall thickness to LV diameter was decreased in diabetes, and normalized after CZ treatment.
Conclusion: CZ normalized LV tissue levels of Hcy and ameliorated endothelial-myocyte coupling; therefore, specifically suggest the association of LV tissue Hcy levels with impair endothelial-myocyte function in diabetes.
Keywords: cardiac rings, ciglitazone, homocysteine, GFR, PPARγ, cardiac function
1. Introduction
Sixteen percent of the myocardial mass is capillaries and capillaries are made up of lumen and endothelium [1]. The capillary endothelium is embedded in the muscle, and plays an important role in myocardial diastolic relaxation [2]. Nitric oxide (NO) from the endocardial endothelium contributes to the regulation of myocyte relaxation [3]. A gradient of NO concentration (i.e. high in endocardium and low in midmyocardium) has been depicted [3] that is consistent with the notion that there is more capillary endothelium in the endocardium than in epi- or mid-myocardium. The importance of endocardial endothelium in cardiac contraction and relaxation is illustrated by the attenuated responses to CaCl2 and acetylcholine in the endothelium-denuded myocardium [4, 5]. In addition, the contractile response to endothelin-1 was increased in endothelium-denuded myocardial rings [6]. Thus, the paracrine modulation of cardiac myocyte function by endothelial cell factors is an important mechanism contributing to the overall regulation of cardiac contractile function, both in physiological and pathological states [7].
Homocysteine (Hcy) is a non-protein, sulfur-containing amino acid formed during the metabolism of methionine in the body. Reduced kidney function and volume retention has been associated with Hcy accumulation in the plasma and tissues [8], which leads to endothelial damage [9].
In an experimental study of insulin resistant (obese) type 2 diabetes, an improvement of insulin resistance with intravenous insulin over a period of 17 days did not alter Hcy levels [10]. However, several lines of evidence suggest a higher risk of heart disease associated with 5 µmol/L (plasma) increases in Hcy among a diabetic group compared to a non-diabetic group. Therefore, it is important to keep track of Hcy levels in diabetics. In a diabetic rabbit model, concentrations of Hcy in the physiologic range dramatically inhibited arterial nitric oxide formation, but had no effect in non-diabetic animals [11]. Although in diabetes, nitric oxide concentrations decreases, the relationship between Hcy and insulin is ambiguous. However, the role of Hcy in impairment of endothelial nitric oxide metabolism is unequivocal.
Renal hyper filtration in a diabetic subject without nephropathy was associated with increased Hcy catabolism and clearance [12]. Insulin reduces the circulating levels of other amino acids [13] and perhaps, promotes the uptake of Hcy into tissues which result in increased tissue Hcy [8]. The peroxisome proliferator-activated receptor-γ (PPARγ) that belongs to the family of nuclear receptor is associated with type-2 diabetes and is directly related to blood glucose [14]. Although renal clearance plays a significant role in Hcy clearance, the contributions of high glucose, insulin and other factors in tissue Hcy accumulation are very important but not well studied. In the present study we tested our hypothesis that increase in tissue Hcy level, but not the plasma Hcy level, instigates endothelial-myocyte uncoupling. This leads to cardiac dysfunction in diabetic-cardiomyopathy.
2. Materials and Methods
2.1. Diabetic mouse model
The mice were divided into five groups of six as described below. To create diabetes, alloxan (A) [Sigma Chemical Co, 65 mg/kg body weight] was injected by a single dose in the tail vein, and mice were sacrificed at 0, 1, and 10 weeks after alloxan injection. In this protocol, 0 wk was considered as the non-diabetic control. Mice were anesthetized with tribromoethanol (100 mg/kg i.p.), which has minimal effects on cardiovascular function in mice [15]. To induce PPARγ, 10 wks after alloxan, ciglitazone (CZ, CalBiochem Corp) 8 µg/ml was administered in the drinking water and the mice were sacrificed at 12 and 16 weeks (n=6 in each group). The non-diabetic controls for 1 and 10 weeks mice were used to compare with diabetic mice for 1 and 10 weeks. The diabetic CZ-treated animals of 12 and 16 weeks were compared with younger diabetic animals (i.e. before the start of the CZ treatment). Animal room temperature was maintained between 22oC and 24oC. A 12-hour light-dark cycle was maintained by artificial illumination. The investigation conforms to the Guide for the Care and Use of Laboratory Animals published by the US National Institutes of Health (NIH Publication No. 85-23, revised 1985). All animal procedures were reviewed and approved by the Institutional Animal Care and Use Committee of the University Of Louisville School Of Medicine. The animals were fed standard chow and water ad libitum. No mortality was observed at the end of the study protocol.
The amount of CZ (8 µg/ml) was soluble in aqueous conditions and was based on the fact that the binding constant between ciglitazone and PPARγ is in the micromolar range [16]. Based on the assumption that mice have a blood volume of ~2 ml and drink ~5 ml water/day, each ingested ~2 mg/kg/day CZ. This produced a blood concentration of ~32 µMole/L, which is enough to saturate most binding sites on PPAR. In humans, 100 mg/day PPAR agonist has a potent effect [17]. To determine whether the A and CZ treatment causes change in food and water intake, food and water intake were measured every 2-days during the treatment period. To determine if there was peroxisome proliferation, the livers were weighed at the end of the protocol. CZ (like other PPARγ agonists) may cause hepatotoxicity at higher dose [18], and hepatomegaly may be reflective of other pathologies rather than peroxisome proliferation. Therefore, we assessed microscopical observations of liver tissues at low doses of chronic CZ treatment. We observed hyperplasia and proliferation of the peroxisomes; however, the data is not shown in the present report.
2.2. Glucose and Hcy
To measure plasma glucose and Hcy, blood was collected in heparinized tubes from anesthetized mice. Glucose was measured using a Bio-Rad glucose measurement kit. Hcy was separated by HPLC and detected by a spectrophotometer [8].
2.3. Tissue NO and Hcy
Fresh tissue was homogenized in 50 mM Tris-Cl (pH 7.4) buffer. The levels of NO were measured by Griess method. Total, protein-bound and free Hcy were measured as described [8].
2.4. Glomerular filtration rate (GFR)
To demonstrate that levels of Hcy corroborate with renal glomerular filtration rate (GFR), GFR was measured using inulin-FITC as a marker in mice [19]. In brief, 0.3 mg/25 gram body weight inulin-FITC infused by Mini-osmotic pump model 2001D (alzet), 8 µl/hour, 1 day (I. P.), prior to placement of mice in metabolic cages. For a span of 24 hours, urine was collected. The levels of inulin in blood and urine were measured from a standard plot generated using inulin-FITC as the standard in the spectrofluorometer with emission at 530 nm and excitation at 488 nm. The control plasma and urine were used as references when inulin was measured in plasma and urine of inulin-FITC injected mice. To establish steady-state plasma inulin levels over the collection period and to determine variations among different mice, plasma inulin levels were measured in each animal. There were no significant differences in plasma inulin levels observed between different mice. The inulin excretion rate, µl/min/g of kidney weight was measured from each mouse.
2.5. Echocardiography and hemodynamic parameters
To determine in vivo cardiac diastolic relaxation, a Millar catheter was inserted into the LV through the right common carotid artery and M-mode echocardiography (Philips) was performed. The aortic blood pressure (BP), heart rate (HR), and systolic and diastolic blood pressure (SBP & DBP) were measured. After arterial pressure measurements, the catheter was advanced to the LV and LVP, EDP and -dP/dt were measured. Pulsatile arterial pressure signal was analyzed by a computer using customized software (Micro-Med Corp).
2.6. Preparation of endothelin-1, acetylcholine, nitroprusside, bradykinin, and alloxan solutions
The concentrations of endothilin-1, acetylcholine, nitroprusside, bradykinin, and alloxan were based on weight measurements. All dilutions from stock solutions were made in phosphate-buffered saline (PBS), prior to the experiment. PBS was used as a vehicle control.
2.7. Endocardial endothelial-myocyte function
To determine specific regional differences in contractile function, rings were prepared to include, or to exclude, the homogenous or non-homogeneous regions of the transmural myocardial wall [6]. The "deli" shape LV rings were mounted in a tissue myobath. One of the two mounted wires was connected to a force transducer. The ring was stretched and brought to a resting tension at which 10 nM endothelin-1 (ET-1) was added. At the maximum ET-1 contraction, acetylcholine (endothelial-dependent) or nitroprusside (endothelial-independent) was added. To minimize the differences due to orientation of cardiac muscle, the rings were rotated 90o and contraction was measured again. The average of these two contractions was recorded. The % relaxation was calculated based on 100% contraction to 10 nM ET-1 and dose-response curves were generated. To avoid ischemia, oxygen at 20 psi was continuously bubbled through the myobath. This was sufficient to penetration of cardiotonic agent [6]. The experiments were completed within 40 min during that time there was minimal injury due to ischemia [6].
2.8. Western blot analysis of PPARγ
The levels of PPARγ in the LV tissue homogenates was determined using anti-PPARγ antibody (Cyncam Inc). The secondary rabbit alkaline phosphatase conjugate anti-body was used as the detection system. To establish the specificity of PPARγ, anti-PPARγ-agarose conjugate was used to immuno-precipitate the total PPARγ content in the samples prior to loading it onto the gel/blot.
2.9. Statistical analysis
Values are given as mean ± SEM from n=6 in each group. Differences between groups were evaluated by using a two-way ANOVA, followed by the Bonferroni post hoc test [20], focusing on the respective effects of diabetes. The results of the 4 comparisons by Bonferroni test are reported as: *, compared to 0 wk. **, compared to 10 wks. A p < 0.05 was considered significant.
3. Results
3.1. Levels of PPARγ in diabetes
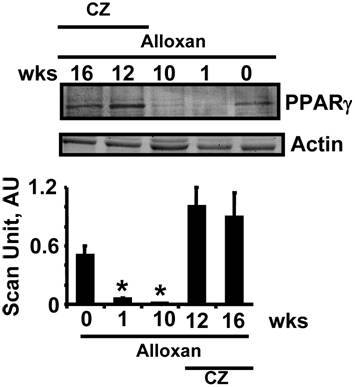
The levels of PPARγ were decreased in chronic diabetic model. The treatment with CZ mitigated this decrease (Fig. 1).
Western blot analysis of cardiac PPAR-γ: LV tissue homogenates were blotted with anti-PPAR-γ antibody. Mice at 0 (n=6), 1 (n=6) and 10 (n=6) weeks (wks). Other alloxan-treated mice received ciglitazone (CZ) and hearts were collected at 12 (n=6) and 16 (n=6) wks. Bar graphs represent the scanned values of PPAR-γ. * indicates p<0.005 when compared with 0 wk.
3.2. Plasma glucose and homocysteine (Hcy)
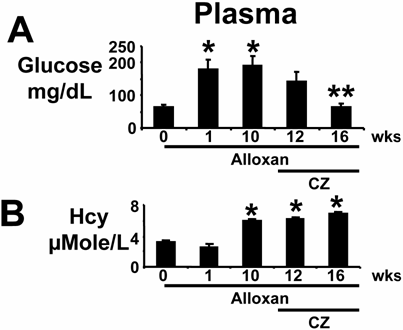
Plasma glucose levels increased within one week after alloxan injection. The levels were decreased after treatment with ciglitazone (CZ) (Fig 2A). Plasma Hcy levels were increased 10 weeks after alloxan injection, and remained elevated up to 16 weeks, with or without the CZ treatment (Fig. 2B). The observed results suggested severe diabetic complications in mice at 10 weeks compared to the non-diabetic controls. The mice recovered significantly from diabetic complications when treated with CZ as compared to untreated mice at 16 weeks. These results suggested that PPARγ agonist CZ ameliorated the hyperglycemia, and had no effect on plasma Hcy in alloxan-induced diabetes.
Plasma levels of glucose and homocysteine (Hcy): (A): Mice were treated with alloxan (A) and blood was collected from deeply anesthetized mice at 0 (n=6), 1 (n=6) and 10 (n=6) weeks (wks). Other alloxan-treated mice received ciglitazone (CZ) and blood was collected at 12 (n=6) and 16 (n=6) wks. Levels of glucose were compared to 0 wk, * indicates p<0.01 comparing to 0 wk. ** indicates p<0.02 comparing to 10 wks. (B): Plasma Hcy was separated with HPLC and measured by a spectrophotometer. * indicates p<0.005 when compared with 0 wk. Note that CZ ameliorated hyperglycemia. However, CZ did not change the levels of Hcy.
3.3. Glomerular filtration rate (GFR)
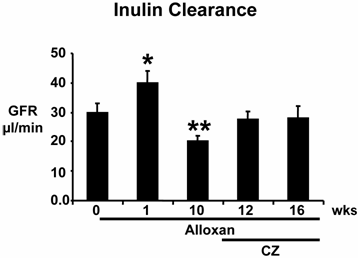
There was hyperfiltration at the onset of diabetes. GFR decreased significantly by the tenth week after alloxan injection compared to controls at 0 week, suggesting renal impairment in this model of diabetes. Treatment with CZ ameliorated the decrease in GFR during diabetes (Fig. 3). These results suggest that in chronic alloxan-induced diabetes, initially there is hyperfiltration, followed by hypo-filtration.
Glomerular filtration rate (GFR): Mice were treated with alloxan (A) and GFR was measured at 0 (n=6), 1 (n=6) and 10 (n=6) weeks (wks). Prior to placement in metabolic cages, 0.3 milligrams of inulin-FITC/25 gram of body weight was placed I. P. by osmotic minipump, and 24-h urine was collected. Other alloxan-treated mice that received ciglitazone (CZ) were placed in metabolic cages, and urine was collected at 12 (n=6) and 16 (n=6) wks. A standard curve was generated using inulin-FITC as standard and measuring fluorescence at 530 nm, when exciting at 488 nm. Urine inulin-FITC was measured using reference-urine from mice that were not given inulin. GFR was expressed as µl/min/g of kidney weight. *, p<0.02 compared to 0 wk; **, p<0.05 when compared to 1 wk. Note that in this model of diabetes, initially there is hyper-filtration followed by hypo-filtration.
3.4. Heart tissue levels of Hcy and nitric oxide (NO)
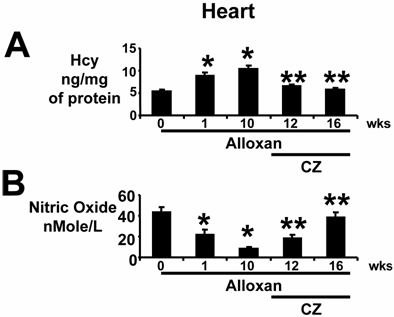
Cardiac tissue Hcy levels were increased one week after alloxan-injection and remained elevated (Fig. 4A). Treatment with CZ ameliorated the increase in cardiac Hcy levels; however, in the present report no specific effects of CZ on Hcy metabolism were studied. Under the same conditions, NO levels inversely mirrored Hcy levels (Fig. 4B). These results and results from the previous section suggest that in diabetics, initially there is no change in plasma levels of Hcy (Fig. 2B); however, cardiac Hcy levels are increased within 1 week of diabetes induction (Fig. 4A) and are inversely related to cardiac NO generation (Fig. 4B).
Heart tissue levels of Hcy and nitric oxide: (A): In anesthetized mice that were treated with alloxan (A), hearts were removed at 0 (n=6), 1 (n=6) and 10 (n=6) weeks (wks). The remaining alloxan-treated mice received ciglitazone (CZ) and hearts were removed at 12 (n=6) and 16 (n=6) wks. Left ventricle (LV) homogenates were prepared. Total Hcy was extracted, separated by HPLC, and quantitated by a spectrophotometer. Hcy was expressed as ng/mg of protein. *, p<0.01 when compared to 0 wk; **, p<0.01 when compared to 10 wks. (B): Total nitrate/nitrite was measured by Griess method. Nitric oxide levels were expressed as nMole/L of LV homogenate. Identical amounts of total protein were used. *, p<0.02 when compared to 0 wk; **, p<0.005 when compared to 10 wks. Note that tissue levels of Hcy were normalized by CZ treatment.
3.5. Endothelial-myocyte uncoupling in diabetes
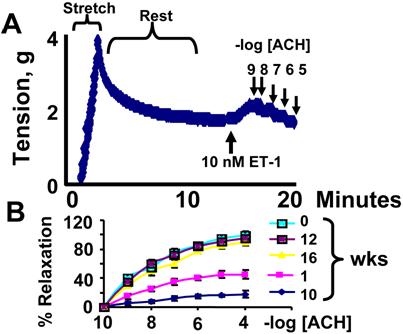
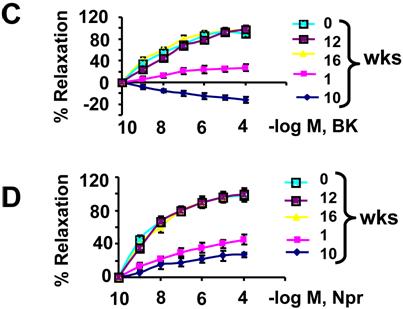
The relaxation to acetylcholine was attenuated in cardiac rings from wild type mice treated with alloxan at 1 and 10 weeks. Treatment with ciglitazone ameliorated the alloxan-diabetes mediated endothelial-dependent myocyte uncoupling, at 12 and 16 weeks (Fig. 5B). The relaxation to bradykinin was also attenuated in cardiac rings prepared from mice treated with alloxan at 1 week. At week 10, bradykinin induced contraction instead of relaxation. Treatment with ciglitazone restored bradykinin-mediated cardiac relaxation, at 12 and 16 weeks (Fig. 5C). The relaxation to nitroprusside was attenuated in cardiac rings from mice treated with alloxan at 1 and 10 weeks. Treatment with CZ ameliorated the endothelial-dependent myocyte uncoupling, and decreased nitroprusside responses in this model of alloxan-induced type 1 diabetes (Fig. 5D). The above results suggest that alloxan impaired NO-dependent and independent cardiac relaxation. Treatment with CZ ameliorated this impairment. Alloxan-diabetes also decreased the endothelium-derived hyperpolarizing factor (EDHF)-mediated (bradykinin-dependent), cardiac relaxation. The PPARγ agonist CZ ameliorated the decreased EDHF-mediated cardiac relaxation.
Cardiac coupling responses to cardiotonic agents: (A): a typical contractile response to 10 nM endothelin-1 (ET-1) and dose-dependent relaxation to 10-9, 10-8, 10-7, 10-6, 10-5 M acetylcholine (ACH) in a ring prepared from mice at 0 time of alloxan treatment. (B): Contractile responses of LV rings from alloxan-treated mice at 0, 1, 10 weeks and from alloxan-treated mice that were given CZ at 12 and 16 weeks. Rings were precontracted with ET-1. The relaxation to ACH was calculated as % of the ET-1 contraction. Each data point is mean ± SEM of at least 6 animals. (C): Different doses of bradykinin (BK) were added to the bath. The relaxation to BK was calculated as % of the ET-1 contraction. Each data point is mean ± SEM of at least 6 animals. (D): Different doses of nitroprusside (Npr) were added to the bath. The relaxation to Npr was calculated as % of the ET-1 contraction. Each data point is mean ± SEM of at least 6 animals. Note that endothelial-dependent and independent relaxation is impaired in diabetes and CZ ameliorates this impairment.
3.6. In vivo cardiac relaxation and contraction
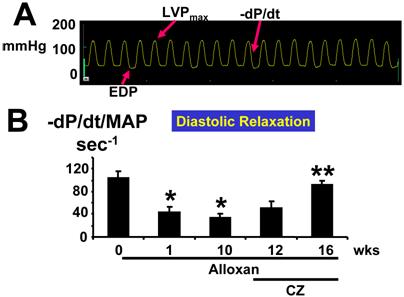
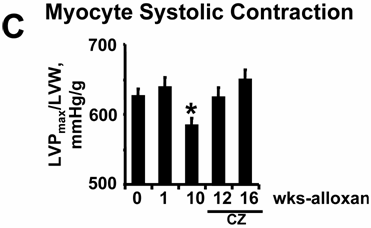
The rate of cardiac diastolic relaxation was decreased at week(s) 1 and 10 after alloxan injection (Fig. 6A, B). Treatment with CZ ameliorated this cardiac diastolic impairment (Fig. 6A, B). The myocyte systolic contraction was decreased significantly at 10 weeks after alloxan injection (Fig. 6C) compared to 0 wk. However, CZ treatment normalized myocyte contractile dysfunction (Fig. 6C) at 12 and 16 wks. Together, these results suggest that endothelial-dependent cardiac diastolic relaxation and myocyte contraction were impaired in diabetes and that the PPARγ agonist ameliorated this impairment.
(A): Typical LV pressure wave from a mouse 10 wks after alloxan treatment. EDP indicates point of end-diastolic pressure. LVPmax indicates maximum LV pressure. The –dP/dt indicates derivative of fall in pressure during LV relaxation. (B): Since the rate of LV relaxation (-/dP/dt) is afterload-dependent, -dP/dt was normalized with mean arterial pressure (MAP): In deeply anesthetized mice, a Millar catheter was inserted into the LV through the right common carotid artery and LV variables were measured at 0, 1, and 10 wks of alloxan (A) treatment. In other alloxan-treated mice, CZ was administered and LV variables were measured at 12 and 16 wks. Each bar represents mean ± SEM (n=6). *, p<0.001 when compared to 0 wk. **, p<0.005 when compared to 10 wks. Note that LV diastolic relaxation was impaired and treatment with CZ ameliorated the diastolic dysfunction in diabetes. (C): Since the LV systolic contraction (LVP/LVW): In deeply anesthetized mice, a Millar catheter was inserted into the LV through the right common carotid artery and LV pressure was measured. Each bar represents mean ± SEM (n=6). *, p<0.002 when compared to 0 wk. **, p<0.001 when compared to 10 wks.
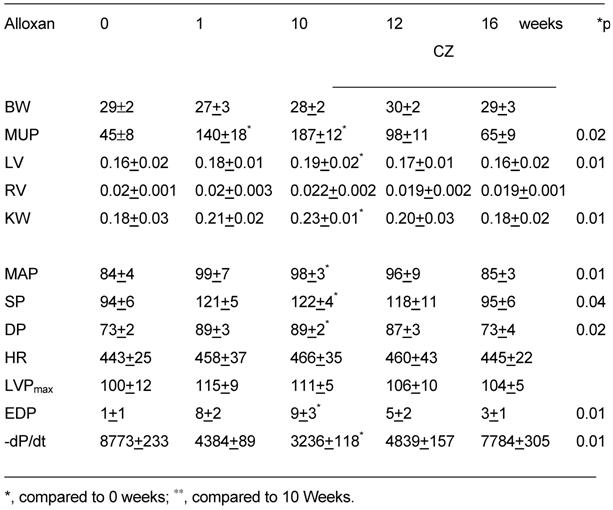
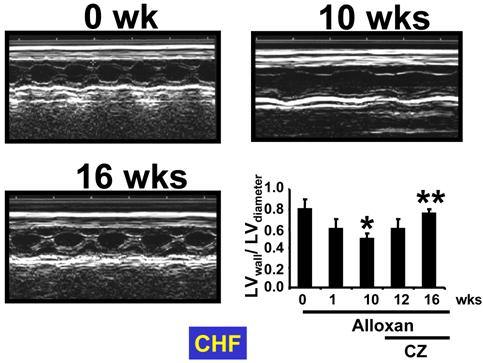
The M-mode echocardiographic data indicated an increase in cardiac diameter and decrease in LV wall thickness at 1 and 10 wks of diabetes. Treatment with CZ normalized the LV wall and diameters (Fig. 7). Also, an increase in cardiac diameter and decrease in LV wall thickness at 1 and 10 weeks may suggest dilated cardiomyopathy. Additionally, to compare between groups the gravimetric and hemodynamic parameters from experimental and control groups are presented in Table 1.
Body weight (BW), mouse urinary protein (MUP, μg/day/kg), left ventricular (LV), right ventricular (RV), and kidney weight (KW) in grams of wildtype mice treated with alloxan. The hemodynamic parameters: mean arterial pressure (MAP, mmHg), systolic blood pressure (SP, mmHg), diastolic blood pressure (DP, mmHg), and heart rate (HR, beats/min) were measured by a Millar catheter in right carotid artery. LV pressure (LVPmax), end-diastolic pressure (EDP) and first derivative of fall in LV pressure, -dP/dt, were measured by a catheter in LV (n=6 in each group).
M-Mode ECHO at 0 and 10 wks after alloxan injection, and at 16 wks after alloxan-injected mice treated with ciglitazone (CZ). Bar graph represents mean±SEM of LVwall/LVdiameter. * p<0.002 when compared to 0 wk; ** p<0.001 when compared to 10 wks. Note that LV dilatation occurred in diabetes and was ameliorated by CZ treatment.
4. Discussion
The hyper-, regular-, and decreased-renal-filtration during early, intermediate, and late phases of diabetes [21], influence the levels of Hcy [12]. An accumulating body of evidence indicates weaker endothelial-dependent relaxation in type 1 and type 2 diabetes mellitus (DM) [22-24]. Others have shown increased endothelial-dependent relaxation, followed by a phase where relaxation returns to normal, and then a final phase of impaired relaxation [21]. We have shown structural glomerular expansion and glomerular collapse in early versus late phases of hypertension [25]. Also, the later phase is associated with wrinkling and thickening of the glomerular capillary wall [25]. Nevertheless, the renal mechanism of hyper- and hypo-filtration in early versus late phases of diabetes is unclear. In the present study, we demonstrated that although there is no change in plasma Hcy levels, the cardiac Hcy levels were robustly increased in the early phase of diabetes. Although increased levels of Hcy in diabetes are associated with decreased renal clearance in the later phase of diabetes, increased glucose levels in DM may impair Hcy metabolism and may also cause an increase in Hcy levels. Therefore, an initial increase in Hcy levels may be attributed to impaired Hcy metabolism by glucose. However, the later synergism between the increase in glucose with impaired renal function may cause a robust increase in Hcy levels in plasma as well as in tissues. We and others have suggested an inverse relationship between the levels of endothelial nitric oxide and levels of Hcy [6, 11]. This may lead to decreased coupling between endothelium and myocyte during cardiac relaxation. To reverse diabetic complications in diabetes, CZ was administered after the creation of diabetes. The results suggested that CZ ameliorated the diabetes-mediated impaired cardiac relaxation. This improvement in cardiac relaxation is most likely, in part, by decreasing cardiac tissue levels of Hcy, as increased level of Hcy is known for endothelial injury and dysfunction [26].
Plasma glucose decreased by CZ treatment. This is not unexpected with PPARγ agonists. We used 10 week diabetic mice to compare diabetic mice treated with CZ at 12 and 16 weeks. The results suggested mitigation in impairments in GFR, myocyte function and cardiomyocyte relaxation by CZ treatment when compared with 12 and 16 untreated diabetic control mice.
Clinical studies have suggested that patients on PPAR agonists have improved cardiovascular function in diabetes [27]; however, the levels of Hcy did not decrease. In fact, Hcy levels were slightly increased. Previously we demonstrated that Hcy competes with PPAR ligands [28]. Therefore, PPAR agonists displace the Hcy and increases plasma Hcy. In the present study we suggest that although PPAR agonist has no effect on plasma Hcy, the levels of cardiac Hcy were decreased by PPAR agonist. In addition, the levels of glucose were decreased by PPAR agonist. Glucose decreases the activity of CBS (cystathionine-β-synthase) and MTHFR (methylenetetrahydrofolate reductase), enzymes responsible for Hcy clearance, and may also contribute to an increase in cardiac Hcy. In addition, mammalian endothelial cells are lacking the CBS enzyme [9]. Therefore, endothelial cells are the prime target for Hcy-toxicity.
Since capillary endothelial cells are embedded in the muscle, the contribution of endothelium to myocyte relaxation is the least studied. Our study demonstrated that although both plasma and myocardial tissue level of Hcy increased in alloxan-induced diabetes; the tissue level of Hcy attenuated by PPARγ agonist (CZ)-treated diabetic mice, without any alteration of plasma Hcy level. The decreased myocardial tissue level of Hcy was found to improve myocardial relaxation as demonstrated by in vitro study. For example, with cardiac ring preparation we have studied both endothelial dependent and independent myocardial relaxation in vitro. For endothelial dependent cardiac relaxation we used acetylcholine and bradykinin. Acetylcholine works through release of endothelial-dependent NO generation, and bradykinin works on blood vessels through the nitric oxide and endothelial-derived hyperpolarizing factor. Both factors have shown endothelial dependent relaxation was attenuated in diabetic rings; however, endothelial independent vascular relaxing factor sodium nitropruside also attenuated cardiac relaxation in vitro. Nitropruside induces vascular relaxation through direct generation of NO, which is independent of endothelium. Therefore, it was expected to relax cardiac ring in our present study. On the contrary, we have seen an opposite effect. This is we believe, at least in part, due to endothelial-myocyte uncoupling which did not allow nitropruside generated NO to travel through the disrupted matrix between endothelial-myocyte. Thus, we have seen attenuated relaxation. These results confirmed the uncoupling of endothelial-myocyte in diabetes; CZ however, improved the relaxation in cardiac rings suggesting the attributed role of CZ in endothelial-myocyte recoupling in diabetes. This study clearly demonstrated that endocardial endothelium contributes to cardiac relaxation and is affected by various cardiotonic agents, at least partly, in controlling myocyte function.
It is worthy to mention that in our experimental groups we had additional diabetic animals of 12 and 16 weeks. These animals did not show any further changes of our tested parameters reported here compared to 10 weeks diabetic control animals. Therefore, we did not present these study groups in this report. Thus, the comparison between diabetic animals and ciglitazone-treated diabetic animals is performed by comparing ciglitazone-treated animals (at 12 and 16 weeks) with 10 weeks diabetic animals (i.e. before start of the ciglitazone treatment), assuming that 10 weeks diabetic animals are a common representative of all three control diabetic animal groups, i.e. 10, 12 and 16 weeks. Additionally, we used LV pressure and pressure derived parameters to describe LV performance without the implementation of simultaneously derived LV volume data. Only when determining end-systolic (ESPVR) and end-diastolic (EDPVR) pressure-volume relationships a reliable description of LV performance can be given. We considered these were certain limitations of our present report.
In summary, our present study demonstrated that decrease renal function and increase LV tissue Hcy were observed in diabetic mice. This increase in tissue levels of Hcy were associated with endothelial-myocyte uncoupling that resulted attenuated LV function both in vivo and in vitro. PPARγ agonist CZ normalized LV tissue levels of Hcy and ameliorated endothelial-myocyte coupling. Thus, this study highlighted the importance of tissue Hcy in diabetic-induced renal failure and emphasizes the potential role of CZ to ameliorate Hcy-induced cardiac dysfunction in diabetes.
Acknowledgements
A part of this study was supported by NIH grants HL-71010, HL-74185, and HL-88012
Conflict of Interest
The authors have declared that no conflict of interest exists.
References
1. Hoppeler H, Kayar SR. Capillary and oxidative capacity of muscles. News in Physiol Sci. 1988;3:113-6
2. Roberts JT, Wearn JT. Quantitative changes in the capillary-muscle relationship in human hearts during normal growth and hypertrophy. Am Heart J. 1941;15:617-33
3. Pinsky DJ, Patton S, Mesaros S. et al. Mechanical Transduction of NO synthesis in the beating heart. Circ Res. 1997;81:372-9
4. Wang J, Morgan JP. EE modulates myofilament Ca2+ responsiveness in aequorin-loaded ferret myocardium. Cir Res. 1992;70:754-60
5. Gattuso A, Mazza R, Pellegrino D, Tota B. Endocardial endothelium (EE) mediates luminal acetylcholine-nitric oxide signaling in isolated frog heart. Am J Physiol. 1999;276:H633-41
6. Tyagi SC, Smiley LM, Mujumdar VS. Homocyst(e)ine impairs endocardial endothelial function. Canad J Physiol & Pharmacol. 1999;77:950-7
7. Shah AM, Grocott-Mason RM, Pepper CB. et al. The cardiac endothelium: cardioactive mediators. Prog Cardiovasc Dis. 1996;39:263-8
8. Rodriguez WE, Tyagi N, Joshua IG, Passmore JC, Fleming JT, Falcone JC, Tyagi SC. Pioglitazone mitigates renal glomerular vascular changes in high-fat, high-calorie-induced type 2 diabetes mellitus. Am J Physiol Renal Physiol. 2006;291:F694-701
9. Finkelstein JD. Methionine metabolism in mammals. J Nutr Biochem. 1990;1:228-37
10. Pouwels MJ, den Heijer M, Blom HJ, Tack CJ, Hermus AR. Improved insulin sensitivity and metabolic control in type 2 diabetes does not influence plasma homocysteine. Diabetes Care. 2003;26:1637-9
11. Shukia N, Thompson CS, Angelini GD, Mikhailidis DP, Jeremy JY. Homocysteine enhances impairment of endothelium-dependent relaxation and cGMP formation in aortae from diabetic rabbits. Diabetologia. 2002;45:1325-31
12. Wollesen F, Brattstrom L, Refsum H, Ueland PM, Bergiund L, Beme C. Plasma total homocysteine and cysteine in relation to glomerular filtration rate in diabetes mellitus. Kidney Int. 1999;55:1028-35
13. Fukagawa NK, Minaker KU, Young VR, Rowe JW. Insulin dose-dependent reductions in plasma amino acids in man. Am J Physiol. 1986;250:E13-7
14. Hulin B, McCarthy PA, Gibbs E M. The glitazone family of antidiabetic agents. Curr Pharm Des. 1996;2:85-102
15. Papaioannou VE, Fox JG. Efficacy of tribromoethanol anesthesia in mice. Lab Anim Sci. 1993;43:189-92
16. Nolte RT, Wisely GB, Westin S. et al. Ligand binding and co-activator assembly of the PPARγ. Nature. 1998;395:137-43
17. Evans M, Anderson RA, Graham J. et al. Ciprofibrate therapy improves endothelial function and reduces postprandial lipemia and oxidative stress in type 2 diabetes mellitus. Circulation. 2000;101:1773-9
18. Scatena R, Bottoni P, Martorana GE. et al. Mitochondria, ciglitazone and liver: a neglected interaction in biochemical pharmacology. Eur J Pharmacol. 2007;567:50-8
19. Qi Z, Whitt I, Mehta A. et al. Serial determination of glomerular filtration rate in conscious mice using FITC-inulin clearance. Am J Physiol Renal Physiol. 2004;286:F590-6
20. Tarone RE. A modified Bonferroni method for discrete data. Biometrics. 1990;46:515
21. Pieper GM. Enhanced, unaltered and impaired NO-mediated endothelial-dependent relaxation in experimental diabetes: importance of disease duration. Diabetologia. 1999;42:204-13
22. Baykan M, Erdogan T, Erem C, Hacihasanoglu A, Gedikli O, Küçükosmanoglu M, Celik S, Orem C. The relationship between flow-mediated dilatation and left ventricular function in type 2 diabetic patients with microalbuminuria. Endocrine. 2006;30:197-202
23. Duncan ER, Walker SJ, Ezzat VA, Wheatcroft SB, Li JM, Shah AM, Kearney MT. Accelerated endothelial dysfunction in mild prediabetic insulin resistance: the early role of reactive oxygen species. Am J Physiol Endocrinol Metab. 2007;293:E1311-9
24. Malakul W, Thirawarapan S, Suvitayavat W, Woodman OL. Type 1 diabetes and hypercholesterolaemia reveal the contribution of endothelium-derived hyperpolarizing factor to endothelium-dependent relaxation of the rat aorta. Clin Exp Pharmacol Physiol. 2008;35:192-200
25. Camp T, Smiley L, Hayden MR, Tyagi SC. Mechanism of Matrix accumulation and glomerulosclerosis in spontaneously hypertensive rats. J Hyperten. 2003;21:1719-27
26. Papatheodorou L, Weiss N. Vascular oxidant stress and inflammation in hyperhomocysteinemia. Antioxid Redox Signal. 2007;9:1941-58
27. Pfützner A, Weber MM, Forst T. Pioglitazone: update on an oral antidiabetic drug with antiatherosclerotic effects. Expert Opin Pharmacother. 2007;8:1985-98
28. Tyagi N, Moshal KS, Sen U, Lominadze D, Ovechkin AV, Tyagi SC. Ciglitazone ameliorates homocysteine-mediated mitochondrial translocation and matrix metalloproteinase-9 activation in endothelial cells by inducing peroxisome proliferator activated receptor-gamma activity. Cell Mol Biol. 2006;52:21-7
Author contact
![]() Correspondence to: Suresh C. Tyagi, M. Phil., Ph. D., University of Louisville School of Medicine, A-1115, Dept of Physiology & Biophysics, 500 South Preston Street, Louisville, KY 40202. Phone (502) 852-3381; Fax (502) 852-6239; E-mail:s0tyag01edu
Correspondence to: Suresh C. Tyagi, M. Phil., Ph. D., University of Louisville School of Medicine, A-1115, Dept of Physiology & Biophysics, 500 South Preston Street, Louisville, KY 40202. Phone (502) 852-3381; Fax (502) 852-6239; E-mail:s0tyag01edu