Impact Factor ISSN: 1449-2288

 Global reach, higher impact
Int J Biol Sci 2008; 4(6):397-405. doi:10.7150/ijbs.4.397 This issue Cite
Research Paper
Comparing methods of detection and quantitation of RNA editing of rat glycine receptor alpha3P185L
Aya Nakae1 ![]() , Tatsuya Tanaka2, Keiko Miyake1, Makiko Hase3, Takashi Mashimo1
, Tatsuya Tanaka2, Keiko Miyake1, Makiko Hase3, Takashi Mashimo1
1. Department of Anesthesiology & Intensive Care, Osaka University Graduate School of Medicine, 2-2 Yamadaoka, Suita City, Osaka, Japan 565-0871
2. Center for Medical Research and Education, Osaka University Graduate School of Medicine, 2-2 Yamadaoka, Suita City, Osaka, Japan 565-0871
3. Applied Biosystems Japan Ltd., Application Support, 4-5-4 Hatchobori Chuo-ku, Tokyo, Japan 104-0032
Received 2008-6-18; Accepted 2008-10-20; Published 2008-10-21
Abstract
Background: Recently, it has become evident that RNA editing-related changes are important in the modulation of neuronal information processing. Alternatively edited transcripts, when meagerly present, are hard to detect. Significant functional consequences may result, however, from small differences in editing efficiency. Moreover, it is difficult to evaluate the ratio of edited transcripts. The glycine receptor alpha3 subunit (GlyR alpha3) is expressed in the spinal cord, and transcripts of GlyR alpha3 are susceptible to RNA editing. The physiological role of this editing is still unclear. To analyze changes in RNA editing in various animal models, we need reliable and practical ways to detect and quantitate GlyR alpha3 RNA editing.
Results: We identified and assessed different ways of detecting edited RNA transcripts, including direct sequencing, denaturing high performance chromatography (DHPLC), allele-specific real-time PCR with TaqMan probes, and PCR with allele-specific primers. Using PCR with allele-specific primers on standard PCR products for edited and nonedited GlyR alpha3, we were able to detect as little as a 0.5% incidence of edited transcripts. We were able to detect a 5% incidence of RNA editing using direct sequencing and 2% using DHPLC. We could accurately determine the ratio of edited to non-edited RNA using DHPLC, direct sequencing, and allele-specific real-time PCR with TaqMan probes.
Conclusion: We demonstrated exact and sensitive methods of detecting RNA editing. In prepared samples, we showed means of quantitating the incidence of editing of a particular site. The demonstrated methodologies should be very useful when extended to the evaluation of other types of RNA editing and single base mutations.
Keywords: RNA editing, glycine alpha 3 subunit, DHPLC, direct sequencing, allele-specific primer, allele-specific TaqMan PCR method
1. Introduction
RNA editing is broadly defined as any RNA processing event (excluding RNA splicing) that generates an RNA message with a nucleotide sequence that differs from corresponding genomic DNA. Recently, it has become evident that RNA editing plays an important role in the modulation of neuronal information processing, and that small differences in editing efficiency can have significant functional consequences. Mammalian RNA editing generally occurs by either cytosine-to-uracil (C-to-U) or adenosine-to-inosine (A-to-I) deamination. Good examples of C-to-U editing include conversions, mediated by a citidine deaminase in conjunction with additional cellular machinery, within apolipoprotein B RNA [1] and neurofibromin [2] . Elsewhere, involving alteration of the mRNA of glutamate and serotonin receptors, A-to-I editing of several neuronal genes has been identified. RNA editing similarly affects potassium channels. Functional consequences include effects on calcium ion permeability (GluR6; [3]), on control of G protein activation (5HT2c; [4]), and on modulation of channel inactivation (hKv1.1; [5]). A-to-I editing is caused by the ADAR (adenosine deaminases that act on RNA) family of enzymes [6]. The occurrence of inosine in poly(A)+ mRNA has been estimated at one base in 17,000 in rat brain and one in 33,000 in rat heart [7]. Very few edited transcripts have been identified [6], and it is likely that many edited transcripts await discovery. If inosine occupies a guanosine site during the translation process, its presence can alter the encoded protein [8]. Consequently, in neuroscience, it is very important to find ways of detecting these meagerly existing edited transcripts.
The glycine receptor alpha3 subunit (GlyR alpha3) is expressed in the spinal cord where it physiologically plays a pivotal role in prostaglandin-mediated inflammatory pain transmission in the spinal cord dorsal horn. GlyR alpha3 transcripts are susceptible to RNA editing. These edited isoforms cause physiological changes. GlyR alpha3P185L, resulting from cytidine 554 deamination, endows neurons with high glycine sensitivity and promotes sustained chloride conductance associated with tonic inhibition. [9] The physiological role of this editing is still unclear. To analyze changes in RNA editing in various animal models, we need reliable and practical ways of detecting and quantitating GlyR alpha3 RNA editing.
More easily detected than edited RNA, single nucleotide polymorphisms (SNPs) are commonly identified by various methods. Because editing creates such subtle changes in the sequence, it is as difficult to detect edited transcripts as it is to detect micro-exons. It has been possible, however, to greatly improve assay sensitivity by using PCR products as a template and sequencing with thermostable polymerases [10,11,12]. Very small amounts of mRNA can now be assayed by amplifying the template with RT-PCR, but few studies have yet presented detailed reports of the factors that contribute to the accuracy of the assay [13,14,15,16]. We tried four different methods of detecting and determining the ratio of edited-to-non-edited transcripts: DHPLC; direct sequence; and allele-specific real-time PCR with TaqMan probe as a qualitative and sensitive methods: and PCR using allele-specific primers as a sensitive method. We evaluated the four methods in detail.
2. Material and methods
Total clone making
RNA was isolated from rat spinal cord and cDNA was obtained by reverse transcription using oligo-dT. The full length cDNA encoding rat GlyR alpha3 subunit was amplified using oligonucleotides 5'-AACATGCATAATGCAACTCG-3' and 5'-CCATCCAAATGTCAATTGC-3' and subcloned into TA cloning vector pCR2.1. (Invitrogen, Tokyo, Japan). The site-directed mutation for GlyR alpha3 (P185L) was performed by QuikChange mutagenesis kit (Stratagene Tokyo, Japan). We use TA Cloning kit (Invitrogen, Tokyo, Japan) for ligation and TOPO 10 (Invitrogen, Tokyo, Japan) for transformation. After purification of plasmids, we carried out direct sequencing and confirmed that the samples contained completely full-length GlyR alpha3 wild and mutant clones.
Preparation of standard samples
We performed quantitative RT–PCR of GlyR alpha3 edited and nonedited full length samples, according to the manufacturer's protocol, with an ABI PRISM 7900HT (Applied Biosystems, Foster City, CA) using TaqMan probes supplied by Applied Biosystems. All reactions were run in duplicate. We performed the quantitation of both edited and nonedited samples using standard curve methods. Standard samples were prepared by controlling the concentration of these two samples at same detection cycles.
Standard PCR products
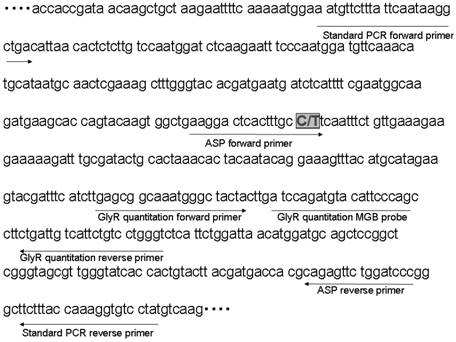
We made the standard PCR products (fragment 467 bp) for edited and nonedited GlyR alpha3 with optimase polymerase (high fidelity polymerase) using oligonucleotides F>5'AATGTTCTTTATTCAATAAGGCTGA3' and R>5'ACATAGGACACCTTTGGTAAAGAA3' which flank the editing site (Fig. 1). A 467 bp fragment was amplified in a reaction using, as recommended by the manufacturer, 1.25 units of polymerase, 0.5 μM of each primer, and a reaction buffer with Mg2+ along with approximately 1 ng Plasmid DNA template, 200 μM of each dNTP and distilled water to a final volume of 50 μl. Cycling conditions were 1 cycle at 95ºC for 5 min followed by 25 cycles of 95ºC for 45 s, 55ºC for 45s, 72ºC for 1.5 min, and 72ºC for 7 min.
The primers and probe design for making standard PCR products and for quantitation of standard PCR products. In the sequence C/T denotes the editing site.
PCR using allele-specific primers (ASP)
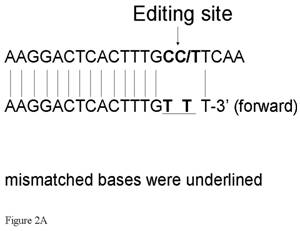
So we could ascertain the detection limit, in standard dilutions, the PCR products of edited and nonedited plamids were mixed in differing proportions. When we examined the results of these trials, it was apparent that it was better for the edited site to be situated in the forward primer. If sited in the reverse primer, the 3' end would be G and this would greatly increase the likelihood of nonspecific amplification. After designing a pair of allele-specific primers (Fig. 1 and 2A), F>5'AAGGACTCACTTTGTTT3' and R>GGGATCCAGAACTCT3', we carried out PCR using allele-specific primers with rTth DNA Polymerase XL (Applied Biosystems, Tokyo, Japan). PCR conditions were 25 cycles of 2 min at 94ºC, 15 s at 94ºC and 30 s at 60ºC, another 40 cycles of 15 s at 94ºC, and 30 s at 57ºC.
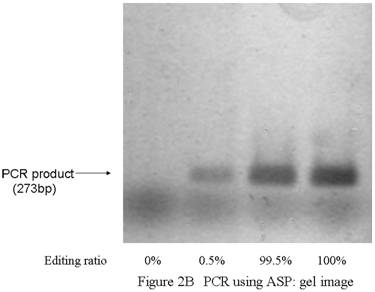
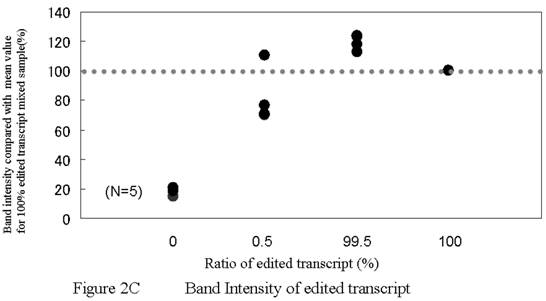
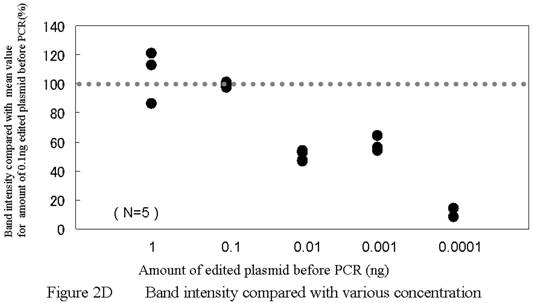
PCR using allele-specific primers. A) ASP forward primer design. Two bases (one is a site of editing) were mismatched. B) PCR using ASPs could detect GlyR alpha3 editing incidences as low as 0.5%. While the 273 bp band for Lane 1 is clearly not apparent, high-intensity 273 bp bands are evident for Lanes 2–4; however, this technique cannot be considered quantitative. A false positive signal in the band for ASP–PCR was also noted. C) The band intensity was almost same for 0.5%, 99.5%, and 100% samples. This method was considered to be unsuitable for quantitation. D) The template concentration of edited plasmid was considered to be important for this assay condition. A minimum presence of original edited plasmid in the amount of between 0.001 ng and 0.0001 ng is regarded as a lower limit for practical measurement. ASP, allele-specific primers.
After PCR using allele-specific primers, the PCR products were electrophoresed on 1% agarose gel at 100 V/cm in 1×TAE. Following electrophoresis, gels were incubated in SYBER Green solution for 1 min. Gels were scanned directly at 488 mm using a FluoroImager (Molecular Dynamics, Sunnyvale, CA). SYBR Green fluorescence was captured using a 530DF30 filter with the photomultiplier tube voltage was set at 700 V.
Scans were analyzed using ImageQuant software (Amersham Bioscience, Tokyo, Japan). Band intensities were compared using the average value of the integrated pixel intensity for a two-pixel line drawn through the middle of each lane. We analyzed the band intensity by calculating when band intensity for edited plasmids would be 100% ( The value of the each band intensity(%) = the actual value of each sample intensity / the actual value of 100% edited plasmid's band intensity *100) . When we analyzed the detection limit, the band intensity of the 0.1 ng template was estimated to have a value of 100. Results for the different samples were indexed on this scale of 100.
DHPLC analysis
Denaturing HPLC was performed using a WAVE DNA fragment analysis system with a DNASep column (Transgenomic, Tokyo, Japan). To generate heteroduplex molecules, PCR products were subjected to denaturation for 4 min at 94ºC followed by a gradual reannealing for 45 min in the thermal cycler. Aliquots of 5 μl of reannealed PCR products were loaded in a column. The gradient was prepared by mixing TEAA buffer A (0.1 M triethylammonium acetate). Primer extension products were eluted using a linear gradient from 18%B to 38%B at a flow rate of 0.9 ml/min for 7 min. Column temperature was set at 57.9ºC. The eluted products were monitored at 260 nm using the UV detector. After each elution, the column was washed and equilibrated with the gradient of 90%B and 18%B, each for 1 min. Peaks were identified using standard PCR products as described above. RNA editing efficiency was calculated by comparing the peak heights after peak fitting with Gaussian curves corresponding to edited and non-edited extension products. The RNA editing efficiency of each sample was analyzed in duplicate.
Direct sequencing
Standard PCR products were purified using column purification on glass fibers (Qiagen ,Tokyo, Japan). We mixed the two purified standard PCR products at various ratios. These mixed samples were sequenced on an ABI PRISM3100 Genetic Analyzer using BigDye terminator v1.1 sequencing kits (both Applied Biosystems, Tokyo, Japan). The raw relative peak amplitude data for each sample was analyzed.
Allele-specific real time PCR method
We designed a primer and probe for quantitating GlyR alpha 3 gene expression. (GlyRalpha3 forward primer, GAGCGGCAAATGGGCTACTA; GlyR alpha3 reverse primer, ACCCAGGACAGAATGACAATCAG; GlyR alpha3-MGB probe, ATCCAGATGTACATTCCCAG.)
Each standard real-time PCR reaction mixture contained a 5 μl sample of edited or nonedited plasmids, 1.5 μl (300 nM) of 10 pmol/μl forward primer, 4.5 μl (900 nM) of 10 pmol/μl reverse primer, 1.25 μl (250 nM) of 10 pmol/μl TaqMan MGB probe, 25 μl of TaqMan® Universal PCR Master Mix. The total reaction volume was 50 μl. The amplification program consisted of at 50ºC for 2 min and 95ºC for 8 min followed by 40 cycles of 15 s of denaturation 95ºC, 1 min annealing at 55ºC, and 1 min extension at 62ºC. Based on these quantitaion data, we produced standard plasmids of same concentration.
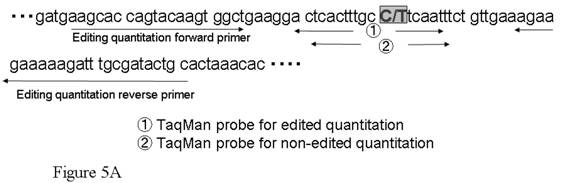
To derive the editing ratio of the samples, we designed two TaqMan® MGB probes for quantitation using FAM and VIC, whose sequences matched edited and nonedited sites (GlyR alpha3 nonediting probe: TCACTTTGCCTCAATT and GlyR alpha3 editing probe: ACTCACTTTGCTTCAAT)) and a pair of flanking primers (GlyR alpha3 1017F, AGCACCAGTACAAGTGGCTGAA; and 1092R, GCAGTATCGCAAATCTTTTTCTTCT). Next, we mixed samples with edited and nonedited plasmids included at various known ratios. Each allele-specific real-time PCR reaction mixture contained a 5 μl mixed plasmid sample, 4.5 μl (900 nM) of 10 pmol/μl forward primer, 4.5 μl (900 nM) of 10 pmol/μl reverse primer, 1.0 μl (200 nM) of 10 pmol/μl TaqMan editing probe, 1.0 μl (200 nM) of 10 pmol/μl TaqMan nonediting probe, 25 μl of TaqMan Universal PCR Master Mix. Total reaction volume was 50 μl. The amplification program consisted of 2 min at 50ºC and 10 min at 95ºC followed by 40 cycles of 15 s denaturation at 95ºC, and annealing for 1 min at 60ºC. The quantities of each allele were determined using the comparative Ct method with these two probes and analysis on a real time PCR system (Applied Biosystems 7300; Tokyo, Japan). Regression analysis was performed on the results for samples of each ratio.
Statistical analysis
The correlation coefficient was obtained using simple regression analysis (Microsoft Excel; Redmond, WA).
3. Results
Our goal was to find and compare inexpensive assays that gave accurate quantitative or sensitive results. We found one method that was solely sensitive and three that were sensitive and quantitative.
Detection of RNA editing using allele-specific primers
Using allele-specific primers, we were able to detect a 0.5% incidence of editing sites. Figure 2 shows results using allele-specific primer (ASP) assays with control reactions. When the incidence of edited transcripts was more than 0.5%, 267 bp bands were clearly visible when the samples were analyzed (Fig. 2B). Intensity in these bands was not the same as for non-edited plasmid samples and we concluded that this method, while not quantitative, did enable detection and that the detection limit was between 0.001 ng and 0.0001 ng. (Fig. 2C, 2D)
Detection and quantitation of RNA editing by direct sequencing
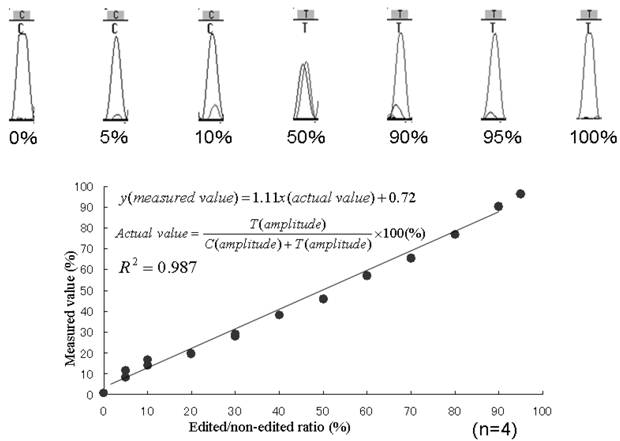
To perform determine the accuracy of this assay, we mixed edited and non-edited GlyR alpha 3 standard PCR products (Fig. 3). The two kinds of PCR product, otherwise identical, contained either a C or a T at position 554. From the raw direct-sequencing data, peak intensities of fluorescence for each of the variously edited and nonedited samples were recorded. Fitting the data with a linear R2 value of 0.986, these peaks accurately reflected the ratios in the plasmid mixes. Detection was only sensitive down to an incidence of 5% of the total, lower incidences of editing were not detected (Fig. 3).
Typical chromatogram of direct sequencing and quantitation of known mixed-template assay results. The known ratio of edited-to-nonedited plasmids is plotted against the values measured in the chromatogram assay. The least-squares fit of the actual data is defined by the equation y = 1.11x + 0.72, p = < 0.001.
Detection and quantitation of RNA editing using DHPLC analysis
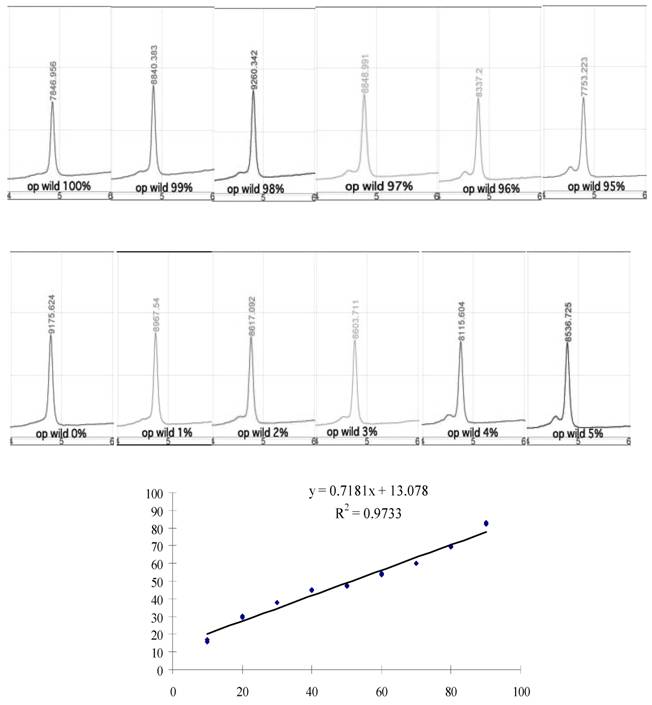
DHPLC (denaturing high performance liquid chromatography) is commonly used for detecting mutations through screening of PCR products for heterogeneity (Fig. 4). While edited products could be detected even when they made up as little as 2% of the total transcripts (Fig. 4 above), at levels below 10%, it was difficult to analyze DHPLC data to accurately determine actual quantities. We also tested mixtures that contained different percentages of nonedited and edited PCR products and Figure 4 shows the results for this DHPLC. For samples containing 10% to 90% mutant transcripts, these results accurately reflect the plasmid-mix ratios, fitting the data with a linear R2 value of 0.972.
DHPLC analysis. Each chromatogram shows results of DHPLC analysis for PCR products amplified using mixed templates of different ratios of editing (0%–5%, 95%–100%). Although two distinguishable heteroduplex and homoduplex peaks were not apparent, a small peak (heteroduplex) next to a large peak was seen in mixes in which 2% or more of plasmids were edited. Quantitation of known template assay results. The least-squares fit of the actual data is defined by the equation y = 0.718x + 13.1, p = < 0.001.
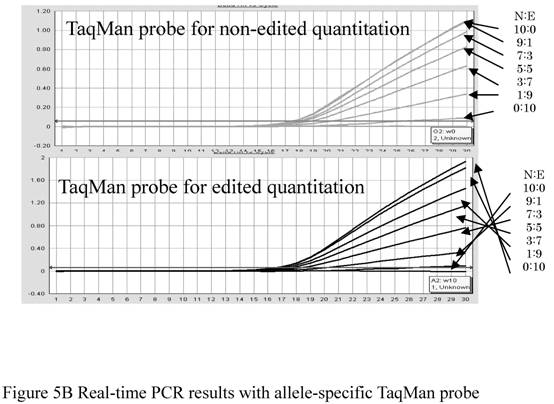
Implementation of allele-specific real-time PCR method with TaqMan probe
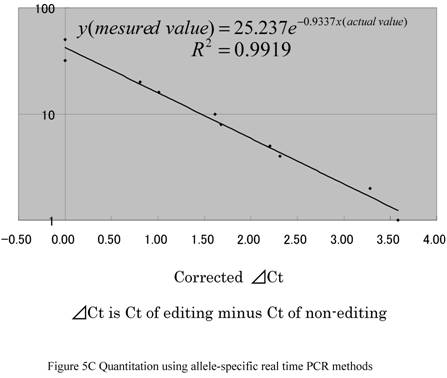
We confirmed that the amplification efficiencies of primers used for edited and nonedited samples were approximately equal (data not shown). We tested two MGB probes at various ratios of control plasmid and confirmed that they were specific to each clone of Gly alpha3 (Fig. 5B). In other words, edited probes were highly specific only for edited transcripts and the nonedited probed were highly specific only for nonedited transcripts. Then, we analyzed various ratios of edited and nonedited products using these primers and probes. We were able to determine the editing ratios at y = 25.237 e-0.9337X (R2 = 0.9919; y, measured value; x, actual value) (Fig. 5C).
(A) Two TaqMan® MGB probes using FAMTM and VIC®, whose sequences matched edited or nonedited sites, and a pair of flanking primers was designed to increase the precision of allele-specific quantitation. In the sequence, C/T denotes the edited site. (B) The quantities of each allele were evaluated from ∆Ct results from a real-time PCR system (TaqMan ABI 7300). (C) Quantitation using allele-specific real time PCR methods. Assuming that ∆Ct was equal to zero when the editing ratio was 50%, logistic regression analysis of the incidence of editing in differently mixed samples was performed. Correlation between measured values and corrected ∆Ct is shown. The actual data is defined by the equation y = 25.237e -0.9337x, p = < 0.001 (y: measured value, x: actual value).
4. Discussion
The ability to measure subtle differences in editing efficiency is becoming increasingly important, particularly for clinical studies. For example, minute reductions in editing efficiency have been associated with clinical depression, suicide, certain forms of epilepsy, and schizophrenia [4,17,18,19,20,]. The properties of alpha amino-3-hydroxy-5-methyl-4-isoxazoleprpionate (AMPA) receptor are generated post-transcriptionally by RNA editing at the Q/R site, where deficient RNA editing of GluR2 is associated with neuronal death in amytropic lateral sclerosis [21,22]. Recently, a number computational methods for detecting A-to-I RNA editing sites have been proposed [23], and algorithmic approaches for identifying RNA editing sites have been discussed [24]. The methods of testing that we have demonstrated here are useful, at the study planning stage, for establishing the means of detecting and quantifying editing ratios within a short time.
We found that the best way of detecting of already known RNA editing was PCR with allele-specific primer pairs. If good primer pairs are created, this method is simple and inexpensive; however, because the polymerase amplification is susceptible to approximately 1% error [25], it is not always accurate. The relevant analytical efficacy of this low-cost option must be carefully considered. Our PCR results with ASPs were excellent and useful for identifying if editing had occurred.
If it is not possible to properly design ASPs, DHPLC may be feasible. The DHPLC method has been used successfully for detecting point mutations at very low (0.5%–5.0%) percentages of heterogeneity [26, 27]. DHPLC may be useful because it can inexpensively provide analysis of known editing. Using direct sequencing, assay detection of editing incidences is 20% in general, and in our analysis we managed to detect, and measure accurately, incidences as low as 5%. Unfortunately, direct sequencing incurs high costs. Thus, direct sequencing is too expensive to use from the beginning. Another option, if the editing site is already known, is the use of allele-specific TaqMan probes. If the primer and probe are designed especially for detection, this method can provide detectability down to 2% (data not shown). But the primer–probe pair which we designed for detection was not at all useful for quantitation. Furthermore, there is no special cost benefit in using allele-specific TaqMan probes.
For quantitating already known RNA editing ratios, direct-sequencing and DHPLC used in combination with allele-specific TaqMan probes were useful. Compared against the edited/nonedited ratios of known standard samples, results for DHPLC (R2 = 0.973), from allele-specific TaqMan probes (R2 = 0.992), and from direct sequencing (R2 = 0.987) correlated well. Allele-specific TaqMan probes yielded the closest correlation because they were designed and used in conditions that favored quantitation of the incidence of editing. Conversely, such probes are not suitable for blind detection. Even so, once the primers and probe are designed and evaluated, this method is both accurate and easy to perform. Consequently, it is very useful for evaluating samples in which RNA editing is known to have occurred. Meanwhile, DHPLC is inexpensive and has good detection sensitivity down to 2%. So DHPLC would appear to be an excellent means both of RNA editing detection and quantitation. Our results using DHPLC, however, did manifest a shortcoming. In the protocol we used, we were unable to determine four peaks, which should be detectable in ideal conditions. We were unable to ascertain which peaks were edited or non-edited. For confirmation, supplementary procedures involving standard samples were necessary. Of the methods we used for detecting and quantitating samples in which partial editing at the site of GlyR alpha3 was present, we conclude that ASP was best for detection and that TaqMan probes or direct sequencing gave superior quantitation results.
Recently, computational methods for detecting A-to-I RNA editing sites have been introduced [23]. Such analysis has revealed thousands of editing sites within the genomic reiteration, and has also brought to light some novel genetic recoding sites. If computational methods are used for prediction, preliminary testing of predicted gene clones could be simply and inexpensively carried out using ASP. DHPLC could then be used to review non-conforming ASP results. Furthermore, when it is known that editing has occurred in a real sample, direct sequencing can be used to confirm the suspected editing site. When priority is given to quantitation, TaqMan probes or direct sequencing should be used.
For detecting and quantitating a specific type of editing, ASP and DHPLC are suitable for initial detection, followed by quantitation using direct sequencing or allele-specific TaqMan probes. To screen for unknown editing, from the options tested, DHPLC or direct sequencing should be considered.
It is, of course, essential to carry out validation using clones of each sample. We suppose that for any type of unknown RNA editing, the techniques reported here can enable identification and quantitation of the SNP. It is important, however, to use the method that is most appropriate for the specific purpose and circumstance.
In conclusion, we evaluated four different ways of detecting and quantitating the incidence of RNA editing. These techniques and our findings should be of interest to anyone carrying out research on other RNA editing sites, especially single-base editing patterns. The methodologies presented here are likely to be beneficial for current and future studies aimed at understanding the relationship between the editing incidence of a target gene and the effectiveness of corresponding physiological or pharmacological phenotypes.
Acknowledgements
This work was supported by a Grant-in-Aid (No. 18791077) from the Ministry of Education, Culture, Sports, Science and Technology, Japan. The author would also like to thank Dr. Ichiro Uchida for providing the GlyR alpha3 clone and for detailed advice concerning the experimental design and Dr. Satoshi Hagihira for advice about statistical analysis.
Conflict of interests
The authors declare that they have no conflict of interest.
References
1. Powell LM. A novel form of tissue-specific RNA processing produces apolipoprotein-B48 in intestine. Cell. 1987;50:831-840
2. Skuse GR, Cappione AJ, Sowden M, Metheny LJ, Smith HC. The neurofibromatosis type 1 messenger RNA undergoes base-modification RNA editing. Nucleic Acids Res. 1996;24:478-485
3. Kohler M, Burnashev N, Sakmann B, Seeburg PH. Determinants of Ca2+ permeability in both TM1 and TM2 of high affinity kainite receptor channels: diversity by RNA editing. Neuron. 1993;10:491-500
4. Gurevich I, Tamir H, Arango V, Dwork AJ, Mann JJ, Schmauss C, Gurevich I. Altered editing of serotonin2C receptor pre-mRNA in the prefrontal cortex of depressed suicide victims. Neuron. 2002;34:349-356
5. Bhalla T, Rosenthal JJ, Holmgren M, Reenan R. Control of human potassium channel inactivation by editing of a small mRNA hairpin. Nat Struct Mol Biol. 2004;11:950-956
6. Keegan LP, Gallo A, O'Connell MA. The many roles of an RNA editor. Nat Rev Genet. 2001;2:869-878
7. Paul M, Bass BL. Inosine exists in mRNA at tissue-specific levels and is most abundant in brain mRNA. EMBO J. 1998;17:1120-1127
8. Basilio C, Wahba AJ, Lengyel P, Speyer JF, Ochoa S. Synthetic polynucleotides and the amino acid code. Proc Natl Acad Sci U S A. 1962;48:613-616
9. Meier JC, Henneberger C, Melnick I, Racca C, Harvey RJ, Heinemann U, Schmieden V, Grantyn R. RNA editing produces glycine receptor α3P185L, resulting in high agonist potency. Nat Neurosci. 2005;8:736-744
10. Burns CM, Chu H, Rueter SM, Hutchinson LK, Canton H. Regulation of serotonin-2C receptor G-protein coupling by RNA editing. Nature. 1997;387:303-308
11. Schiffer HH, Heinemann SF. A quantitative method to detect RNA editing events. Anal Biochem. 1999;276:257-260
12. Peeters NM, Hanson MR. Transcript abundance supersedes editing efficiency as a factor in developmental variation of chloroplast gene expression. RNA. 2002;8:497-511
13. Gallo A, Thomson E, Brindle J, O'Connell MA, Keegan LP. Micro-processing events in mRNAs identified by DHPLC analysis. Nucleic Acids Res. 2002;30:3945-3953
14. Barbon A, Vallini I, Via LL, Marchina E, Barlati S. Glutamate receptor RNA editing: a molecular analysis of GluR2, GluR5 and GluR6 in human brain tissues and in NT2 cells following in vitro neural differentiation. Brain Res Mol Brain Res. 2003;117:168-178
15. Chen YC, Kao SC, Chou HC, Lin WH, Wong FH, Chow WY. A real-time PCR method for the quantitative analysis of RNA editing at specific sites. Anal Biochem. 2008;375:46-52
16. Chateigner-Boutin AL, Small I. A rapid high-throughput method for the detection and quantitation of RNA editing based on high-resolution melting of amplicons. Nucleic Acids Res. 2007;35(17):e114
17. Sprengel R, Higuchi M, Monyer H, Seeburg PH. Glutamate receptor channels: A possible link between RNA editing in the brain and epilepsy. Adv Neurol. 1999;79:525-534
18. Sodhi MS, Burnet PW, Makoff AJ, Kerwin RW, Harrison PJ. RNA editing of the 5-HT (2C) receptor is reduced in schizophrenia. Mol Psychiatry. 2001;6:373-379
19. Vissel B, Royle GA, Christie BR, Schiffer HH, Ghetti A, Tritto T, Perez-Otano I. et al. The role of RNA editing of kainite receptors in synaptic plasticity and seizures. Neuron. 2001;29:217-227
20. Schmauss C. Serotonin 2C receptors: Suicide, serotonin, and runaway RNA editing. Neuroscientist. 2003;9:237-242
21. Kawahara Y, Ito K, Sun H, Aizawa H, Kanazawa I, Kwak S. Glutamate receptors: editing and death of motor neurons. Nature. 2004;427(6977):801
22. Kwak S, Kawahara Y. Deficient RNA editing of GluR2 and neuronal death in amyotropic lateral sclerosis. J Mol Med. 2005;83:110-120
23. Bundschuh R. Computational prediction of RNA editing sites. Bioinformatics. 2004;20:3214-3220
24. Levanon EY, Eisenberg E. Algorithmic approaches for identification of RNA editing sites. Brief Funct Genomic Proteomic. 2006;5:43-45
25. Goodman MF, Tippin B. The expanding polymerase universe. Nat Rev Mol Cell Biol. 2000;1:101-109
26. van den Bosch BJ, de Coo RF, Scholte HR, Nijland JG, van Den Bogaard R, de Visser M, de Die-Smulders CE, Smeets HJ. Mutation analysis of the entire mitochondrial genome using denaturing high performance liquid chromatography. Nucleic Acids Res. 2000;28:E89
27. Wolford JK, Blunt D, Ballecer C, Prochazka M. High-throughput SNP detection by using DNA pooling and denaturing high performance liquid chromatography (DHPLC). Hum Genet. 2000;107:483-487
Author contact
![]() Correspondence to: Aya Nakae, Tel: +81-6-6879-3133; FAX: +81-6-6879-3139; E-mail: anakaemed.osaka-u.ac.jp
Correspondence to: Aya Nakae, Tel: +81-6-6879-3133; FAX: +81-6-6879-3139; E-mail: anakaemed.osaka-u.ac.jp