Impact Factor ISSN: 1449-2288
- Issue 6; 2026
- Issue 5; 2026
- Issue 4; 2026
- Issue 3; 2026
- Issue 2; 2026
- Volume 22; 2026
- Past Issues
- Advance Articles
- Editorial Board
- Cover Images
- Index & Coverage
- Cover Suggestion
- Special Issues
1. Introduction
2. QTL detected on BTA14 in...
3. QTL detected on BTA14 in beef...
4. Conclusion
Acknowledgements
References

 Global reach, higher impact
Int J Biol Sci 2008; 4(6):406-414. doi:10.7150/ijbs.4.406 This issue Cite
Review
Genome Assembly Anchored QTL Map of Bovine Chromosome 14
Tito A. Wibowo1, Charles T. Gaskins1, Ruth C. Newberry1, Gary H. Thorgaard 2, Jennifer J. Michal1, Zhihua Jiang1 ![]()
1. Department of Animal Sciences, Washington State University, Pullman, WA 99164–6351, USA
2. School of Biological Sciences, Washington State University, Pullman, WA 99164-4236, USA.
Received 2008-11-8; Accepted 2008-11-11; Published 2008-11-12
Abstract
Bovine chromosome 14 (BTA14) has been widely explored for quantitative trait loci (QTL) and genes related to economically important traits in both dairy and beef cattle. We reviewed more than 40 investigations and anchored 126 QTL to the current genome assembly (Btau 4_0). Using this anchored QTL map, we observed that, in dairy cattle, the region spanning 0 – 10 Mb on BTA14 has the highest density QTL map with a total of 56 QTL, mainly for milk production traits. It is very likely that both somatic cell score (SCS) and clinical mastitis share some common QTL in two regions: 61.48 Mb - 73.84 Mb and 7.86 Mb – 39.55 Mb, respectively. As well, both ovulation rate and twinning rate might share a common QTL region from 34.16 Mb to 65.38 Mb. However, there are no common QTL locations in three pregnancy related phenotypes: non-return rate, pregnancy rate and daughter pregnancy rate. In beef cattle, the majority of QTL are located in a broad region of 15 Mb – 45 Mb on the chromosome. Functional genes, such as CRH, CYP11B1, DGAT1, FABP4 and TG, as potential candidates for some of these QTL, were also reviewed. Therefore, our review provides a standardized QTL map anchored within the current genome assembly, which would enhance the process of selecting positional and physiological candidate genes for many important traits in cattle.
Keywords: cattle, BTA14, QTL, review
1. Introduction
Livestock species, especially cattle, play an important role in economic development worldwide [1]. To increase profitability, cattle with superior, economically important traits such as growth, milk production and meat quality, have been selected and used as breeding stock. Traditionally, phenotypic and pedigree data have been used to select and pair the best sires and dams, which would in many cases result in offspring with improved phenotype values compared to the previous generation. This simple method of data collection and selection tripled U.S. milk production from 1940-1991 with fewer cows [2]. Therefore, any sophisticated techniques to choose sires and dams that are genetically superior will further enhance the process, leading to further improvement and economical gain.
Finding genes responsible for these economically important traits, however, is challenging because they are quantitative traits in nature [3, 4]. In other words, these traits are polygenic and are controlled by the accumulative action of many Mendelian genes. Moreover, the number of genes involved is unknown, and environmental factors can also complicate the process because they can have a confounding effect on phenotypes [3, 4, 5, 6]. Nonetheless, recent developments in molecular biology and statistical methodologies allow the possibility to localize regions/genes in the genome or chromosome that are responsible for traits of interest [7, 8, 9].
To date, bovine chromosome 14 (BTA14) has been one of the most widely studied chromosomes for quantitative trait loci (QTL) related to many economically important traits in cattle [10]. There are more than 40 investigations dealing with QTL or genes for various traits, reporting a total of 126 QTL spanning this chromosome alone. In the present review, we surveyed QTL or genes on BTA14 discovered in both dairy and beef cattle. Since many of these studies used different sets of markers, mostly microsatellites, we integrated them into the current genome assembly (Btau 4_0) (http://www.ncbi.nlm.nih.gov/projects/genome/guide/cow/) in order to standardize QTL locations. Such a genome assembly anchored QTL map provides the best view on QTL density for each phenotype and the potential links between QTL and functional genes for future study.
2. QTL detected on BTA14 in dairy cattle
In dairy cattle, the majority of QTL mapping on BTA14 are related to milk production traits, such as milk yield (MY), fat percentage (FP) or fat content, fat yield (FY), protein percentage (PP) or protein content and protein yield (PY) [2, 4, 5, 6, 11, 12, 13, 14, 15, 16, 17, 18, 19, 20, 21, 22, 23, 24, 25]. Other traits, such as reproduction (REPRO) (calving ease, CE; daughter pregnancy rate, DPR; non return rate, NRR; ovulation rate, OVR; pregnancy rate, PR and twinning, TWIN) [2, 18, 23, 26, 27], health (somatic cell score, SCS, and clinical mastitis, CLM) [18, 21, 25, 28, 29, 30] and udder related traits (URT) (fore udder attachment, FUA; front teat placement, FTP; rear udder width, RUW and udder somatic cell score, USCS) [2, 4, 23] were also investigated on BTA14. References, significance levels (p values or F values), peak or flanking marker(s), genome-anchored locations (in Mb), and linkage map locations (in cM) for each of these QTL are listed in Table 1.
QTL reported on BTA14 for milk production traits in dairy cattle.
| Reference | P or F* value | Markers | Mb | cM |
|---|---|---|---|---|
| FAT PERCENTAGE (FP) (or FAT CONTENT) | ||||
| Ashwell et al. 1997 | 0.0181 | BM302 | 33.62 | 52.37 |
| Ashwell et al. 2002 | 0.001 | BMS1678 | 9.19 | 14.01 |
| Ashwell et al. 2002 | 0.073 | BMS1678 | 9.19 | 14.01 |
| Ashwell et al. 2002 | <0.0001 | BMS1678 | 9.19 | 14.01 |
| Ashwell et al. 2004 | 23.1* | ILSTS039-BMS1678 | 1.20-9.19 | 0-14.01 |
| Bennewitz et al. 2003 | <0.01 | KIEL_E8 | 0.26 | 0 |
| Bennewitz et al. 2003 | <0.01 | KIEL_E8-RM180 | 0.26-17.16 | 0-33.31 |
| Bennewitz et al. 2004 | <0.001 | DGAT1 | 0.44 | 18.70 |
| Boichard et al. 2003 | <0.001 | CSSM066 | 3.81 | 5.13 |
| Boichard et al. 2003 | 0.0004 | CSSM066 | 3.81 | 5.13 |
| Boichard et al. 2003 | 0.11 | CSSM066 | 3.81 | 5.13 |
| Heyen et al. 1999 | 0.0023 | BM1508 | 8.27 | 17.85 |
| Heyen et al. 1999 | <0.00001 | ILSTS039 | 1.2 | 0 |
| Kaupe et al. 2007 | <0.001 | CYP11B1 | 1.29 | 29.80 |
| Kaupe et al. 2007 | <0.001 | DGAT1 | 0.44 | 18.70 |
| Kuhn et al. 2004 | <0.0001 | CSSM066-ILSTS039 | 1.20-3.81 | 0-5.13 |
| Rodriguez-Zas et al. 2002 | ILSTS039 | 1.2 | 0 | |
| Ron et al. 1999 | 0.0003 | CSSM066 | 3.81 | 5.13 |
| Thaller et al. 2003 | <0.001 | CSSM066-ILSTS039 | 1.20-3.81 | 0-5.13 |
| Viitala et al. 2003 | <0.0029 | ILSTS039-BMS1747 | 1.20-7.87 | 0-10.50 |
| Zhang et al. 1998 | ILSTS011-BM302 | 11.78-33.62 | 25.71-52.37 | |
| FAT YIELD (FY) | ||||
| Ashwell et al. 2002 | <0.0001 | BMS1678 | 9.19 | 14.01 |
| Ashwell et al. 2004 | 12.1* | ILSTS039-BMS1678 | 1.20-9.19 | 0-14.01 |
| Ashwell et al. 2004 | 10.5* | BMS1941-BM8215 | 24.67-27.34 | 41.71-48.23 |
| Bennewitz et al. 2003 | <0.01 | KIEL_E8-CSSM066 | 0.26-3.81 | 5.13 |
| Bennewitz et al. 2003 | <0.01 | KIEL_E8-CSSM066 | 0.26-3.81 | 5.13 |
| Bennewitz et al. 2003 | <0.01 | KIEL_E8 | 0.26 | 0 |
| Bennewitz et al. 2004 | <0.01 | DGAT1 | 0.44 | 18.70 |
| Boichard et al. 2003 | 0.0011 | CSSM066 | 3.81 | 5.13 |
| Harder et al. 2006 | 0.01 | BM4513-BL1036 | 61.48-76.75 | 79.79-100.16 |
| Heyen et al. 1999 | 0.0005 | CSSM066 | 3.81 | 5.13 |
| Heyen et al. 1999 | 0.00002 | ILSTS039 | 1.2 | 0 |
| Kaupe et al. 2007 | <0.001 | CYP11B1 | 1.29 | 29.80 |
| Looft et al. 2001 | <0.01 | ILSTS039-CSSM066 | 1.20-3.81 | 0-5.13 |
| Thaller et al. 2003 | <0.001 | ILSTS039-CSSM066 | 1.20-3.81 | 0-5.13 |
| Viitala et al. 2003 | 0.0398 | ILSTS039-BMS1747 | 1.20-7.87 | 0-10.50 |
| Winter et al. 1998 | <0.0001 | ILSTS039-BM1508 | 1.20-8.27 | 0-17.85 |
| Zhang et al. 1998 | 2.25* | ILSTS011-BM302 | 11.78-33.62 | 25.71-52.37 |
| MILK YIELD (MY) | ||||
| Ashwell et al. 1997 | 0.0302 | BM302 | 33.62 | 52.37 |
| Bagnato et al. 2008 | 0.0501 | CSSM066 | 3.81 | 5.13 |
| Bagnato et al. 2008 | 0.0485 | BMS1747 | 7.87 | 10.5 |
| Bagnato et al. 2008 | 0.00148 | BMS947 | 51.274 | 69.8 |
| Bagnato et al. 2008 | 0.000311 | BL1036 | 76.75 | 100 |
| Bennewitz et al. 2003 | <0.01 | KIEL_E8 | 0.26 | 0 |
| Bennewitz et al. 2003 | <0.01 | KIEL_E8-CSSM066 | 0.26-3.81 | 5.13 |
| Boichard et al. 2003 | 0.02 | CSSM066 | 3.81 | 5.13 |
| Boichard et al. 2003 | 0.0002 | CSSM066 | 3.81 | 5.13 |
| Herder et al. 2006 | <0.01 | KIEL_EB-CSSM066 | 0.26-3.81 | 5.13 |
| Heyen et al. 1999 | 0.0052 | BM4305 | 65.03 | 83.31 |
| Kaupe et al. 2007 | <0.01 | CYP11B1 | 1.29 | 29.80 |
| Kaupe et al. 2007 | <0.001 | DGAT1 | 0.44 | 18.70 |
| Looft et al. 2001 | <0.01 | ILSTS039-CSSM066 | 1.20-3.81 | 0-5.13 |
| Rodriguez-Zas et al. 2002 | CSSM066 | 3.81 | 5.13 | |
| Schnabel et al. 2005 | 16.32* | BMC1207-BMS1899 | 34.16-51.17 | 51.94-69.01 |
| Thaller et al. 2003 | <0.001 | CSSM066-ILSTS039 | 1.20-3.81 | 0-5.13 |
| PROTEIN PERCENTAGE (PP) (or PROTEIN CONTENT) | ||||
| Ashewell et al. 2004 | 9.5* | BMS1678-ILSTS011 | 9.19-11.78 | 14.01-25.71 |
| Bagnato et al. 2008 | 0.014 | ILSTS039 | 1.20 | 0 |
| Bagnato et al. 2008 | 0.0045 | CSSM066 | 3.81 | 5.13 |
| Bagnato et al. 2008 | 0.015 | DIK2201 | 6.378 | 8.1 |
| Bagnato et al. 2008 | 0.012 | BMS2055 | 74.473 | 93.7 |
| Bennewitz et al. 2004 | <0.001 | DGAT1 | 0.44 | 18.70 |
| Boichard et al. 2003 | <0.001 | CSSM066 | 3.81 | 5.13 |
| Boichard et al. 2003 | <0.00001 | CSSM066 | 3.81 | 5.13 |
| Heyen et al. 1999 | 0.0048 | ILSTS039 | 1.2 | 0 |
| Kaupe et al. 2007 | <0.001 | CYP11B1 | 1.29 | 29.80 |
| Mosiq et al. 2001 | <0.01 | BM6425 | 73.84 | 95.14 |
| Rodriguez-Zas et al. 2002 | BM6425 | 73.84 | 95.14 | |
| Schnabel et al. 2005 | BMC1207-BMS1899 | 34.16-51.17 | 51.94-69.01 | |
| Thaller et al. 2003 | <0.001 | ILSTS039-CSSM066 | 1.20-3.81 | 0-5.13 |
| Viitala et al. 2003 | <0.0029 | BMS1747-BMS740 | 7.87-39.55 | 10.50-60.69 |
| Bennewitz et al. 2003 | <0.01 | RM180-CSSM066 | 3.81 | 5.13-35.31 |
| Bennewitz et al. 2003 | <0.01 | KIEL_E8 | 0.26 | 0 |
| Kaupe et al. 2007 | <0.001 | DGAT1 | 0.44 | 18.70 |
| Kaupe et al. 2007 | <0.001 | CYP11B1 | 1.29 | 29.80 |
| PROTEIN YIELD (PY) | ||||
| Ashwell et al. 2002 | 0.0005 | BM6425 | 73.84 | 95.14 |
| Ashwell et al. 2004 | 14.7 | BM4305-INRA100 | 65.03-75.88 | 83.31 |
| Bennewitz et al. 2003 | <0.01 | KIEL_E8 | 0.26 | 0 |
| Kaupe et al. 2007 | <0.001 | DGAT1 | 0.44 | 18.70 |
| Looft et al. 2001 | <0.01 | ILSTS039-CSSM066 | 1.20-3.81 | 0-5.13 |
| Thaller et al. 2003 | <0.01 | ILSTS039-CSSM066 | 1.20-3.81 | 0-5.13 |
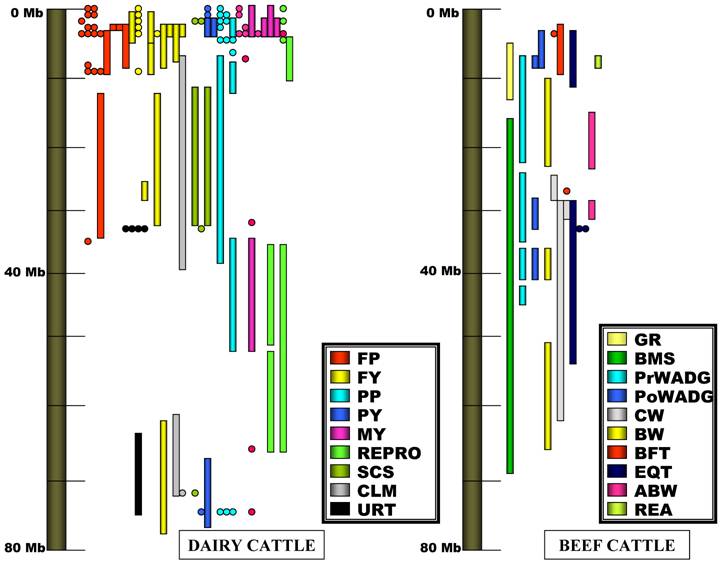
As shown in Figure 1, the region around 0 - 10 Mb has many QTL on the chromosome. Specifically, there are 56 QTL for five milk production traits, and seven QTL for other traits. In particular, 52 of these 56 milk production related QTL were clustered in a region of ~3.6 Mb (0.26-3.81 Mbp), including 15 QTL for fat % or fat content [11, 13, 5, 6, 14, 17, 18, 21, 22, 24], 13 QTL for fat yield [5, 6, 11, 13, 14, 18, 19, 24, 25, 31], 10 QTL for milk yield [4, 5, 14, 16, 18, 19, 21, 24], 10 QTL for protein % or protein content [5, 6, 14, 18, 24], and four QTL for protein yield [13, 18, 19, 24], respectively. Interestingly, this region of ~3.6 Mb on the assembly was expanded to a region of ~30 cM reported by different groups in the linkage map (Table 1). Therefore, our genome anchored QTL map significantly narrows the physical distance of QTL regions and perhaps provides the precise locations for identification of candidate genes.
Genome assembly anchored QTL map of BTA14 (see Tables 1-3). The gray bar on the left represents the visualization of BTA14 from 0 Mb to 80 Mb. Studies on dairy cattle are graphed on the left side with phenotypes represented by different colors, whereas studies in beef cattle are summarized on right side of the graph with phenotypes represented by different colors.
The high density of QTL for milk production traits in this small region of BTA14 has led to exploration of candidate genes in the region. In 2002, Grisart and colleagues [53] proposed that bovine diacylglycerol acyltransferase 1 (DGAT1) (at 0.44 Mb) is a promising candidate gene because a missense mutation (Lysine232Alanine) in the gene could explain the phenotypic variance in milk fat content and other milk characteristics. DGAT1 is a microsomal enzyme that utilizes diacylglycerol and fatty acyl CoA as substrates in order to catalyze the final stage of triacylglycerol synthesis [32]. Therefore, this gene should affect fat metabolism, including fat yield and percentage in the milk [33]. A knock-out study showed that both male and female Dgat-/- mice, even those fed a high fat diet, stabilized their weights and resisted fat storage [34], indicating the importance of DGAT1 in fat metabolism. Winter et al. [31] further found that the lysine variant was associated with higher milk fat content compared to its counterpart alanine variant in several cattle breeds.
Interestingly, Bennewitz and colleagues [14] observed a genome-wide significant conditional QTL effect on fat percentage at the proximal end of the chromosome and for protein percentage at a more distal chromosomal region in addition to the diallelic DGAT1 effects on milk, fat, and protein yield and fat and protein percentage. The authors argued that this conditional QTL effect might be caused by one or more additional alleles segregating at DGAT1 that were not previously detected, or by a second quantitative trait locus affecting these traits. Indeed, Kuhn et al. [17] reported strong evidence for segregation of at least three alleles in the promoter region of the DGAT1 gene that affects milk fat percentage. In the centromeric region of BTA14, cytochrome P450, family 11, subfamily B (CYP11B1) was also suggested to be the causative gene for the QTL related to fat metabolism [35]. The CYP11B1 gene was negatively associated with milk yield and protein yield, but positively associated with fat content [18].
Thirteen additional QTL for milk production traits were also identified outside this first 10Mb region on BTA14, including two at 33.62 Mb and 11.78 Mb - 33.62 Mb for fat percentage or fat content [4, 6], two at 24.67 Mb - 27.34Mb and 61.48 Mb - 76.75 Mb for fat yield [11, 16], three at 33.62 Mb, 34.158 Mb - 51.17 Mb and 65.03 Mb for milk yield [4, 6, 23], five (one at 7.87 Mb - 39.55 Mb, one at 34.16 Mb - 51.17 Mb and three at 73.84 Mb) for protein % [2, 20, 21, 23, 25] and one at 65.03 Mb - 75.88 Mb for protein yield [11] (Figure 1 and Table 1). However, no candidate genes have been explored for these QTL on BTA14.
During the past several decades, the high intensity of selection for milk yield has led to a significant improvement in milk production, but it has also led to a decline in reproductive efficiency in dairy cattle. In the United States, Washburn and colleagues [36] reported that from 1976 to 1999 the average number of days open increased from 122 to 152 days for Jerseys and from 124 to 168 days for Holsteins. Services per conception also increased, from 1.91 to 2.94 services for both breeds during the same period. There are at least 6 QTL for reproductive traits detected on BTA14 (Figure 1 and Table 2). Calving ease QTL is located at 1.294 Mb [18], while both ovulation rate and twinning rate might share a common QTL region from 34.16 Mb to 65.38 Mb [26, 27]. However, it seems that three pregnancy related phenotypes have no common QTL locations: non-return rate is placed at 0.44 Mb [18], pregnancy rate at 3.81 Mb - 11.78 Mb [11], and daughter pregnancy rate (DPR) at 34.16 Mb - 51.17 Mb [23] (Figure 1). Defining QTL ontology should be considered by the community in the future to search for common QTL for a given phenotype.
QTL reported on BTA14 for health, reproduction and udder related traits in dairy cattle.
| Reference | P value | Markers | Mb | cM |
|---|---|---|---|---|
| CLINICAL MASTITIS (CLM) | ||||
| Klungland et al. 2001 | BM4513-BM6425 | 61.48-73.84 | 79.79-95.14 | |
| Rupp et al. 2003 | <0.01 | BM6425 | 73.84 | 95.14 |
| Viitala et al. 2003 | 0.01 | BMS1747-BMS740 | 7.86-39.55 | 10.50-60.69 |
| REPRODUCTIVE TRAITS | ||||
| Kaupe et al. 2007 for CE | <0.05 | CYP11B1 | 1.29 | 29.80 |
| Schnabel et al. 2005 for DPR | BMC1207-BMS1899 | 34.16-51.17 | 51.94-69.01 | |
| Kaupe et al. 2007 for NRR | <0.05 | DGAT1 | 0.44 | 18.70 |
| Gonda et al. 2004 for OVR | 0.014 | BMS947-BM4305 | 51.27-65.03 | 83.31 |
| Ashwell et al. 2004 for PR | 0.01 | ILSTS011-CSSM066 | 3.81-11.78 | 5.13-25.71 |
| Cobanoglu et al. 2005 for TWIN | 0.001 | BMC1207-BM2934 | 34.16-65.38 | 51.94 |
| SOMATIC CELL SCORE (SCS) | ||||
| Ashwell et al. 1998 | 0.0096 | BM302 | 33.62 | 52.37 |
| Kaupe et al. 2007 | <0.001 | CYP11B1 | 1.29 | 29.80 |
| Kaupe et al. 2007 | <0.05 | CYP11B1 | 1.29 | 29.80 |
| Rodriguez-Zas et al. 2002 | BM6425 | 73.84 | 95.14 | |
| Rupp et al. 2003 | <0.10 | ILSTS011-BM302 | 11.78-33.62 | 25.71-52.37 |
| Zhang et al. 1998 | ILSTS011-BM302 | 11.78-33.62 | 25.71-52.37 | |
| UDDER RELATED TRAITS (URT) | ||||
| Ashwell et al. 1997 for udder | 0.0052 | BM302 | 33.62 | 52.37 |
| Ashwell et al. 1997 for USCS | 0.006 | BM302 | 33.62 | 52.37 |
| Ashwell et al. 2002 for FUA | 0.0703 | BM302 | 33.62 | 52.37 |
| Ashwell et al. 2002 for FTP | 0.04 | BM302 | 33.62 | 52.37 |
| Schnabel et al. 2005 for RUW | 0.01 | BM4305-BL1036 | 65.03-76.75 | 83.31-100.16 |
Mastitis affects every dairy farm and up to 50% of all dairy cattle in the United States [37]. Economic losses are an estimated $180 per cow per year or $2 billion annually in the United States of America [38]. A total of 10 QTL for the disease were reported on BTA14, including three for clinical mastitis [25, 29, 30] and seven for somatic cell score (SCS) [4, 18, 21, 28, 30]. A region around 1.29 Mb with CYP11B1 harbors a significant QTL for SCS, but two other regions, one at 7.86 Mb - 39.55 Mb and the other at 61.48 Mb - 73.84 Mb might share QTL for both clinical mastitis and SCS. These data indicate that QTL information on SCS would help reduce incidence of clinical mastitis in dairy cattle. In addition, SCS has been widely used to indirectly measure udder traits in dairy cattle [39]. As shown in Figure 1 and Table 2, QTL for udder traits are also found in the same region as QTL for SCS, indicating that these traits are either controlled by the same gene or by genes in a linkage.
3. QTL detected on BTA14 in beef cattle
In beef cattle, QTL mapping has been mainly focused on growth traits, carcass and meat quality. The targeted phenotypes include hot carcass weight [7, 40], rib eye area (REA) [8, 41], average daily gain (ADG) [40, 42], intramuscular fat deposition (marbling) [9] and subcutaneous fat depth (backfat-EBV or fat thickness) [9, 8, 43, 44] (Table 3). Bos indicus (Brahman) and Bos taurus (Angus or Hereford) breeds have been heavily used in QTL mapping by Casas et al. [9], Kneeland et al. [42], Stone et al. [41] and Kim et al. [7]. Other commonly used breeds include: Wagyu [40], Belgian Blue [9] or composite breeds (½ Red Angus, ¼ Tarentaise and ¼ Charolais) [8], or mixed breeds, such as ¼ Angus, ¼ Hereford, ¼ Red Poll and ¼ Pinzgauer cows with Piedmontese X Angus sire [44].
QTL reported on BTA14 for growth, carcass, meat quality and eating quality traits in beef cattle.
| Reference | P value | Markers | Mb | cM |
|---|---|---|---|---|
| PRE-WEANNING AVERAGE DAILY GAIN (PrWADG) | ||||
| Kneeland et al. 2004 | 0.046 | BMS1941-BMC1207 | 24.67-34.16 | 41.71-51.94 |
| Kneeland et al. 2004 | 0.041 | BM1577-BMS108 | 41.23-46.69 | 63.16-67.67 |
| Kneeland et al. 2004 | 0.023 | BMC1207-BM1577 | 34.16-41.23 | 51.94-63.16 |
| Mizoshita et al. 2004 | BM1508-BMS1941 | 8.27-24.67 | 17.85-41.71 | |
| POST-WEANNING AVERAGE DAILY GAIN (PoWADG) | ||||
| Kneeland et al. 2004 | 0.026 | BMS1747-TG | 7.66-7.87 | 10.50-11.95 |
| Kneeland et al. 2004 | 0.025 | CSSM66-BMS1747 | 3.81-7.87 | 5.13-10.50 |
| Kneeland et al. 2004 | 0.039 | BMC1207-BM1577 | 34.16-41.23 | 51.94-63.16 |
| Mizoshita et al. 2004 | BM8125-ILSTS008 | 27.34-32.08 | 50.92-66.48 | |
| BIRTH WEIGHT (BW) | ||||
| Kneeland et al. 2004 | 0.031 | BMS1899-RM137 | 51.17-67.66 | 69.01-85.18 |
| Kneeland et al. 2004 | 0.006 | BMS1678-BMS1941 | 9.19-24.67 | 14.01-41.71 |
| Kneeland et al. 2004 | 0.049 | BMC1207-BM1577 | 34.16-41.23 | 51.94-63.16 |
| CARCASS WEIGHT (CW) | ||||
| Kim et al. 2003 | 0.611 | RM011-BM4513 | 27.20-61.48 | 43.63-79.79 |
| Mizoshita et al. 2004 | 0.016 | BMS1941-INRA094 | 24.67-28.80 | 41.71-49.83 |
| Mizoshita et al. 2004 | BM8125-ILSTS008 | 27.34-32.08 | 50.92-66.48 | |
| BACKFAT THICKNESS (BFT) | ||||
| Casas et al. 2000 | 0.47 | RM180-RM011 | 17.16-27.2 | 35.31-43.63 |
| Casas et al. 2003 | 0.24 | ILSTS039-DIK5082 | 1.20-9.86 | 0-21.30 |
| Moore et al. 2004 | 0.0058 | CSSM066 | 3.81 | 5.13 |
| BEEF MARBLING SCORE (BMS) | ||||
| Casas et al. 2003 | 0.45 | DIK2008-DIK4087 | 16.43-68.33 | 31.26-86.63 |
| AVERAGE BODY WEIGHT (ABW) | ||||
| Mizoshita et al. 2004 | BM8125-ILSTS008 | 27.34-32.08 | 50.92-66.48 | |
| Mizoshita et al. 2004 | MNB-14-BMS1941 | 16.97-24.67 | 32.12-41.71 | |
| EATING QUALITY TRAITS (EQT) | ||||
| Casas et al. 2003 for CHOICE | 0.26 | ILSTS039-DIK4681 | 1.20-12.58 | 0-25.71 |
| Guiterez-Zas et al. 2007 for pH | 0.0013 | RM011-PZ271 | 27.20-54.15 | 43.63 |
| Guiterez-Zas et al. 2007 for GBFI | 0.0084 | BM302 | 33.62 | 52.37 |
| Guiterez-Zas et al. 2007 for GAFI | 0.0166 | BM302 | 33.62 | 52.37 |
| GROWTH RATE (GR) | ||||
| Miyata et al. 2004 | 0.05 | CSSM066-ILSTS011 | 3.81-11.78 | 5.13-25.71 |
| RIB EYE AREA (REA) | ||||
| Stone et al. 1999 | DIK5377-DIK5082 | 8.54-9.86 | 17.85-21.23 | |
In contrast to the high number of QTL discovered in dairy cattle, the region between 0 Mb - 10 Mb on BTA14 harbors only a few QTL for beef cattle traits, including two for post-weaning average daily gain (PoWADG) [42], one for backfat thickness (BFT) [9, 43], one for % USDA choice (CHOICE) [9] and one for average body weight (ABW) [40] (Figure 1 and Table 3). DGAT1, which is responsible for lipid metabolism traits in dairy cattle, was also tested in beef cattle. Unfortunately, Moore and colleagues [43] failed to observe any significant association of the DGAT1 polymorphism with backfat EBV. On the other hand, Barendse et al. [45] found that the TG gene, which is located at 7.658 Mb on the chromosome, is significantly associated with marbling score in beef cattle. The association was further confirmed by the same group using another population of feedlot cattle [46]. In contrast, Moore and colleagues [43] failed to confirm the association of polymorphisms in the TG gene with any lipid metabolism traits (backfat EBV). Even so, Moore et al [43] did not exclude the possibility of other polymorphisms in DGAT1 or TG that might have a significant effect on backfat reported in other studies.
Broadly speaking, most QTL on BTA14 discovered in beef cattle fall into a region of 30 Mb, from 15 Mb to 45 Mb, including two QTL for PoWADG, four for pre-weaning average daily gain (PrWADG) [42], three for birth weight (BW) [42], three for carcass weight (CW) [7, 40], one for BFT [9], one for beef marbling score (BMS) [9] and two for ABW [40] (Figure 1 and Table 3). In addition, there is evidence that somewhere along these two regions on BTA14, there are also QTL for some eating quality traits (EQT) (24.67-46.69 Mbp): pH at 24h post-mortem and grilled beef flavor intensity (GBFI) bracketed by RM11-PZ271, and grilled abnormal flavor intensity (GAFI) bracketed by CSSM066-RM11 markers [3].
Since both DGAT1 and TG are located in the region of 0 Mb - 10 Mb on BTA14, it is obvious that they cannot serve as candidate genes for QTL located in the region of 15 Mb - 45 Mb. Therefore, we targeted two candidate genes in the 15 Mb - 45 Mb region: corticotrophin releasing hormone (CRH) and fatty acid binding protein 4 (FABP4). The former is located at position 31.49 Mb, while the latter is positioned at 41.95 Mb on the newly assembled bovine genome map. CRH, which is a stress hormone, is released to the anterior pituitary to stimulate the secretion of adrenocorticotrophic hormone (ACTH), which upregulates cortisol. Cortisol has many significant metabolic effects that include stimulating gluconeogenesis in the liver, inhibiting glucose uptake in muscle and adipose tissue, and stimulating fat breakdown in adipose tissue [47]. In addition, transgenic mice with overexpression of CRH exhibit muscle wasting, decreased linear growth and obesity [48], whereas porcine CRH was reported to be significantly associated with backfat thickness, carcass length, average daily mass gain and REA [49]. Thus, CRH is a good positional candidate gene for fat-related traits. Buchanan et al. 2005 [52] showed three SNPs that were associated with REA (P < 0.034) and hot carcass mass (P < 0.0015) in a Charolais-cross steer population. In 2007, Wibowo et al. [47] discovered a new SNP in the bovine CRH gene that is highly associated with backfat thickness (P < 0.001) in a Wagyu X Limousin F2 population.
FABP4, on the other hand, is a member of the fatty acid binding protein family that is thought to play a major role in the regulation of lipid and glucose homeostasis through its interaction with perioxisome proliferator-activated receptors (PPARs) [50]. In addition, FABP4 is also shown to interact with lipase, a primary enzyme involved in lipid catabolism, which regulates lipid hydrolysis and intracellular fatty acid trafficking [51]. Hence, FABP4 is a strong candidate gene for obesity as it is also located in the region of quantitative trait loci (QTL) for serum leptin levels in mice [54]. In 2006, Michal et al. [51] reported a significant association of FABP4 gene with marbling score and fat thickness in a Wagyu X Limousin F2 cross with P-values of 0.0246 and 0.0398, respectively.
4. Conclusion
We reviewed more than 40 investigations related to identification of QTL for economically important traits on BTA14 in both dairy and beef cattle and anchored 126 QTL into the current bovine genome assembly. Such a process standardized the QTL locations by avoiding many conflicts reported on different linkage maps and linked the QTL to the functional gene regions. We believe that such an anchored QTL map further improves our ability to understand the genetic complexity of economically important traits located on BTA14 in both dairy and beef cattle.
Acknowledgements
This research was funded by an Emerging Research Issues Internal Competitive Grant from Washington State University, College of Agricultural, Human, and Natural Resource Sciences, Agricultural Research Center, Pullman, Washington State.
Conflict of interests
The authors have declared that no conflict of interest exists.
References
1. Williams JL, Eggen A, Ferretti L. et al. A bovine whole-genome radiation hybrid panel and outline map. Mamm Genome. 2002;13:469-474
2. Ashwell MS, Van Tassell CP, Sonstegard TS. A genome scan to identify quantitative trait loci affecting economically important traits in a US Holstein population. J Dairy Sci. 2001;84:2535-2542
3. Gutiérrez-Gil B, Wiener P, Nute GR. et al. Detection of quantitative trait loci for meat quality traits in cattle. Anim Genet. 2008;39:51-61
4. Ashwell MS, Da Y, VanRaden PM, Rexroad CE Jr, Miller RH. Detection of putative loci affecting conformational type traits in an elite population of United States Holsteins using microsatellite markers. J Dairy Sci. 1998;81:1120-1125
5. Boichard D, Grohs C, Bourgeois F. et al. Detection of genes influencing economic traits in three French dairy cattle breeds. Genet Sel Evol. 2003;35:77-101
6. Heyen DW, Weller JI, Ron M. et al. A genome scan for QTL influencing milk production and health traits in dairy cattle. Physiol Genomics. 1999;1:165-175
7. Kim JJ, Farnir F, Savell J, Taylor JF. Detection of quantitative trait loci for growth and beef carcass fatness traits in a cross between Bos taurus (Angus) and Bos indicus (Brahman) cattle. J Anim Sci. 2003;81:1933-1942
8. MacNeil MD, Grosz MD. Genome-wide scans for QTL affecting carcass traits in Hereford x composite double backcross populations. J Anim Sci. 2002;80:2316-2324
9. Casas E, Shackelford SD, Keele JW, Koohmaraie M, Smith TP, Stone RT. Detection of quantitative trait loci for growth and carcass composition in cattle. J Anim Sci. 2003;81:2976-2983
10. Marques E, de Givry S, Stothard P. et al. A high resolution radiation hybrid map of bovine chromosome 14 identifies scaffold rearrangement in the latest bovine assembly. BMC Genomics. 2007;8:254
11. Ashwell MS, Heyen DW, Sonstegard TS. et al. Detection of quantitative trait loci affecting milk production, health, and reproductive traits in Holstein cattle. J Dairy Sci. 2004;87:468-475
12. Bagnato A, Schiavini F, Rossoni A. et al. Quantitative trait loci affecting milk yield and protein percentage in a three-country Brown Swiss population. J Dairy Sci. 2008;91:767-783
13. Bennewitz J, Reinsch N, Grohs C. et al. Combined analysis of data from two granddaughter designs: A simple strategy for QTL confirmation and increasing experimental power in dairy cattle. Genet Sel Evol. 2003;35:319-338
14. Bennewitz J, Reinsch N, Paul S. et al. The DGAT1 K232A mutation is not solely responsible for the milk production quantitative trait locus on the bovine chromosome 14. J Dairy Sci. 2004;87:431-442
15. Coppieters W, Riquet J, Arranz JJ. et al. A QTL with major effect on milk yield and composition maps to bovine chromosome 14. Mamm Genome. 1998;9:540-544
16. Harder B, Bennewitz J, Reinsch N. et al. Mapping of quantitative trait loci for lactation persistency traits in German Holstein dairy cattle. J Anim Breed Genet. 2006;123:89-96
17. Kühn C, Thaller G, Winter A. et al. Evidence for multiple alleles at the DGAT1 locus better explains a quantitative trait locus with major effect on milk fat content in cattle. Genetics. 2004;167:1873-1881
18. Kaupe B, Brandt H, Prinzenberg EM, Erhardt G. Joint analysis of the influence of CYP11B1 and DGAT1 genetic variation on milk production, somatic cell score, conformation, reproduction, and productive lifespan in German Holstein cattle. J Anim Sci. 2007;85:11-21
19. Looft C, Reinsch N, Karall-Albrecht C. et al. A mammary gland EST showing linkage disequilibrium to a milk production QTL on bovine Chromosome 14. Mamm Genome. 2001;12:646-650
20. Mosig MO, Lipkin E, Khutoreskaya G, Tchourzyna E, Soller M, Friedmann A. A whole genome scan for quantitative trait loci affecting milk protein percentage in Israeli-Holstein cattle, by means of selective milk DNA pooling in a daughter design, using an adjusted false discovery rate criterion. Genetics. 2001;157:1683-1698
21. Rodriguez-Zas SL, Southey BR, Heyen DW, Lewin HA. Interval and composite interval mapping of somatic cell score, yield, and components of milk in dairy cattle. J Dairy Sci. 2002;85:3081-91
22. Ron M, Heyen DW, Weller JI. et al. Detection and analysis of a locus affecting milk concentration in a US and Israeli dairy cattle population. Proc 6th World Congr. Genet. Appl. Livest. Prod. 1998;26:422-425
23. Schnabel RD, Sonstegard TS, Taylor JF, Ashwell MS. Whole-genome scan to detect QTL for milk production, conformation, fertility and functional traits in two US Holstein families. Anim Genet. 2005;36:408-416
24. Thaller G, Krämer W, Winter A, Kaupe B, Erhardt G, Fries R. Effects of DGAT1 variants on milk production traits in German cattle breeds. J Anim Sci. 2003;81:1911-1918
25. Viitala SM, Schulman NF, de Koning DJ, Elo K, Kinos R, Virta A, Virta J, Mäki-Tanila A, Vilkki JH. Quantitative trait loci affecting milk production traits in Finnish Ayrshire dairy cattle. J Dairy Sci. 2003;86:1828-1836
26. Cobanoglu O, Berger PJ, Kirkpatrick BW. Genome screen for twinning rate QTL in four North American Holstein families. Anim Genet. 2005;36:303-308
27. Gonda MG, Arias JA, Shook GE, Kirkpatrick BW. Identification of an ovulation rate QTL in cattle on BTA14 using selective DNA pooling and interval mapping. Anim Genet. 2004;35:298-304
28. Ashwell MS, Da Y, Van Tassell CP, Vanraden PM, Miller RH, Rexroad CE Jr. Detection of putative loci affecting milk production and composition, health, and type traits in a United States Holstein population. J Dairy Sci. 1998;81(12):3309-3314
29. Klungland H, Sabry A, Heringstad B. et al. Quantitative trait loci affecting clinical mastitis and somatic cell count in dairy cattle. Mamm Genome. 2001;12:837-842
30. Rupp R, Lagriffoul G, Astruc JM, Barillet F. Genetic parameters for milk somatic cell scores and relationships with production traits in French Lacaune dairy sheep. J Dairy Sci. 2003;86:1476-1481
31. Winter A, Krämer W, Werner FA. et al. Association of a lysine-232/alanine polymorphism in a bovine gene encoding acyl-CoA:diacylglycerol acyltransferase (DGAT1) with variation at a quantitative trait locus for milk fat content. Proc Natl Acad Sci U S A. 2002;99:9300-9305
32. Cases S, Smith SJ, Zheng YW. et al. Identification of a gene encoding an acyl CoA:diacylglycerol acyltransferase, a key enzyme in triacylglycerol synthesis. Proc Natl Acad Sci U S A. 1998;95:13018-13023
33. Cases S, Stone SJ, Zhou P. et al. Cloning of DGAT2, a second mammalian diacylglycerol acyltransferase, and related family members. J Biol Chem. 2001;276:38870-38876
34. Smith SJ, Cases S, Jensen DR. et al. Obesity resistance and multiple mechanisms of triglyceride synthesis in mice lacking Dgat. Nat Genet. 2000;25:87-90
35. de Roos AP, Schrooten C, Mullaart E, Calus MP, Veerkamp RF. Breeding value estimation for fat percentage using dense markers on Bos taurus autosome 14. J Dairy Sci. 2007;90:4821-4829
36. Washburn SP, Silvia WJ, Brown CH, McDaniel BT, McAllister AJ. Trends in reproductive performance in Southeastern Holstein and Jersey DHI herds. J Dairy Sci. 2002;85:244-251
37. Owen JB, Axford RF, Bishop SC. Mastitis in dairy cattle. In: (ed.) Axford RF, Bishop SC, Nicholas FW, Owen JB. Breeding for disease resistance in farm animals. Wallingord: CAB International. 2000:243-52
38. Nash DL, Rogers GW, Cooper JB, Hargrove GL, Keown JF, Hansen LB. Heritability of clinical mastitis incidence and relationships with sire transmitting abilities for somatic cell score, udder type traits, productive life, and protein yield. J Dairy Sci. 2000;83:2350-2360
39. Pösö J, Mäntysaari EA. Relationships between clinical mastitis, somatic cell score, and production for the first three lactations of Finnish Ayrshire. J Dairy Sci. 1996;79:1284-1291
40. Mizoshita K, Watanabe T, Hayashi H. et al. Quantitative trait loci analysis for growth and carcass traits in a half-sib family of purebred Japanese Black (Wagyu) cattle. J Anim Sci. 2004;82:3415-3420
41. Stone RT, Keele JW, Shackelford SD, Kappes SM, Koohmaraie M. A primary screen of the bovine genome for quantitative trait loci affecting carcass and growth traits. J Anim Sci. 1999;77:1379-1384
42. Kneeland J, Li C, Basarab J. et al. Identification and fine mapping of quantitative trait loci for growth traits on bovine chromosomes 2, 6, 14, 19, 21, and 23 within one commercial line of Bos taurus. J Anim Sci. 2004;82:3405-3414
43. Moore SS, Li C, Basarab J. et al. Fine mapping of quantitative trait loci and assessment of positional candidate genes for backfat on bovine chromosome 14 in a commercial line of Bos taurus. J Anim Sci. 2003;81:1919-1925
44. Casas E, Shackelford SD, Keele JW, Stone RT, Kappes SM, Koohmaraie M. Quantitative trait loci affecting growth and carcass composition of cattle segregating alternate forms of myostatin. J Anim Sci. 2000;78:560-569
45. Barendse WJ. Assessing lipid metabolism - International patent application number PCT/AU98/00882. International publication No WO 99/23248. 1999
46. Wood IA, Moser G, Burrell DL, Mengersen KL, Hetzel DJ. A meta-analytic assessment of a thyroglobulin marker for marbling in beef cattle. Genet Sel Evol. 2006;38:479-494
47. Wibowo TA, Michal JJ, Jiang Z. Corticotropin releasing hormone is a promising candidate gene for marbling and subcutaneous fat depth in beef cattle. Genome. 2007;50:939-945
48. Stenzel-Poore MP, Cameron VA, Vaughan J, Sawchenko PE, Vale W. Development of Cushing's syndrome in corticotropin-releasing factor transgenic mice. Endocrinology. 1992;130:3378-3386
49. Muráni E, Murániová M, Ponsuksili S, Schellander K, Wimmers K. Molecular characterization and evidencing of the porcine CRH gene as a functional-positional candidate for growth and body composition. Biochem Biophys Res Commun. 2006;342:394-405
50. Damcott CM, Feingold E, Moffett SP. et al. Genetic variation in uncoupling protein 3 is associated with dietary intake and body composition in females. Metabolism. 2004;53:458-464
51. Michal JJ, Zhang ZW, Gaskins CT, Jiang Z. The bovine fatty acid binding protein 4 gene is significantly associated with marbling and subcutaneous fat depth in Wagyu x Limousin F2 crosses. Anim Genet. 2006;37:400-402
52. Buchanan FC, Thue TD, Yu P, Winkelman-Sim DC. Single nucleotide polymorphisms in the corticotrophin-releasing hormone and pro-opiomelancortin genes are associated with growth and carcass yield in beef cattle. Anim Genet. 2005;36:127-131
53. Grisart B, Coppieters W, Farnir F. et al. Positional candidate cloning of a QTL in dairy cattle: identification of a missense mutation in the bovine DGAT1 gene with major effect on milk yield and composition. Genome Res. 2002;12:222-231
54. Ogino T, Moralejo DH, Kose H, Yamada T, Matsumoto K. Serum leptin concentration is linked to chromosomes 2 and 6 in the OLETF rat, an animal model of type 2 diabetes with mild obesity. Mamm Genome. 2003;14:839-444
55. Miyata M, Gasparin G, Coutinho LL. et al. Quantitative trait loci (QTL) mapping for growth traits on bovine chromosome 14. Genet Mol Biol. 2007;30:364-369
56. Spelman RJ, Ford CA, McElhinney P, Gregory GC, Snell RG. Characterization of the DGAT1 gene in the New Zealand dairy population. J Dairy Sci. 2002;85:3514-3417
Author contact
![]() Correspondence to: Zhihua Jiang, Tel: +509 335 8761; Fax: +509 335 4246; E-mail: jiangzedu
Correspondence to: Zhihua Jiang, Tel: +509 335 8761; Fax: +509 335 4246; E-mail: jiangzedu