International Journal of Biological Sciences
ISSN: 1449-2288
10
Impact Factor
ISSN: 1449-2288

 Global reach, higher impact
Int J Biol Sci 2009; 5(6):517-527. doi:10.7150/ijbs.5.517 This issue Cite
Research Paper
Gene expression profiling of chromophobe renal cell carcinomas and renal oncocytomas by Affymetrix GeneChip using pooled and individual tumours
Maria V. Yusenko, Dmitry Zubakov*, Gyula Kovacs ![]()
Laboratory of Molecular Oncology, Medical Faculty, Ruprecht-Karls University, Heidelberg, Germany
* Present address: Department of Forensic Molecular Biology, Erasmus University Medical Centre Rotterdam, P.O. Box 2040, 3000 CA Rotterdam, The Netherlands
Received 2009-6-10; Accepted 2009-7-25; Published 2009-7-29
Citation:
Yusenko MV, Zubakov D, Kovacs G. Gene expression profiling of chromophobe renal cell carcinomas and renal oncocytomas by Affymetrix GeneChip using pooled and individual tumours. Int J Biol Sci 2009; 5(6):517-527. doi:10.7150/ijbs.5.517. https://www.ijbs.com/v05p0517.htm
Other stylesAbstract
Due to overlapping morphology, malignant chromophobe renal cell carcinomas (RCC) and benign renal oncocytomas (RO) may pose a diagnostic problem. In the present study, we have applied different algorithms to evaluate the data sets obtained by hybridisation of pooled and also individual samples of renal cell tumours (RCT) onto two different gene expression platforms. The two approaches revealed high similarities in the gene expression profiles of chromophobe RCCs and ROs but also some differences. After identifying the differentially expressed genes by statistic analyses, the candidate genes were further selected by a real time and normal RT-PCR and their products were analysed by immunohistochemistry. We have identified CD82 and S100A1 as valuable markers for chromophobe RCC as well as AQP6 for ROs. However, these genes are expressed at the protein level in other types of RCTs as well albeit at a low frequency and low intensity. As none of the selected genes marks exclusively one type of RCTs, for the differential diagnosis of chromophobe RCCs and ROs, a set of markers such as CD82, S100A1 and AQP6 as well as some others would be an option in routine histological laboratories.
Keywords: chromophobe renal cell carcinoma, gene expression profile, real-time PCR, IHC, diagnosis.
1. Introduction
Renal cell tumours (RCT) are classified into four main types, such as conventional, papillary and chromophobe renal cell carcinomas (RCC) and renal oncocytomas (RO). Although chromophobe RCCs and ROs makes up only 10% of RCTs, their differential diagnosis is of clinical importance. RO is a benign tumour and chromophobe RCC, in spite of excellent survival rate of patients, is a malignant tumour. Both types of tumours are characterised by pathognomic histological pattern, but unusual cellular and growth variants are often misdiagnosed on H&E stained slides. Chromophobe RCCs display a loss of chromosomes 1, 2, 6, 10, 13, 17 and 21, the detection of which may help to establish the correct diagnosis (1); for review see (2). However, pathologists prefer to use immunohistochemistry as differential diagnostic approach, which allows to localise the markers to specific morphology under microscope. Recently, several studies using microarray technology suggested that gene expression pattern may distinguish different types of RCTs, but chromophobe RCCs and ROs were assigned to one cluster (3-8). Until now, only CD82 has been described as an appropriate diagnostic marker for chromophobe RCC (9-10).
In pilot study of gene expression profiling we used Affymetrix HG-U133 A and B set to characterize the transcriptome of distinct types of RCTs in pooled samples. In a second setting we have analysed individual tumours by applying the Affymetrix HG-U133 Plus2.0 GeneChip. Genes expressed differentially in chromophobe RCCs or ROs were proved by RT-PCR. Finally, candidate genes were analysed by immunohistochemistry on paraffin-embedded tissue blocks and tissue microarrays (TMA).
2. Material and Methods
2.1. Tissue samples and RNA isolation
Tumour and normal kidney tissues were obtained immediately after nephrectomy. A homogeneous appearing part of the tumour was divided into two parts, one of them was immediately snap frozen in liquid nitrogene and stored at -80°C and the another part was processed for histology as reference for the frozen material. The rest of tumour and kidney was processed for routine histology. The histological diagnosis was established according to the Heidelberg Classification of Renal Cell Tumours (11). The diagnosis of samples used for this study was confirmed by SNP- based array analysis (2). The collection and use of tissue samples, with the patients' previous informed consent, was approved by the Ethics Committee of the University of Heidelberg.
Total RNA from normal and tumour tissues was extracted by TRIzol reagent (Invitrogen GmbH, Karlsruhe, Germany) according to the manufacturer's recommendations. The concentration of RNA was measured with spectrophotometry. The absence of DNA contamination in RNA samples was confirmed by PCR using intron-specific primers for of GAPDH.
2.2. Gene expression profiling and data analysis: pooled samples
We pooled the RNA isolated from five normal kidneys, three Wilms' tumours, three papillary RCC without progression (pT1,G1) and two ones with metastatic growth (pT3,G3), five conventional RCCs without progression (pT1,G1) and four with deadly progression (pT3,G3), and also four chromophobe RCCs and three ROs. Total RNA was purified with Qiagen RNeasy Mini Kit (QIAGEN GmbH, Hilden, Germany). The cRNA synthesis, hybridization onto Affymetrix HG-U133 A and B array set (Affymetrix Inc., Santa Clara, USA) and first data analysis was performed at the German Resource Center for Genome Research (http://www.rzpd.de). Normalized and log2-transformed intensity data (44,928 probe sets) as well as corresponding present/absent and increased/decreased calls produced by the GCOS software (Affymetrix) were further processed using Microsoft Excel. The value in the pooled normal adult kidney samples was used as a baseline reference and relative expression values in pooled tumour samples were calculated. The genes that showed an adjusted signal log2 ratio above 1 or less than 1 in tumour samples were considered to be over- and under-expressed, respectively.
To compare the expression patterns among renal tumour subtypes, the expression profiles were analyzed by unsupervised hierarchical average linkage clustering algorithm supplied with the microarray data analysis tool TMEV (http://www.tm4.org/mev.html). The process of similarity measurements was based on the Pearson correlation. To identify genes (approx. 600 probe sets) that correlated significantly with chRCC and RO, a three fold-change threshold versus other tumour subtypes was used in combination with the Affymetrix difference call of increase, marginal increase, decrease and marginal decrease. Finally, 100 significant probe sets were manually selected and the information about the transcripts that they detect was annotated using information obtained from the Affymetrix NETAFFX database (www.affymetrix.com).
2.3. Gene expression profiling and data analysis: individual samples
In this setting we used high quality RNAs from 13 conventional RCCs without and 13 with deadly progression, 10 papillary RCCs without and 7 papillary RCCs with progression, four chromophobe RCCs, four ROs, two collecting duct carcinomas, four Wilms' tumours, one clear cell sarcoma of the kidney, one rhabdoid tumour of the kidney, one mucinous tubular and spindle cell carcinoma, as well as four adult and two fetal normal kidneys. The global gene expression profiling by using the Affymetrix HG-U133 Plus2.0 GeneChip oligonucleotide microarray was carried out at the Genomics Core Facility, EMBL, Heidelberg, Germany. The robust multi-array average algorithm of R and RMA implementation in Bioconductor package (http://www.bioconductor.org) was used to perform preprocessing of the .CEL files, including background adjustment, quartile normalization, and summarization. Data were further processed using Microsoft Excel. Expression measurements were transformed by computing the base-two logarithm before further analysis. Relative expression profiles were generated from the individual tumour expression profiles and the mean expression values of the four individual normal adult kidney expression profiles (53,677 probe sets).
Differential expression between chromophobe RCCs and ROs versus all other types of RCTs was assessed by ANOVA application supplied by the TMEV tool. Probe sets with P value of < 10-4 were considered significant. To compare the expression patterns among renal tumour subtypes and organize the differentially expressed transcripts the average linkage unsupervised hierarchical cluster analysis (HLC) was performed. The clustering algorithm groups both genes and samples by similarity in expression pattern that was based on the Pearson correlation. The significant analysis of microarrays (SAM) based on two-class unpaired analysis and available number of permutations was used to derive a list of probe sets identified as significantly changed (fold change ≥ 2) between chRCC and RO.
2.4. Functional annotation
Since the interpretation of the microarray results requires the presentation of the data in the context of their functional processes and cellular localization, the set of patterns identified as differentially expressed in chRCC or RO were subgrouped into respective functional categories and according to their cellular localization based on the latest currently available information stored in public domain Database for Annotation, Visualization and Integrated Discovery (DAVID, http://david.abcc.ncifcrf.gov) and reported GOTERM-BP (Biological process), GOTERM -CC (cellular component) and GOTERM-MF (molecular function) that had corrected P values of <0.01. Although some transcripts have poorly understood functions, functional assignments were possible for most genes.
2.5. Quantative RT-PCR
First strand cDNA synthesis was performed with 2µg of total RNA using SuperScript II reverse transcriptase (Invitrogen) and oligo-p(dT)23 primer according to the manufacturer's instructions. Real-time PCR was performed on a panel of primary RCTs and normal kidneys for assessing the relative expression of genes of interest and validation of microarray expression data. Primers were designed to span at least on intron of genomic sequence using Primer3 software http://frodo.wi.mit.edu/primer3/primer3_code.html and synthesized by MWG-Biotech AG (Ebersberg, Germany). The sequences of the gene-specific primers used in this study are available upon request. Reaction was performed in 15 µl using 6 μl of cDNA diluted 1:16 and Platinum SYBRGreen qPCR SuperMix-UDG (Invitrogen). After activation at 95 °C for 15 min, PCR product was amplified for 45 cycles (94°C denaturation for 30 s, 60oC primer annealing for 30 s, and 72°C extension for 45 s) followed by an additional 5 min step at 72 °C. Detection of product amplification, melting curve analysis and semi-quantification was performed by DNA Engine Opticon system (MJ Research, Inc., Watertown, USA). Relative quantity was calculated by dividing the gene specific expression with the expression of β-actin and GAPDH and then brought in correspondence with 100%-scale. All reactions were carried out in duplicates and the results were averaged using statistical analysis tools of MS Excel.
2.6. RT-PCR
RT-PCR was performed in automated thermal cycler (DNA Engine, Biozym Diagnostik GmbH, Hess.Oldendorf, Germany) in 15 µl reaction volume using 6 µl of cDNA diluted 1:16 and 0.75U Taq polymerase (Invitrogen). In preliminary experiments, cycle titration reactions determined numbers of cycles required for optimal detection was performed. The reaction was done over 30 and 35 cycles; with denaturation at 94°C for 30 sec, annealing at 64°C for 30 sec, elongation at 72°C for 45 sec and an additional 5 min elongation at 72°C. GAPDH was used as the control for equal loading and water as the no template. The expected band for each product was identified by a comigration of a DNA marker ladder electrophoresed in an adjacent lane.
2.7. Western blot analysis
The proteins were solubilized in the lysis buffer (62,5 mM Tris, 2% SDS, 10% sucrose, pH 6,8) containing protease inhibitors (Roche Diagnostics GmbH, Mannheim, Germany), and protein concentrations were measured by BCA Protein Assay kit (Pierce, Rockford, USA). 60 µg of proteins were size-fractioned by 12% SDS-PAGE, transferred electrophoretically to a nitrocellulose membrane (Protran, Whatman GmbH, Dassel, Germany) and blotted with rabbit polyclonal antibody raised against C-terminus of AQP6 (AB3073, Millipore GmbH, Schwalbach, Germany). An enhanced chemiluminescence (Western Lightning Plus-ECL, PerkinElmer LAS GmbH, Rodgau, Germany) system was used for the signal detection. The blot was reprobed with anti-β-actin antibody (AC-15, SIGMA-Aldrich GmbH, Steinhem, Germany) to control for loading.
2.8. Tissue microarray and immunohistochemistry
Original paraffin blocks of fetal and adult kidneys, chromophobe RCCs and ROs as well as tissue microarrays containing fetal and adult kidneys and distinct types of RCTs were used for this study. TMAs with 0,6 mm core biopsies was constructed after marking the areas of interest on H&E stained slides by one of the authors (GK) by a Manual Tissue Arrayer (MTA1, Beecher Instruments, Inc., Sun Prairie, USA).
The 4 µm sections were deparaffinized in xylene, and rehydrated in gradient ethanol. For antigen retrieval, heat pretreatment was performed using the Biocare pressure cooker (10 mM citrate buffer, pH 6.0). The sections were subsequently blocked with 10% normal goat serum (X0907, Dako Cytomation, USA) for 1 h, following by the incubation with primary antibody in a moist chamber at 4oC overnight. After endogenous peroxidase was quenched by 0.3% H2O2 for 15 min, following by incubation with RPH-conjugated secondary antibody (EnVision+ system, Dako North America, Inc., Carpinteria, USA) for 1 h. Visualization of the antigen antibody immunoreaction was completed using AEC (Dako North America, Inc.) for 10 min. The sections were counterstained with hematoxylin, mounted with aqueous permanent mounting medium Ultramount (Dako North America, Inc.) and cover-slipped with Pertex (Medite GmbH, Burgdorf, Germany). The slides were evaluated twice by one of the authors (GK). The following antibodies and dilutions were used: CLDN8 (1:100, GeneTex Inc., Irvine, USA), TMC5 (1:500, Abcam, Heidelberg, Germany), IHPK3 (1:200, Sigma-Aldrich GmbH, Steinhem, Germany), S100A1 (1:200, Acris Antibodies GmbH, Herford, Germany) and AQP6 (1:50, Millipore GmbH, Schwalbach, Germany).
3. Results
3.1. Gene expression profiling of pooled samples
Data obtained from this study are available at the Gene Expression Omnibus repository under accession number GSE6280 (GEO, http://www.ncbi.nih.gov/geo/). Unsupervised clustering based on the total gene expression profile revealed variations in up- and down-regulated transcripts among the ten histologically different pools (Figure 1A). However, highly similar expression patterns were existed between chromophobe RCC and RO pools, as it is shown by the dendogramm obtained.
We have filtered the expression profiles for transcripts expressed with more than three-fold difference between these groups and obtained an approx. 600 probe set. The transcripts were manually selected on the basis of the signal log ratio and corresponding present/absent and increased/decreased calls and also by taking into account the difference in the expression level in other renal tumour types. The stringent selection of candidates identified a small panel of 50 probe sets, which were differentially up- and down-regulated either in chromophobe RCCs or in ROs (Figure 2).
Figure 1
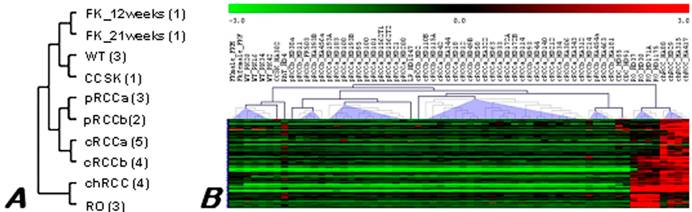
Hierarchical clustering tree of the expression profiles of RCTs. (A) Pooled material. Number of samples pooled in each group is shown in parenthesis, a and b marks tumours without and with progression, respectively. (B) Individual samples of different histological types of renal neoplasia. Overexpressed genes are marked by red and downregulated by green colour as indicated in the scale of expression. Although ROs and chromophobe RCCs are designated to the same branch of the tree, differences are also recognised. FK - fetal kidney, WT - Wilms' tumour, CCSK - clear cell sarcoma of the kidney, pRCC - papillary RCC, cRCC - conventional RCC, chRCC - chromophobe RCC, RO - renal oncocytoma, LP - mucinous tubular and spindle cell carcinoma, CDC - collecting duct carcinoma.
Figure 2
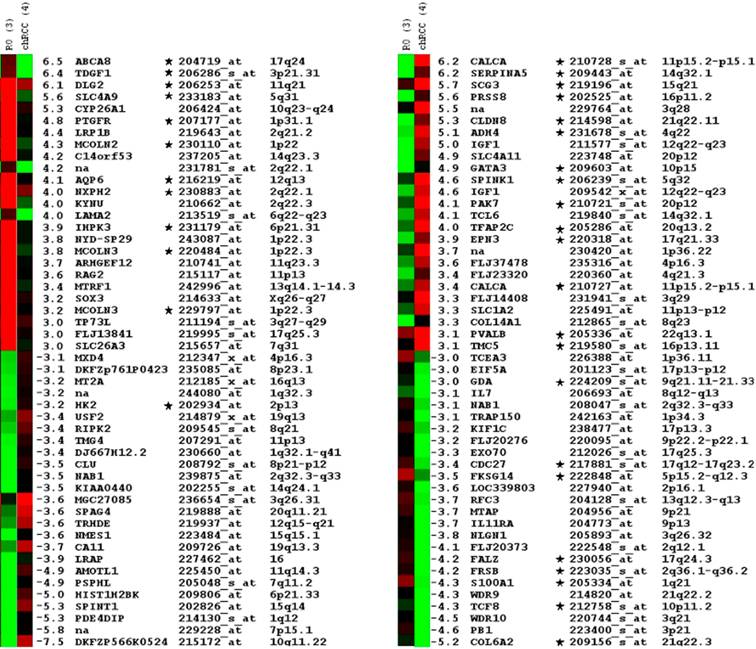
Top of the fifty differentially expressed probe sets in ROs and chromophobe RCC as identified by microarray hybridisation analysis of pooled samples and ordered by relative fold-changes ≥ 3. Green squares indicate transcript levels below the mean value; black squares, transcript levels equal to the median normal value; red squares, transcript levels higher than the mean value. Genes proved by real time RT-PCR are marked by star.
The probe sets from ROs and chromophobe RCCs were placed into the DAVID program, which identified statistically significant functional categories using Gene Ontology (GO). The analysis showed a strong over-expression of genes belonging to the cell-cell signalling, cell differentiation, development, protein binding and metabolic processes as well as a down-regulation of genes encoding intracellular (organelle) proteins associated with the regulation of biological processes in chRCC. Many genes up-regulated in RO encode proteins with transmembrane transporter activity and playing a role in signal transduction and cell communication, whereas intracellular proteins associated with cellular metabolic processes and cell proliferation had a lower expression.
3.2. Gene expression profiling of individual samples
Data of this study are available at the Gene Expression Omnibus repository under accession number GSE11151 (GEO, http://www.ncbi.nih.gov/geo/). Using normalized and log2-transformed microarray data obtained from distinct types of RCTs including four chromophobe RCC and RO approx. 6200 probe (12 %) sets were identified by ANOVA with P-value of < 10-4. A consistent relationship between a gene expression pattern and tumour types was detectable by unsupervised hierarchical clustering (Figure 1B). As chromophobe RCCs and ROs showed overlapping clusters, they were identified as one of the major branches. Of interest these types of RCT are characterized by the over-expression of genes rather than by under-expression.
The SAM analysis revealed differences between chromophobe RCCs and ROs. Among 503 probe sets obtained by this approach, including 289 and 214 transcripts for chromophobe RCC and RO, respectively. After removing the false positive genes by reading the data and also by taking into account the difference in expression level of the selected genes in a given group (all four samples) by comparing with others, a discrete set of fifty genes that consistently characterize chromophobe RCC and RO was obtained (Figure 3).
Figure 3
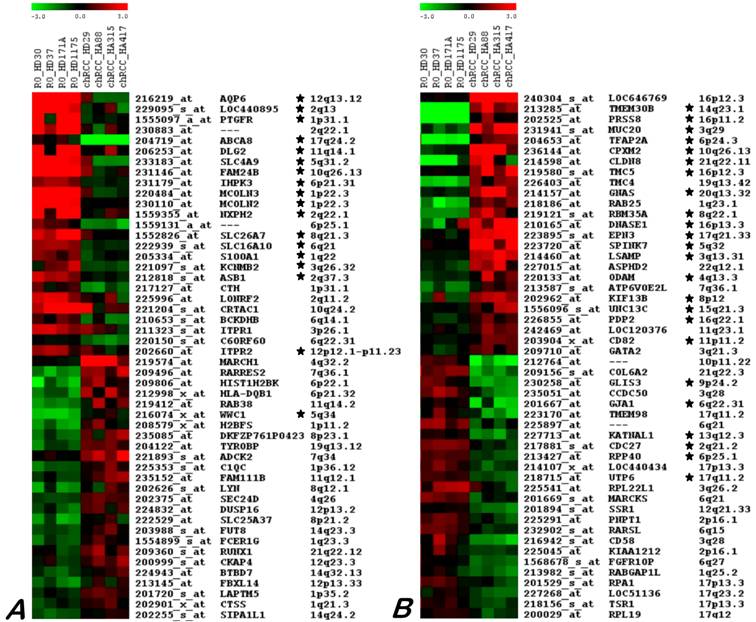
Twenty five genes up- and down-regulated in ROs (A) and chRCC (B) as identified by microarray hybridization analysis using individual samples. Each row represents a single probe set, whereas each column represents a single sample. The coloured scales at the top represent the expression ratios of genes. Green squares indicate transcript levels below the mean value; black squares a transcript level equal to the median normal value and red squares a transcript levels higher than the mean value. Genes proved by real time RT-PCR are marked by star.
The selection of genes up-regulated in chromophobe RCC based on their function indicated that a significant number of them encode proteins integrated to membrane and related to vesicle-mediated transport, protein binding, cell communication and metabolic process, whereas proteins encoded by down-regulated genes were intracellularly membrane-bounded and involved in regulation of biological processes. The genes overexpressed in RO encode for proteins which are integral to plasma membrane and related to ion transport and cell communication, whereas under-expressed genes were enriched for intracellular or membrane proteins playing a role in metabolic processes.
3.3. Validation of microarray data by RT-PCR
We performed a SYBR Green-based real-time RT-PCR of 61 genes up- or downregulated in chromophobe RCCs (40 genes) and ROs (21 genes) by microarray analysis using the two approaches (Figure 2 and 3). Quantitative RT-PCR on the panel of cDNA samples including eight individual cases of different types of RCTs as well as normal adult kidneys confirmed the up-regulation of four genes (CLDN8, PRSS8, TFAP2A, TMC5) in chromophobe RCC and ten genes (ABCA8, AQP6, DLG2, FAM24B, IHPK3, MCOLN2; MCOLN3, NXPH2, PTGFR3, SLC4A9) in ROs. We have also identified SCG3, SPINK1 and PAK7 as upregulated genes in chromophobe RCCs by analysis of the pooled samples. In addition up-regulation of CD82, RBM35A and TMC5 and down-regulation of GLIS3 in chromophobe RCCs and upregulation of S100A1 in ROs was selected by array analysis of individual samples and real-time RT-PCR.
To confirm the tumour specific expression of genes selected by Affymetrix array and real time RT-PCR, we have applied normal RT-PCR using 30 and 35 cycles of amplification to control the gene expression on the yes or no basis. We have confirmed the differential expression of four genes in chromophobe RCCs (CD82, CLDN8, RBM35A, and TMC5) and four genes in ROs (IHPK3, MCOLN2, S100A1, AQP6). The CD82 was specifically expressed in chromophobe RCCs at RNA and protein level (Yusenko and Kovacs, 2009). Although the CLDN8 was expressed in 18 of 19 chromophobe RCCs, we have detected a PCR product in 14 of 27 ROs as well. Consistent with the microarray data, RBM35A was highly expressed in 17 of 19 chromophobe RCCs whereas only two cases of RO showed a strong signal (2/29), 8 cases a weak signal (8/29), and the rest of samples (19/29) showed no expression of RBM35A. The TMC5 gene was expressed in 15 of the 19 chromophobe RCC and only in 6 of the 29 ROs with weak signal intensity except one case. None of the conventional and papillary RCCs showed the expression of TMC5.
The IHPK3 and MCOLN2 showed a variable expression by RT-PCR in distinct types of RCTs with only a slight predominance in ROs (data not shown). We found a positive amplification signal of the S100A1 in all but one of the 27 ROs, but also in 10 of the 19 chromophobe RCCs although with a weak signal except two cases (Figure 4A, B). The S100A1 was also expressed in conventional and papillary RCCs as well. By normal PCR, the AQP6 displayed a strong amplification product in 21 of 29 RO samples and only weak expression in 2 of the 19 chromophobe RCCs (Figure 4C, D). No expression of the AQP6 was detectable in conventional and papillary RCCs (Figure 4C). Western blot analysis also confirmed the selective expression of AQP6 protein in ROs versus chromophobe RCCs (Figure 4E).
Figure 4
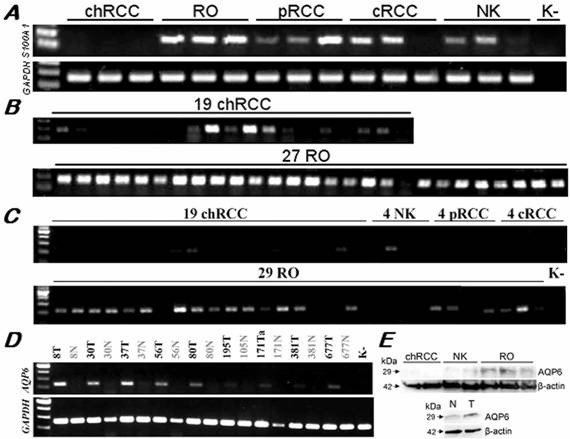
Expression of the S100A1 and AQP6 genes in RCTs and normal kidneys. (A) By normal PCR of a panel of distinct tumour types, S100A1 was positive in ROs and also other types of tumours but not in chromophobe RCCs. (B) Twenty six of the 27 ROs showed a strong amplification signal with the S100A1 specific primers. Only two of the 19 chromophobe RCCs displayed the same intensity signal, and 6 further cases showed a weak expression. (C) AQP6 was over-expressed specifically in ROs as compared with other types of renal tumours. Only 4 of the 19 chromophobe RCCs showed a weak expression. (D) The AQP6 gene was significantly overexpressed in ROs as compared to corresponding normal kidney tissues. (E) Preferential expression of the AQP6 protein in ROs was confirmed by Western blot analysis using tissues (above) and cell extracts (below). Variable quantities of cDNA amplification products and proteins among samples were adjusted with GAPDH and β-actin, respectively.
3.4. Immunohistochemical findings
The candidate markers selected by RT-PCR were further evaluated by immunohistochemical analysis on paraffin-embedded tissue sections and tissue microarrays using commercially available antibodies. An antibody against RBM35A is not available. Immunhistochemical studies using original paraffin embedded material as well as TMAs did not confirmed the differential expression of CLDN8, TMC5 and IHPK3 between RO and chromophobe RCC. Moreover, a weak expression of TMC5 and also CLDN8 was seen in conventional and papillary RCCs as well. The better staining results were obtained for S100A1 and AQP6. The S100A1 was expressed in 68 (92%) of the 74 ROs and also in 21 (26%) of the 80 chromophobe RCCs (Figure 5). It was also expressed in 55 (62%) of the 88 papillary RCCs and 73 (57%) of the 127 conventional RCCs. The AQP6 was positive in 43 (77%) of the 56 ROs and only 7 (16%) in the 43 chromophobe RCCs. In addition 2 of the 10 papillary RCCs but none of the 10 conventional RCCs showed a positive reaction with the AQP6 antibody (Figure 6).
Figure 5
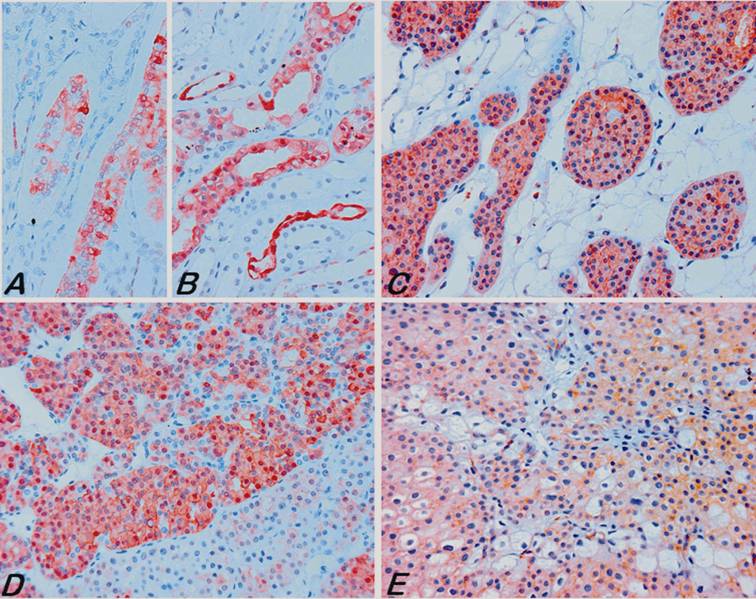
Immunohistochemical analysis of S100A1 in normal and tumour tissues. In normal fetal (A) and adult (B) kidneys the S100A1 was expressed preferentially in the collecting ducts. (C) A strong diffuse to focal membranous and also cytoplasmic staining of RO cells with the S100A1 antibody. Notice that some areas of the RO were negative with the antibody (D, below). (E) Some chromophobe RCCs revealed a cytoplasmic staining attenuated to the cell membrane. All pictures are of the same microscopic and optical magnification.
Figure 6
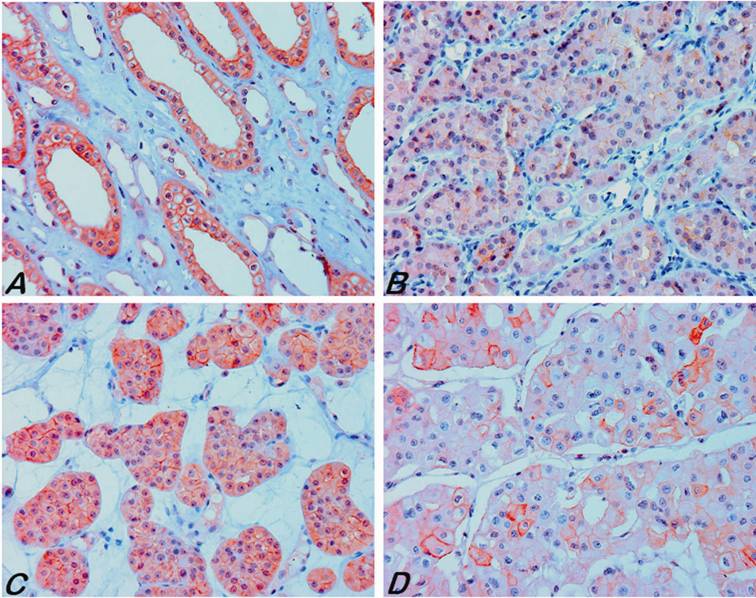
Expression of the AQP6 in normal kidneys and tumour tissues. (A) A strong positive membranous and weak cytoplasmic staining in the collecting duct of adult kidney. (B, C) Strong diffuse to focal membranous and also cytoplasmic staining of tumour cells was seen in renal oncocytoma. (D) Focal strong staining was observed only in a few chromophobe RCC.
4. Discussion
In the present study, we have applied different algorithms to evaluate the data sets obtained by hybridisation of pooled and also individual samples of RCTs onto two different Affymetrix platforms. The two analyses revealed high similarities in the gene expression profiles of chromophobe RCCs and ROs but also some differences. Generally, the majority of transcripts down-regulated in chromophobe RCCs were located predominantly on chromosomes 1, 2, 6, 10, 13, 17 and 21 which are specifically lost from the karyotype of this type of tumour (2). Our finding is in agreement with data of a previous study which identified frequent downward biases (genetic intervals that contain a disproportionate number of genes that are coordinately up- or down- regulated) for chromosomes 1, 2, 6, 10q and 17q in chRCC (5).
By applying strict selection criteria, we have identified a set of genes up- and down-regulated in chromophobe RCCs versus ROs. Because the lack of positive staining at immunhistochemical analysis due to possible technical error cannot be evaluated itself as a diagnostic marker, we have concentrated our study to genes overexpressed in one of the tumour types. The candidate genes were further selected by a real time RT-PCR, normal RT-PCR and immunohistochemistry. We have identified CD82 as a valuable marker for chromophobe RCC, the finding which was confirmed by Western blotting and immunohistochemistry earlier (10). We found a strong diffuse to focal membranous and also weak cytoplasmic staining of tumour cells in 69 (78%) of the 88 chromophobe RCCs whereas all the 90 renal oncocytomas were negative for the anti-CD82 antibody (10). Several studies suggested that CD82/KAI1 is involved in the malignant progression of several but not all types of cancer (for review see 12). However, only few studies have been carried out on tumour tissues using immunohistochemistry, and the documentation in these studies are not really convincing.
In this study we have analysed S100A1 and AQP6 in details as possible markers for ROs. However, these genes are expressed at the protein level in other types of RCTs as well albeit at a low frequency and low intensity. Moreover, in the present study the number of S100A1-positively stained chromophobe RCCs was higher compared to the literature data from the absent expression to weak positivity in chromophobe RCCs (13-15). We have previously identified a specific expression of a new splice variant of DLG2 by array analysis of pooled material, which might also be used for the differential diagnosis in cases with uncertain diagnosis (16). Recently, some selected antibodies have been used to characterize chromophobe RCCs and ROs, but with controversial results. For example, ARPP has been suggested as an excellent marker for ROs (17). Using the antibody obtained from the authors of this paper, we were not able to confirm their results (data not shown). Summing up the data from the literature and our study, with exception of CD82, no reliable marker has been identified for the differential diagnosis of chromophobe RCC versus RO.
Until now, expression profile of more than 300 RCTs including 36 chromophobe RCCs and 31 ROs have been studied by filter and microarray hybridization (3-4, 6-8, 18-21). As mRNA expression profile of chromophobeRCCs is highly similar to that of ROs, there is a poor agreement among reported studies as to which genes are differentially regulated in these two types of tumours. There is no universal algorithm for microarray data management. Even when gene expressions from the same data set are calculated with different algorithms, only a varying degree of overlap of the up- and down-regulated genes was identified. This variation was also demonstrated in our study by using different array platforms and algorithms. It is generally accepted that genome-wide gene expression profiling is a powerful technique for identifying diagnostic markers or targets for therapy. It might be true for some type of tumours but not really for renal cell neoplasms. Chromophobe RCCs and ROs are believed to develop from cells of the collecting duct system, which originate from ureteric bud. Therefore, obtaining a high degree of overlap in gene expression profile it is not surprising. After analysing of several thousand genes by gene arrays, hundreds by RT-PCR and the selected genes by immunohistochemistry, only a very few genes remained over and even these are not exclusively expressed in one type of tumour (3-4, 6-8, 18-21).
In conclusion, the number of genes selected by the global gene expression analysis and their usefulness in the diagnostic pathology is far below the expectations. As none of the selected genes marks exclusively one type of renal cell tumours, for the differential diagnosis of chromophobe RCCs and ROs, a set of markers such as CD82, S100A1 and AQP6 as well as some others would be an option in routine histological laboratories. However, based on our previous experience, we prefer to apply DNA based tools for the diagnosis of chromophobe RCCs and ROs with uncertain histology (1-2, 22-23).
Acknowledgements
This study was supported in part by the Wilhelm-Sander Stiftung. The authors thank Drs. Laszlo Farkas of University of Pecs, Hungary, and Börje Ljundberg of University of Umea, Sweden for supplying some of the chromophobe RCC and RO samples used in this study.
Conflict of interests
The authors declare that no conflict of interest exists.
References
1. Speicher MR, Schoell B, du Manoir S. et al. Specific loss of chromosomes 1, 2, 6, 10, 13, 17, and 21 in chromophobe renal cell carcinomas revealed by comparative genomic hybridization. Am J Pathol. 1994;145:356-364
2. Yusenko MV, Kuiper RP, Boethe T. et al. High-resolution DNA copy number and gene expression analyses distinguish chromophobe renal cell carcinoma and renal oncocytomas. BMC Cancer. 2009;9:152
3. Young AN, Amin MB, Moreno CS. et al. Expression profiling of renal epithelial neoplasms. Am J Pathol. 2001;158:1639-1651
4. Higgins JPT, Shinghal R, Gill H. et al. Gene expression patterns in renal cell carcinoma assessed by complementary DNA microarray. Am J Pathol. 2003;162:925-932
5. Furge KA, Lucas KA, Takahashi M. Robust clussification of renal cell carcinoma based on gene expression data and predicted cytogenetic profiles. Cancer Res. 2004;64:4117-4121
6. Schuetz AN, Yin-Goen Q, Amin MB. et al. Molecular classification of renal tumors by gene expression profiling. J Mol Diagn. 2005;7:206-218
7. Takahashi M, Yang XY, Sugimura J. et al. Molecular subclassification of kidney tumors and the discovery of new diagnostic markers. Oncogene. 2003;22:6810-6818
8. Rohan S, Tu JJ, Kao J. et al. Gene expression profiling separates chromophobe renal cell carcinoma from oncocytoma and identifies vesicular transport and cell junction proteins as differentially expressed genes. Clin Cancer Res. 2006;12:6937-6945
9. Kauffman EC, Barocas DA, Chen YT. et al. Differential expression of KAI1 metastasis suppressor protein in renal cell tumor histological subtypes. J Urol. 2009;181:2305-2311
10. Yusenko MV, Kovacs G. Identifying CD82 (KAI1) as a marker for human chromophobe renal cell carcinoma. Histopathology. in press
11. Kovacs G, Akhtar M, Beckwith BJ. et al. The Heidelberg classification of renal cell tumors. J Pathol. 1997;183:131-133
12. Malik FA, Sanders AJ, Jiang WG. KAI-1/CD82, the molecule and clinical implication in cancer and cancer metastasis. Histol Histopathol. 2009;24:519-530
13. Lin F, Yang W, Betten M. et al. Expression of S-100 protein in renal cell neoplasms. Hum Pathol. 2006;37:462-470
14. Li G, Barthelemy A, Feng G, Gentil-Perret A. et al. S100A1: a powerful marker to differentiate chromophobe renal cell carcinoma from renal oncocytoma. Histopathology. 2007;50:642-647
15. Rocca PC, Brunelli M, Gobbo S. et al. Diagnostic utility of S100A1 expression in renal cell neoplasms: an immunohistochemical and quantitative RT-PCR study. Mod Pathol. 2007;20:722-728
16. Zubakov D, Stupar Z, Kovacs G. Differential expression of a new isoforms of DLG2 in renal oncocytoma. BMC Cancer. 2006;6:106
17. Shomori K, Nagashima Y, Kuroda N. et al. ARPP protein is selectively expressed in renal oncocytoma, but rarely in renal cell carcinomas. Mod Pathol. 2007;20:199-207
18. Boer JM, Huber WK, Sültmann H. et al. Identification and classification of differentially expressed genes in renal cell carcinoma by expression profiling on a global human 31,500-element cDNA array. Genome Res. 2001;11:1861-1870
19. Gieseg MA, Cody T, Man MZ. et al. Expression profiling of human renal carcinomas with functional taxonomic analysis. BMC Bioinformatics. 2002;3:26
20. Jones J, Out H, Spentzos D. et al. Gene signatures of progression and metastasis in renal cell cancer. Clin Cancer Res. 2005;11:5730-5739
21. Yang XJ, Sugimura J, Schafernak KT. et al. Classification of renal neoplasms based on molecular signatures. J Urol. 2006;175:2302-2306
22. Wilhelm M, Veltman JA, Olshen A. et al. Array based CGH for the differential diagnosis of renal cell cancer. Cancer Res. 2002;62:957-960
23. Bugert P, Kovacs G. Molecular differential diagnosis of renal cell carcinomas by microsatellite analysis. Am J Pathol. 1996;149:2081-2088
Author contact
![]() Correspondence to: G Kovacs, Laboratory of Molecular Oncology, Medical Faculty, Ruprecht-Karls-University, Im Neuenheimer Feld 325, D-69120 Heidelberg, Germany. Phone: 49-6221-566519, Fax: 49-6221-564634, E-mail: gyula.kovacsuni-heidelberg.de
Correspondence to: G Kovacs, Laboratory of Molecular Oncology, Medical Faculty, Ruprecht-Karls-University, Im Neuenheimer Feld 325, D-69120 Heidelberg, Germany. Phone: 49-6221-566519, Fax: 49-6221-564634, E-mail: gyula.kovacsuni-heidelberg.de
Citation styles
APA
Yusenko, M.V., Zubakov, D., Kovacs, G. (2009). Gene expression profiling of chromophobe renal cell carcinomas and renal oncocytomas by Affymetrix GeneChip using pooled and individual tumours. International Journal of Biological Sciences, 5(6), 517-527. https://doi.org/10.7150/ijbs.5.517.
ACS
Yusenko, M.V.; Zubakov, D.; Kovacs, G. Gene expression profiling of chromophobe renal cell carcinomas and renal oncocytomas by Affymetrix GeneChip using pooled and individual tumours. Int. J. Biol. Sci. 2009, 5 (6), 517-527. DOI: 10.7150/ijbs.5.517.
NLM
Yusenko MV, Zubakov D, Kovacs G. Gene expression profiling of chromophobe renal cell carcinomas and renal oncocytomas by Affymetrix GeneChip using pooled and individual tumours. Int J Biol Sci 2009; 5(6):517-527. doi:10.7150/ijbs.5.517. https://www.ijbs.com/v05p0517.htm
CSE
Yusenko MV, Zubakov D, Kovacs G. 2009. Gene expression profiling of chromophobe renal cell carcinomas and renal oncocytomas by Affymetrix GeneChip using pooled and individual tumours. Int J Biol Sci. 5(6):517-527.
This is an open access article distributed under the terms of the Creative Commons Attribution (CC BY-NC) License. See http://ivyspring.com/terms for full terms and conditions.