Impact Factor ISSN: 1449-2288
- Issue 12; 2026
- Issue 11; 2026
- Issue 10; 2026
- Issue 9; 2026
- Issue 8; 2026
- Volume 22; 2026
- Past Issues
- Advance Articles
- Editorial Board
- Cover Images
- Index & Coverage
- Cover Suggestion
- Special Issues
1. Introduction
2 Materials and methods
3 Result and Discussion
Acknowledgements
Abbreviations
References

 Global reach, higher impact
Int J Biol Sci 2009; 5(7):727-735. doi:10.7150/ijbs.5.727 This issue Cite
Research Paper
Identification of Anoectochilus based on rDNA ITS sequences alignment and SELDI-TOF-MS
Chuan Gao1, 3, Fusheng Zhang1, Jun Zhang4, Shunxing Guo1 ![]() , Hongbo Shao2,5
, Hongbo Shao2,5 ![]()
1. Institute of Medicinal Plant Development, Beijing Union Medical College/Chinese Academy of Medicinal Sciences, Beijing 100193, China;
2. Institute of Soil and Water Conservation, Chinese Academy of Sciences and Ministry of Water Resources, Yangling 712100, China;
3. Institute of Beijing Pharmacochemistry, Beijing 102205, China;
4. Central Laboratory of 306 Hospital of PLA, Beijing 100083, China;
5. Yantai Institute of Costal Zone Research, Chinese Academy of Sciences (CAS), Yantai 264003, China.
Received 2009-8-28; Accepted 2009-11-26; Published 2009-12-2
Abstract
The internal transcribed spacer (ITS) sequences alignment and proteomic difference of Anoectochilus interspecies have been studied by means of ITS molecular identification and surface enhanced laser desorption ionization time of flight mass spectrography. Results showed that variety certification on Anoectochilus by ITS sequences can not determine species, and there is proteomic difference among Anoectochilus interspecies. Moreover, proteomic finger printings of five Anoectochilus species have been established for identifying species, and genetic relationships of five species within Anoectochilus have been deduced according to proteomic differences among five species.
Keywords: Anoectochilus, ITS, proteomic finger printing, SELDI
1. Introduction
Anoectochilus is one of the 27 genera of subteib. Goodyerinae of Trib. Neottieae (Orchidaceae). There are about 40 species of this genus in tropical zone areas of Asia and Australia. 20 species among them and two varieties have been found from southwest to south of China [1]. Major medicinal plants named "King of medicine" or "Golden grass" of this genus are A. formosanus, A. koshunensis and A. roxburghii, which are generally used in treatment of hypertension, diabetes, heart disease, pneumonia, acute and chronic hepatitis, nephritis and other diseases [1, 2].
According to the identification standards [1], we collected wild species of Anoectochilus plants in southwest areas of China and cultured axillary bud in sterile condition. For a long time, the morphological characteristics have been the main standards of phylogenetic studies. However, due to the narrow of the distribution of wild Anoectochilus and the scarce of natural reserves and the missing of flower period, traditional identification methods were usually invalid.
With the development of plant molecular systematics, a growing number of nucleic acid analysis techniques are widely used in plant phylogenetic studies [3], such as DNA hybridization, DNA restriction enzyme spectrum analysis, DNA fingerprinting techniques, RFLP, RAPD, AFLP and DNA sequence analysis. At present, ITS sequence of ribosomal DNA (rDNA) has become an important molecular markers in phylogenetic development of angiosperms, and been widely used in the intragenera, intergenera and even interspecies phylogenetic studies [4-5]. A series of progress has been achieved [6-7].
Meanwhile, proteomics researches based on two-dimensional gel electrophoresis are also applied in the genetic evolution and classification of species. For instance, to identify the origin of cultivated species through the analysis of protein differences of cultivated and wild wheat [8], and to study the genetic diversity by protein differences of wheat varieties [9] or wheat groups planted in different areas [10]. In addition to wheat, other species used 2-D separated characteristic proteins to identify species (or subspecies) , such as rice [11-12], sugarcane [13] and chilli [14], have been reported.
As a new way on proteome research, SELDI-TOF-MS (Surface Enhanced Laser Desorption Ionization-Time of Flight-Mass Spectrography) technology shows a lot of advantages such as simple, fast, acute and high-flux. It can detect trace protein as fmol(10-15mol) [15-16] and is regarded as supplement of two-dimensional electrophoresis. Today, SELDI has been mostly used in clinical diagnosis through identifying several special proteins peaks of special disease [17] and also was used in the studies on plant proteome recently [18-20].
In this experiment, based on the NCBI Blast comparison of ITS sequences, several named (TW, FJ) and unnamed (WS, YN1, YN2, XZ) orchid plants were only classified to genera. So the protein difference of these plants using the SELDI-TOF-MS was investigated to identify species at the first time, and the proteome fingerprint of these plants were established respectively, and the genetic relationship of five species within Anoectochilus was preliminarily explored.
2 Materials and methods
2.1 Materials
Experimental material: six tissue culture seedlings comprised TW (Taiwan province), FJ (Fujian province), WS (Yunnan province), YN1(Yunnan province), YN2 (Yunnan province) and XZ (Tibet province).
The main reagents: polyvinylpyrrolidone (PVP), trichloroacetic acid (TCA), dithiothreitol (DTT), urea, 3-[(3-cholamidopropyl)dimethylamonio]-1-propane sulfonate (CHAPS) reagents for Gibco products; 2-D Quant Kit protein quantitative kit products for the Amersham; Plant Genomic DNA Kit, TIANGEN company's products.
The main instruments: Master Cycleer gradient AG 22331 PCR Instrument, Eppendorf companies; protein flight mass spectrometer (PBS IIc), that is, surface-enhanced laser desorption ionization time-of-flight mass spectrometry (SELDI-TOF), chemically modified weak-cation CM10 chip, Ciphergen U.S. companies; Centrifuge 5810r desktop high-speed refrigerated centrifuge, Eppendorf company; Milli-Q ultrapure water instrument, Millipore products.
2.2 Methods
2.2.1 Plant DNA extraction and amplification of ITS sequences
Plant Genomic DNA Kit prospectus was a reference to extract plant DNA.
The primers of PCR amplification of ITS sequences [21, 22]: P1: CGT AAC AAG GTT TCC GTA GGT GAAC; P2: TTA TTG ATA TGC TTA AAC TCA GCG GG, conventional PCR amplification conditions.
2.2.2 Alignment of ITS sequences by Blast
Blast engine is in NCBI web site http://blast.ncbi.nlm.nih.gov/Blast.cgi.
2.2.3 Sample preparation for proteomics
When the sterile cultured plant seedlings grow to 8-10cm high, they are collected from the tender shoots of plants and sample preparation is based on the procedure described by Damerval [23], and modified as follow: samples approximately 500 mg and 50 mg polyvinylpyrrolidone(PVP) are ground in liquid nitrogen. The powder is suspended in 8-10 folds sample volume (weight/vol) of acetone (-20 ºC) + 10% vol/vol trichloroacetic acid (TCA) + 5% vol/vol dithiothreitol (DTT) and incubated overnight at -20ºC. After centrifugation, (14, 000 × g, 4 ºC, 60 min), the supernatant is removed, 5 mL of ice-cold acetone +1% vol/vol DTT+1 mM phenylmethyl sulfonylfluoride (PMSF) is added, and the samples are stored for 1 h at -20 ºC. Then centrifuge at 4 ºC, 14, 000×g for 30 min, repeat this step one time. Volatilize remains acetone of precipitation at -20 ºC. 20 mg protein powder is dissolved in 500 mL protein lysate (9.5 mol/L urea, 2% 3-[(3-cholamidopropyl) dimethylammonio] -1-propanesulfonate (CHAPS), 1% DTT), insoluble particles are removed by centrifugation (14, 000 ×g, 4 ºC, 30 min) and protein level is determined using 2-D Quant Kit(Amersham) with accurate concentration using bovine serum albumin (BSA) as standard.
2.2.4 SELDI-MS-TOF detection
Put the protein chip (Chemical modify chip CM10, Ciphergen company of USA) in processor. Add 200 µL binding buffer (50 mmol/L NaAc, pH 4.0) in each pore. Vibrate 2 times to wash the processor at room temperature; 5 min every time, then shake away the buffer. Add 100 µL sample mixed liquor in each pore (about 5μg protein per pore). After Vibrating 1 h, shake away sample. Vibrate 2 times to wash processor with 200 μL elution buffer (50 mmol/L NaAc, pH 4.0) at room temperature, 5 min every time, then shake away the buffer. Wash again with deionized water, shake away immediately. Unpack processor and take out chip, dry it in air, then put 0.5 μL SPA [Sinapinic acid, 5 mg SPA in 80 μL TFA and CAN solution (trifluoroacetic acid : acetonitrile=1:1) ] in each pore, after dry, repeat this step again then put chip in SELDI-TOF-MS instrument and detect (PBS IIc, Ciphergen company of USA).
2.2.5 Data processing and Proteins identification
Parameter set as: the detected highest molecular weight is 50 kD, the optimizing range are 2-20 kilo daltons (KD), the intensity of laser is 205, the detection sensitivity is 8. The peaks under 2 kD are deleted to remove interference of base peak.
Data are gathered automatically by the analysis software Ciphergen Proteinchip 3.1 and proteins difference is analyzed by Biomarker Wizard software. Standardized graph parameter set as: intensity extent is 5-75, mass charge ratio (e/m) extent is 2000-50000, and calibrate is 6825 Da protein peak. The SPSS 11.5 software is used to analyze the data on statistics.
3 Result and Discussion
3.1 Results of alignment of ITS sequence by Blast
The ITS sequences of samples were aligned by Blast. The four highest score DNA accession number and their coverage and identity were listed in table 1. TW, FJ, YN1, YN2, WS are classified in Anoectochilus, TW could be judged as A. formosanus. Referring to its flower character, FJ can be identified as A. roxburghii. Although owning the same ITS sequences, YN1 and YN2 may be two variants or subspecies because of its differences in appearance. XZ belongs to Goodyera rather than Anoectochilus, can be identified as G. macrantha.
Results of alignment of ITS sequence by Blast
| Name (NCBI accession no.) | Accession | Description | Score | Coverage | Ident |
|---|---|---|---|---|---|
| TW GQ328777 | AY052780.1 | Anoectochilus formosanus | 1404 | 100% | 100% |
| EU700340.1 | Anoectochilus koshunensis | 1399 | 100% | 99% | |
| EU817408.1 | Anoectochilus roxburghii | 1393 | 100% | 99% | |
| AJ539483.1 | Ludisia discolor | 948 | 89% | 92% | |
| FJ GQ328774 | AY052780.1 | Anoectochilus formosanus | 1387 | 100% | 99% |
| EU700340.1 | Anoectochilus koshunensis | 1382 | 100% | 99% | |
| EU817408.1 | Anoectochilus roxburghii | 1376 | 100% | 99% | |
| AJ539483.1 | Ludisia discolor | 942 | 89% | 91% | |
| YN1 GQ328780 /YN2 GQ328781 | EU817408.1 | Anoectochilus roxburghii | 1387 | 100% | 99% |
| AY052780.1 | Anoectochilus formosanus | 1387 | 100% | 99% | |
| EU700340.1 | Anoectochilus koshunensis | 1382 | 100% | 99% | |
| AJ539483.1 | Ludisia discolor | 953 | 89% | 92% | |
| AJ539521.1 | Dossinia marmorata | 935 | 82% | 93% | |
| WS GQ328778 | AY052780.1 | Anoectochilus formosanus | 1399 | 100% | 99% |
| EU700340.1 | Anoectochilus koshunensis | 1393 | 100% | 99% | |
| EU817408.1 | Anoectochilus roxburghii | 1387 | 100% | 99% | |
| AJ539483.1 | Ludisia discolor | 942 | 89% | 91% | |
| XZ GQ328779 | AF366894.1 | Goodyera macrantha | 1293 | 100% | 100% |
| AF366895.1 | Goodyera maximowicziana | 1155 | 100% | 96% | |
| AF366898.1 | Goodyera velutina | 1151 | 100% | 96% | |
| AF366897.1 | Goodyera schlechtendaliana | 1083 | 100% | 94% |
In table 1, Taxonomic status of the various genera and species are Eukaryota, Viridiplantae, Streptophyta, Embryophyta, Tracheophyta, Spermatophyta, Magnoliophyta, Liliopsida, Asparagales, Orchidaceae, Orchidoideae, Cranichideae, Goodyerinae, under Goodyerinae are Anoectochilus, Ludisia, Dossinia, and Goodyera respectively.
The results also reveal that the classification relationships of Goodyerinae are very close. The conservative ratio of ITS sequences is above 91%. The conservative ratio of ITS sequences within Anoectochilus is even above 99% and 95% within Goodyera. Ludisia and Dossinia could not be compared as one species alone in database respectively, there is 93% conservative ratio between them. 92% conservative ratio between them and Anoectochilus are observed in the table.
The conservative ratio of ITS sequences within Anoectochilus is above 99%, while dropped conservative ratio 91-92% are observed between Anoectochilus and other genera. Therefore, because of the high conservation of ITS sequences within Anoectochilus plants, they couldn't be identified under this genus through the ITS sequence alignment in most cases.
Accordingly, XZ which was originally considered as Anoectochilus has been identified as G. macrantha of Goodyera by ITS alignment. So it was not brought into the next proteomics research.
3.2 Differential proteome
The former reports showed there were some differences in proteins in total proteome between similar species, which embodied the genetic variability of species.
Bahrman N, etc calculated the similarity index between each pair of genotypes, and found that wild wheat T. speltoides is most similar to cultivated B genome by analyzing the total number of proteins of several wild and cultivated wheat species [8].
Analysis on total proteins of the relative species, Quercus petraea and Quercus robur confirmed that there was low genetic diversity between them [24].
With 2-D analysis on protein expression profiles of 18 strains of wheat allopolyploid, Zivy M, etc found 14 wheat proteins can reflect the nuclear genetic variation of wheat varieties [9].
With continuous improvement of the protein extraction method, as well as the 2-D technology especially the use of big strip and IPGs of appropriate pH value, the efficiency of plant species identification and detection of genetic variation have been greatly improved. Görg A, etc analyzed gliadin maps of 14 barley varieties with different malts using the first-dimensional isoelectric focusing IPG-DALT gel, and found that 10 species showed unique gliadin spectrum, while the remaining species were divided into two groups and each group consisted of two varieties [25].
Skylas DJ, etc found that it can be distinguished that four different varieties of wheat through three special areas (two Glutenin zones and a non-Glutenin area (small Heat Shock Proteins)) of total endosperm proteome by 2-D electrophoresis with acidic (pH 4-7) and alkaline (pH 6-11) strips [26]. Their study also found that the difference of wheat heat shock proteins is an interesting possible target protein area in species identification。
The researches above indicate that the protein differences between species can be used for the identification of plant species.
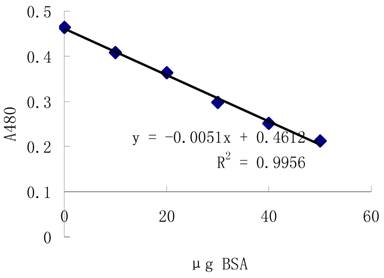
3.2.1 Standard curve
Protein level is determined using 2-D Quant Kit(Amersham) with accurate concentration using bovine serum albumin (BSA) as standard. The standard curve is showed as figure 1.
Standard curve
3.2.2 Comparison of protein differential peak
Proteins peak form map (Fig.2) given by SELDI shows that there are many common protein peaks in each groups. The corresponding proteins should be the common expressive proteins in Anoectochilus and they are necessary for plant growth. But the strength disparity of some peaks indicates that the amounts of these proteins appear different, and some peaks exist in one species alone. All of the protein differences may cause the interspecies difference in Anoectochilus.
Protein peak shape (a and b).
Statistics analysis shows that when compared with the FJ control group, 102 different proteins/peptides are found among five groups with p<0.05(n=3). Molecular weights and corresponding peak areas of part proteins are list in table 2.
Molecular weight and peak area of part interspecific differential proteins of Anoectochilus
| M/Z | p | Mean-FJ | Mean-TW | Mean-WS | Mean-YN1 | Mean-YN2 |
|---|---|---|---|---|---|---|
| 5849.01 | 0.013 | 2.1460 | 1.2155 | 15.2133 | 3.9167 | 4.5491 |
| 6130.28 | 0.015 | 64.857 | 74.436 | 34.792 | 31.635 | 15.385 |
| 5133.94 | 0.016 | 24.066 | 43.930 | 15.277 | 41.236 | 23.116 |
| 10451.80 | 0.019 | 23.658 | 38.096 | 18.277 | 30.934 | 19.361 |
| 12081.32 | 0.019 | 18.151 | 64.982 | 50.045 | 16.689 | 11.188 |
| 6053.50 | 0.022 | 5.974 | 39.398 | 10.990 | 5.693 | 4.963 |
| 10283.81 | 0.022 | 26.680 | 37.526 | 16.598 | 68.426 | 30.815 |
| 6115.95 | 0.025 | 19.771 | 16.577 | 62.452 | 49.859 | 8.709 |
| 7278.39 | 0.026 | 38.853 | 8.848 | 3.429 | 5.271 | 9.062 |
| 7566.28 | 0.031 | 2.921 | 2.539 | 2.882 | 10.552 | 30.942 |
| 6077.38 | 0.040 | 6.503 | 8.727 | 58.035 | 18.199 | 4.946 |
| 12177.27 | 0.043 | 49.342 | 49.205 | 80.972 | 75.462 | 24.793 |
| 6089.22 | 0.045 | 7.822 | 7.536 | 68.321 | 17.332 | 4.940 |
| 12133.44 | 0.046 | 26.632 | 28.940 | 80.765 | 49.282 | 19.069 |
| 10525.79 | 0.047 | 39.891 | 40.011 | 10.458 | 32.264 | 23.021 |
Combined with graphs and charts, the largest peaks can be chosen as characteristic peaks of identification of the Anoectochilus, such as M/Z peaks of 5133, 6130, 10451, 10283, 10526, 12133 and 12177 Daltons (Da).
3.2.3 Establishment of proteomic fingerprint
According to the interspecies differential proteins and peaks, obvious differential peaks between species were treated as target protein peaks to identify these species, with FJ (A. roxburghii) and TW (A. formosanus) as standards.
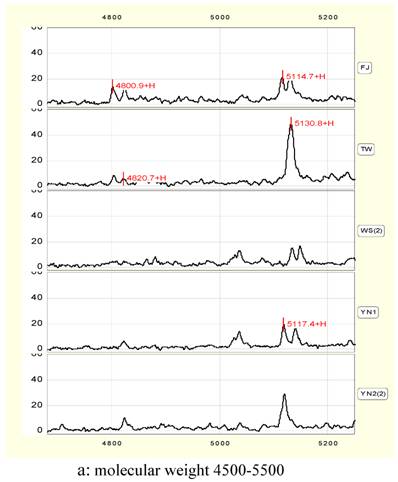
In a narrow range between 4800 and 4820 Da, there are double protein peaks in FJ and TW. YN1 and YN2 exists single-peak in the 4820 Da respectively, and there was no significant difference in peak height and peak area between YN1 and YN2. No peak exists in this range in WS.
In 5115 to 5130 Da, there are double-peaks in protein peak chart of FJ, WS and YN1 respectively. Almost equal height and area of the double-peaks are observed in FJ and WS, while those in YN1 add one time. TW and YN2 has a single peak alone in 5130 Da, and the peak height and peak area of TW are significantly higher than those of YN2 (Figure 2, a), the values are 48.6, 1051.5 and 29.2, 571.6 respectively.
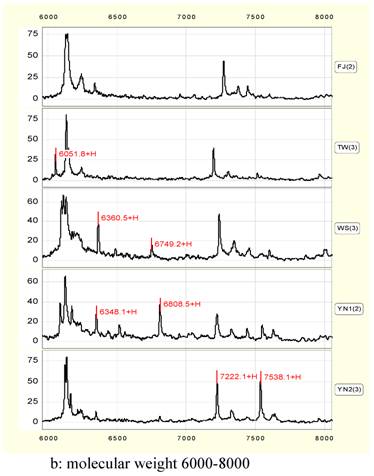
In 6000 to 8000 Da, four peaks of 6052, 6350, 6750 and 7538 Da can be considered to be characteristic peaks to distinguish Anoectochilus species. 6052 exists only in TW or YN1. 6350 peak is higher in WS or YN1, while 6750 peak exist in WS and YN1 alone. 7538 peak is much higher in YN2 than that in other samples (Figure 2, b).
Within range between 8000 to 11, 000 Da, five peaks can be regarded as the characteristic peaks (8131, 9032, 9058, 10, 430 and 10, 512). The 8131 peak is higher in YN1 and WS. The double-peaks of 9032 and 9058 exist in FJ and WS, but in TW, YN1 and YN2, only one of them exists. Peak of 10, 430 does not exist, while 10512 peak is higher in WS (table 3).
Protein fingerprint spectra of the five species within Anoectochilus
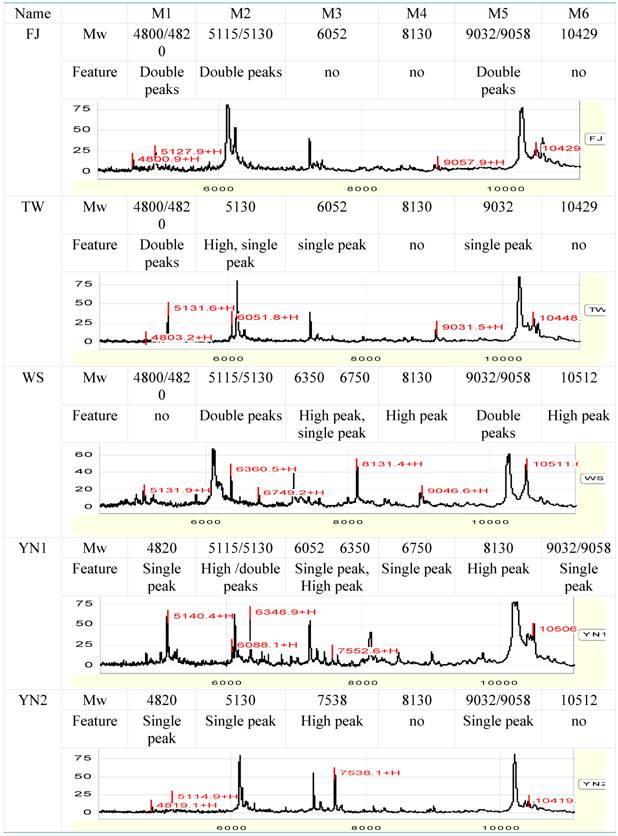
Some peaks are not considered as characteristic peaks because of the bad peak shape and lower isolating rate, although they have higher peak height and higher differences.
Based on the above analysis, the molecular weight and character of the target proteins of the five species of Anoectochilus are listed in Table 3.
3.2.4 The relationships of the five species within Anoectochilus
Neither the number nor the multiples of differential proteins among the proteomes of five species of Anoectochilus is equal (Table 4).
Interspecific differences in protein of Anoectochilus
| Compared group | Total number of differential proteins | >20 folds | 5-20 folds | The highest multiple |
|---|---|---|---|---|
| FJ/TW | 110 | 2 | 5 | 48 |
| FJ/WS | 138 | / | 8 | 18 |
| FJ/YN1 | 55 | / | 10 | 14 |
| FJ/YN2 | 138 | 2 | 15 | 29 |
| TW/WS | 170 | 3 | 15 | 38 |
| TW/YN1 | 80 | 2 | 9 | 69 |
| TW/YN2 | 130 | / | 12 | 12 |
| WS/YN1 | 98 | 1 | 13 | 34 |
| WS/YN2 | 183 | 6 | 27 | 86 |
| YN1/YN2 | 100 | 1 | 10 | 55 |
| Total proteins number that can be identified of each species is 307 | ||||
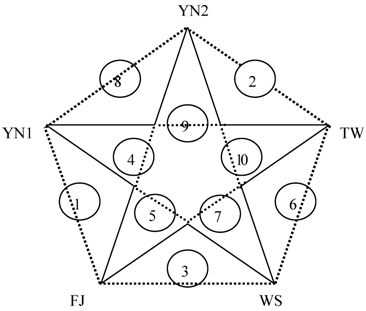
Table 4 shows that FJ might be the nearest relationship to YN1 since there are a few differential proteins and lower differential multiples between them. It can be concluded that YN1 closes to WS, followed by TW and YN2, as well as FJ and WS. And comparing with the others, the genetic relationship of WS and YN2 could be considered the remote, because of not only the maximum differential proteins but the biggest differential multiple. The affinity diagram of five species can be drawn from the above data (Figure 3).
Affiliation of five plants in Anoectochilus. The number 1-10 in circles shows the relationship of interspecies from near to far.
In the former study on genetic variability within species, the relationship of seven natural geographical groups of the coastal pine was investigated by using 2-D, and genetic variation of different geographical sites was compared. The research showed that these trees can be divided into three major groups, which were the Atlantic Ocean group, the Mediterranean group and North African group [27].
The genetic diversity of group evolution of 11 wheat groups which planted in isolated areas was studied by David JL etc. [10]. It was found that 15 proteins showed significant differences among 48 protein spots that related to genetic differences. And the similar genetic differences were shown in one isolated group even with different cultivation.
The above results indicate that the natural selection of groups played a major role in evolution, and the selection effects was mainly decided by environmental conditions. In this experiment, these five plants distribute in the southwest of China, the far relationships of YN1 and YN2, as well as YN2 and TW may due to the differences of plateau climate and marine climate. But the difference between YN1 and YN2 can not be explained by climate reason, and may be caused by some kind of natural selection.
Therefore, it is believed that the elevation and climate may lead to the species differentiation. However, besides these key factors, there are many other factors causing the differentiation and variation of species.
3.2.5 Concluding remark
We can determine the genus of plants through the ITS sequences blast, and the conservative ratio is more than 95% within the genus. And the conservative ratio is up to 99% within Anoectochilus, and that between the genera is 91%. Therefore, it can not be identified to the species based on the ITS sequence alignment in most cases.
Up to now, it was the first time to use the SELDI-TOF-MS technology for the species identification of the orchid plants. According to the differential proteome data and peak shape diagram given by SELDI-TOF-MS, peaks with molecular weight 4800/4820, 5115/5130, 6052, 6350, 6750, 8130, 9032/9058 and 10, 512 were chosen as characteristic peaks, and protein fingerprints of five plants within Anoectochilus were established respectively.
Meanwhile, the genetic variability of the five species was analyzed. It was found that a certain effect to species variation will be caused by geographical and climatic variation, but the final differentiation and variation of one species is caused by multiple factors.
Acknowledgements
This work was supported by National Natural Science Foundation of China (No. 30830117, No. 30770068), Scientific Research Foundation of China post-Doctor 2007(16), One Hundred-Talent Plan of Chinese Academy of Sciences (CAS), CAS-local Government Cooperative Project, the CAS/SAFEA International Partnership Program for Creative Research Teams, and the Important Direction Project of CAS(KZCX2-YW-JC203).
Abbreviations
AFLP: amplified fragment length polymorphism; CHAPS: 3-[(3-cholamidopropyl)dimethylamonio]-1-propane sulfonate; Da : dalton; DTT: dithiothreitol; ITS: internal transcribed spacer; KD : kilodalton; PCR: polymerase chain reaction; PVP: polyvinylpyrrolidone; RAPD: random amplified polymorphic DNA; rDNA: ribosomal DNA; RFLP: restriction fragment length polymorphism; SELDI-TOF-MS: surface enhanced laser desorption ionization-time of fight-mass spectrography; TCA: trichloroacetic acid.
Conflict of Interest
The authors have declared that no conflict of interest exists.
References
1. Editorial Committee of Flora of China, Chinese Academy of Sciences. Flora Reipublicae Popularis Sinicae. Beijing: Science Press. 2000:204
2. Institute of Research on Traditional Chinese Medicine. Record of Fujian Materia Medica. Fuzhou, Fujian: Fujian Science and Technology Press. 1982:215
3. Zou YP, Ge S. et al. Molecular markers of systematic and evolutionary botan. Beijing: Science Press. 2001
4. Campbell CS, Baldwin BG, Donoghue MJ. et al. Phylogeny of the genera of Maloidae (Rosaceae): evidence from sequences of the internal transcribed spacers of nuclear ribosomal DNA sequences and congruence with morphology. American Journal of Botany. 1995;82:903-918
5. Kollipara KP, Singh RJ. et al. Phylogenetic and genomic relationships in the genus Glycine Willd.Based on sequences from the ITS region of nuclear rDNA. Genome. 1997;40(1):57-68
6. Shi SH, Chang HT, Chen YQ. et al. Phylogeny of the Hamamelidaceae based on the ITS sequences of nuclear ribosomal DNA. Biochem. Syst Ecol. 1998;26:55-69
7. Shi SH, Zhong Y, Huang YL. et al. Phylogenetic relationships of the Rhizophoraceae in China based on sequences of the chloroplast gene matK and ITS regions of nuclear ribosomal DNA and combined data set. Biochem. Syst Ecol. 2002;30:309-319
8. Bahrman N, Zivy M. et al. Genetic relationships in the sitopsis section of Triticum and the origin of the B genome of the polyploidy wheats. Heredity. 1988;61(6):473-480
9. Zivy M, Thiellement H, de Vienne D. et al. Study on nuclear and cytoplasmic genome expression in wheat by two-dimensional gel electrophoresis. I. First results on 18 alloplasmic lines. Theor Appl Genet. 1983;66(1):1-7
10. David JL, Zivy M, Cardin ML. et al. Protein evolution in dynamically managed populations of wheat: adaptative responses to macro-environmental conditions. Theorl Appl Genet. 1997;95(5-6):932-941
11. Abe T, Gusti RS, Ono M. et al. Variation in glutelin and high molecular weight endosperm protein among subspecies of rice (Oryza sativa L.) detected by two-dimensional gel electrophoresis. Genes Genet Syst. 1996;71(1):63-68
12. Saruyama H, Shinbashi N. et al. Identification of specific proteins from seed embryos by two-dimensional gel electrophoresis for the discrimination between indica and japonica rice. Theor Appl Genet. 1992;84:947-951
13. Ramagopal S. Protein polymorphism in sugarcane revealed by two-dimensional gel electrophoresis. Theor Appl Genet. 1990;79(3):297-304
14. Posch A, van den Berg BM, Durantonl C. et al. Polymorphism of pepper (Capsicum annuum L.) seed proteins studied by 2-D electrophoresis with immobilized pH gradients: methodical and genetic aspects. Electrophoresis. 1994;15(1):297-304
15. Yu U, Lee SH, Kim YJ. et al. Bioinformatics in the Post-genome Era. J Bioch Mol Biol. 2004;37(1):75-82
16. von Eggeling F, Junker K, Fiedle W. et al. Mass spectrometry meets chip technology: A new proteomic tool in cancer research. Electrophoresis. 2001;22:2898-2902
17. Vlahou A, Schellhammer PF, Mendrinos S. et al. Development of a novel proteomic approach for the detection of transition cell carcinoma of the bladder in urine. Am J Patho. 2001;158:1491-1501
18. Badri AM, Coenen K, Vaillancourt LP. et al. On-chip detection of low-molecular-weight recombinant proteins in plant crude extracts by SELDI-TOF MS. Methods Mol Biol. 2009;483:313-324
19. Badri MA, Rivard D, Coenen K. et al. A SELDI-TOF MS procedure for the detection, quantitation, and preliminary characterization of low-molecular-weight recombinant proteins expressed in transgenic plants. Proteomics. 2009;9(2):233-241
20. Ebert B, Melle C, Lieckfeldt E. et al. Protein profiling of single epidermal cell types from Arabidopsis thaliana using surface-enhanced laser desorption and ionization technology. J Plant Physiol. 2008;165(12):1227-1237
21. Emmanuel JPD, Alec MP, Paul K. et al. Molecular Phylogenetics of Diseae (Orchidaceae): A Contribution from Nuclear Ribosomal ITS Sequence. American Journal of Botany. 1999;86(6):887-899
22. Ding XY, Wang ZT, Xu LS. et al. Study on Sequence Difference and SNP Phenomenon of rDNA ITS Region in F Type and H Type Population of Dendrobium officinale. China Journal of Chinese Materia Medica. 2002;27:85-88
23. Damerval C, de Vienne D, Zivy M. et al. Technical improvements in two-dimensional electrophoresis increase the level of genetic variation detected in wheat-seedling proteins. Electrophoresis. 1986;7(1):52-54
24. Barreneche T, Bahrman N. et al. Two-dimensional gel electrophoresis confirms the loe level of genetic differentiation between Quercus robur L and Quercus petraea (Matt) Liebl. Forest Genet. 1996;3(1):89-92
25. Görg A, Postel W, Baumer M. et al. Two-dimensional polyacrylamide gel electrophoresis, with immobilized pH gradients in the first dimension, of barley seed proteins: Discrimination of cultivars with different malting grades. Electrophoresis. 1992;13(1):192-203
26. Skylas DJ, Copeland L, Rathmell WG. et al. The wheat grain proteome as a basis for more efficient cultivar identification. Proteomic. 2001;1(12):1542-1546
27. Bahrman N, Zivy M, Damerval C. et al. Organisation of the variability of abundant proteins in seven geographical origins of maritime pine (Pinus pinaster Ait). Theor Appl Genet. 1994;88(3-4):407-411
Author contact
![]() Corresponding authors: sxguo2006com.cn (Guo SX); shaohongbochucom (Shao HB). Posting address: Dr. Professor Shao Hongbo, Yantai Institute of Costal Zone Research, Chinese Academy of Sciences (CAS), Yantai 264003, China.
Corresponding authors: sxguo2006com.cn (Guo SX); shaohongbochucom (Shao HB). Posting address: Dr. Professor Shao Hongbo, Yantai Institute of Costal Zone Research, Chinese Academy of Sciences (CAS), Yantai 264003, China.