Impact Factor ISSN: 1449-2288

 Global reach, higher impact
Int J Biol Sci 2011; 7(1):1-8. doi:10.7150/ijbs.7.1 This issue Cite
Short Research Communication
The Application of MRI for Depiction of Subtle Blood Brain Barrier Disruption in Stroke
David Israeli1,*, David Tanne2,6,*, Dianne Daniels3, David Last3, Ran Shneor3, David Guez3, Efrat Landau4, Yiftach Roth3, Aharon Ocherashvilli3, Mati Bakon5, Chen Hoffman5,6, Amit Weinberg3, Talila Volk1, Yael Mardor3,6 ![]()
1. Molecular Genetics Dept, Weizmann Inst, Israel;
2. Stroke Unit, Neurology Dept, Sheba Medical Center, Israel;
3. Advanced Technology Center, Sheba Medical Center, Israel;
4. Oncology Institute, Sheba Medical Center, Israel;
5. Radiology Institute, Sheba Medical Center, Israel;
6. Sackler Faculty of Medicine, Tel-Aviv University, Israel.
*These authors contributed equally to the manuscript.
Received 2010-10-20; Accepted 2010-12-13; Published 2010-12-26
Abstract
The development of imaging methodologies for detecting blood-brain-barrier (BBB) disruption may help predict stroke patient's propensity to develop hemorrhagic complications following reperfusion. We have developed a delayed contrast extravasation MRI-based methodology enabling real-time depiction of subtle BBB abnormalities in humans with high sensitivity to BBB disruption and high spatial resolution. The increased sensitivity to subtle BBB disruption is obtained by acquiring T1-weighted MRI at relatively long delays (~15 minutes) after contrast injection and subtracting from them images acquired immediately after contrast administration. In addition, the relatively long delays allow for acquisition of high resolution images resulting in high resolution BBB disruption maps. The sensitivity is further increased by image preprocessing with corrections for intensity variations and with whole body (rigid+elastic) registration. Since only two separate time points are required, the time between the two acquisitions can be used for acquiring routine clinical data, keeping the total imaging time to a minimum.
A proof of concept study was performed in 34 patients with ischemic stroke and 2 patients with brain metastases undergoing high resolution T1-weighted MRI acquired at 3 time points after contrast injection. The MR images were pre-processed and subtracted to produce BBB disruption maps. BBB maps of patients with brain metastases and ischemic stroke presented different patterns of BBB opening. The significant advantage of the long extravasation time was demonstrated by a dynamic-contrast-enhancement study performed continuously for 18 min. The high sensitivity of our methodology enabled depiction of clear BBB disruption in 27% of the stroke patients who did not have abnormalities on conventional contrast-enhanced MRI. In 36% of the patients, who had abnormalities detectable by conventional MRI, the BBB disruption volumes were significantly larger in the maps than in conventional MRI.
These results demonstrate the advantages of delayed contrast extravasation in increasing the sensitivity to subtle BBB disruption in ischemic stroke patients. The calculated disruption maps provide clear depiction of significant volumes of BBB disruption unattainable by conventional contrast-enhanced MRI.
Keywords: Subtle BBB disruption, MRI, stroke, brain, delayed enhancement
Introduction
Imaging of BBB opening has been widely applied to pathologies such as brain tumors and metastases, inflammation and head trauma. Quantitative measures for permeability have been developed to provide additional information for diagnosis, prognosis, monitoring treatments and prediction of outcome (1-8). In other pathologies such as ischemic stroke in which conventional methodologies may not be sensitive enough, the depiction of subtle BBB abnormalities remains challenging.
The MRI depiction of BBB disruption in stroke has been demonstrated in vivo using various quantification methodologies, though the clinical application is not straight forward. The ability to apply dynamic contrast-enhanced (DCE) MRI for depiction of BBB disruption in stroke has been demonstrated in vivo using various quantification methodologies (9-17) while clinical depiction of subtle BBB disruption remains challenging. Latour and Warach (18-20) studied delayed contrast leakage into the CSF and showed correlation with higher risk for hemorrhagic transformation (HT). Kassner et al (21) found high permeability in patients who later developed HT. Bang et al (22-23) showed correlation between pre-recanalization treatment permeability and later HT. Rosenberg (24) applied Patlak plots to depict BBB disruption in patients with vascular cognitive impairment.
Lüdemann et al (25) showed in patients with brain tumors, that delayed data acquisition revealed a second, slowly enhancing BBB compartment. The sensitivity to this slow compartment yielded information enabling differentiation between tumor types/grades.
Here, we present a methodology for depicting subtle BBB disruption based on delayed contrast extravasation, enabling real-time depiction of local BBB abnormalities with high spatial resolution and high sensitivity to BBB leakiness in humans.
Materials and Methods
Patients: Thirty six patients were recruited. Thirty four patients had an ischemic stroke: mean age 66.1±2.2, range 55-88, 79% men. Inclusion criteria included acute cerebral infarction or transient ischemic attack. Exclusion criteria included stroke or myocardial infarction or major surgery or trauma in last 6 weeks, cancer, known thrombophylia or bleeding disorder, severe renal or liver disease, patient arriving from nursing home or history of dementia, sever orthopedic or rheumatologic disease limiting assessment, severe psychiatric disease, other neurologic disease or other condition limiting assessment, inflammatory or infectious disease or febrile disease at baseline, contraindications to MRI and stable condition to undergo an MRI exam. The patients were scanned 2-8 days after stroke onset. Two patients had brain metastases: A 56 years old woman with breast cancer and a 70 years old man with malignant melanoma. Both patients were scanned prior to treatment.
Standard protocol approvals, registrations, and patient consents. The present study was conducted after approval of the local ethics committee at Sheba Medical Center. Written informed consent was obtained from all patients.
MRI acquisition and Image analysis: MRI was performed using a 3.0T GE system and included T2-weighted, T2 FLAIR and diffusion-weighted MRI (DWMRI) as well as high resolution spin echo T1-weighted MRI (T1-MRI) acquired before and at 3 time points after contrast injection (immediately post contrast, 7.0±1.7 min on average and 14.4±0.3 min on average). In one patient DCE MRI was acquired continuously for 18 minutes.
T1-MRI was acquired with TE/TR = 22/240 ms, field of view 26x19.5 cm, 5/0.5 mm slice thickness and 512x512 pixels.
All image analysis was performed using MatLab (version R2006b, The MathWorks, Inc. Natick, MA, US). The overall goal was to obtain subtraction maps, where the T1-MRIs of the 1st series post contrast were subtracted from the T1-MRIs of later series. The subtraction maps depict spatial distribution of contrast accumulation/clearance in the tissue, blood vessels and CSF. In case of intact BBB, due to clearance of contrast agent from the blood system, there is no increase in contrast accumulation after the first series, therefore the subtraction maps have values ≤0. The signal decay of the blood vessels is faster than that of the tissue (the signal is averaged over the tissue and microvasculature), therefore blood vessels have lower values than tissue. In case of BBB leakiness, there is movement of contrast from the vasculature into the tissue, causing a shift in T1 and a signal increase on T1-MRI, thus the values in these regions are higher than in normal tissue.
In order to increase the sensitivity to small changes it was essential to perform image pre-processing consisting of correction for intensity variations and whole body registration.
Correcting for intensity variations: The signal intensity homogeneity throughout the image and between slices depends on various parameters such as the strength/homogeneity of the static magnetic field, the oscillating excitation field, the gradients, the sensitivity of the receiving coil and various parameters of the sampled tissue. The intensity correction was performed on each image separately. An intensity variation map consisting of the large scale intensity variations was obtained by applying circular smearing to the original image and then subtracted from the original image.
Rigid body and elastic/local registration: Rigid body registration was performed using least squares approach and 6 parameter (rigid body) spatial transformation with the SPM5 (Statistical parametric mapping) MatLab routine (an academic software kit by “Wellcome Trust Centre for Neuroimaging”). Since head movements caused changes in the magnetic field inducing distortions in the MRIs, it was necessary to add local/elastic registration performed by dividing each slice to a grid of 20x20 mm volumes. Each square volume was allowed to move freely in x-y-z till the sum of the absolute values of the intensity difference between the two time points reached a minimum. The resulting three 3D translation matrices were smoothed using circular smearing and interpolated to obtain translation values per pixel. These high resolution matrices were then applied to register T1-MRIs of the second time point to the location of the first time point.
Subtraction maps: Following the pre-processing, subtraction maps were calculated by simply subtracting the processed images of the series acquired immediately after the contrast injection from a series acquired later on.
In order to enhance BBB abnormalities, in some cases, additional processing was performed. This processing consisted of calculating the absolute value of the original subtraction image, smearing it with circular smearing and multiplying the result with the original map. In the enhanced maps regions with large abnormalities are enhanced and regions with small abnormalities (noise) are reduced.
DCE permeability maps: DCE data were acquired continuously for 18 min in one stroke patient. Following image acquisition, permeability maps were calculated by: (a) A bidirectional two-compartment model, in which a bi-exponential fit was applied on a per-pixel basis; and (b) simulating subtraction BBB maps by calculating 'artificial' T1-series, each series obtained by averaging the DCE images over 2 min, and then subtracting the later series from the first post contrast series. ROIs for volume analysis were plotted on the maps 3 times with different window levels. The data is presented as mean values ± standard errors.
Volume calculations: The area of BBB opening/DWMRI lesion was calculated from the BBB maps/DWMRIs. ROIs were defined over the entire enhancing region in each slice. The number of pixels in the ROIs were counted and multiplied by the volume of a single pixel.
BBB score: The following BBB opening score was defined:
- 0 - No BBB opening
- 1 - small BBB opening (≤ 30% of the ischemic lesion on DWMRI) depicted only in the maps
- 2 - significant BBB opening (≥ 30% of the ischemic lesion) depicted only in the maps
- 3 - Significant BBB opening depicted both in the maps and in the T1-MRIs
Lacunar vs non-lacunar strokes: Since BBB opening may be related to the blocked blood vessels origin, the stroke lesions were categorized by a neurologist and a neuroradiologist as lacunar or non-lacunar. The BBB score of the two stroke types were compared.
Results and Discussion
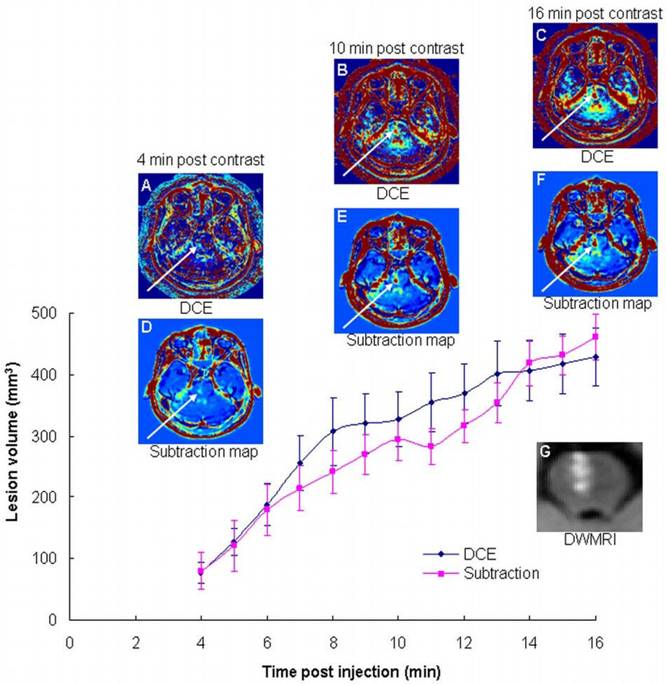
The advantage of long delays: One stroke patient was scanned by continuous DCE for 18 min. Both calculation methods showed significantly increased BBB opening volumes as a function of time (Figure 1), demonstrating the additional information obtained during this time period. The volumes depicted in the maps calculated at 16 min post contrast were significantly larger (5.6±1.4 using the two-compartment model and 5.8±2.2 using the subtraction method; p<0.0001 for both) than those calculated at 4 min. The clinical scenario requires short acquisition times. Since our maps are calculated from T1-MRI series acquired ~15 min apart, additional sequences may be acquired during this interim, thus minimizing overall scan times.
The advantage of long delay times post contrast injection. Shown are BBB maps calculated from DCE data acquired continuously over 18 min using the bidirectional two-compartment model (A-C), and the subtraction methodology (D-F), in a patient with an ischemic stroke lesion in the brain stem (G). Also shown is the BBB disruption volume as a function of time after contrast injection for the two calculation methodologies.
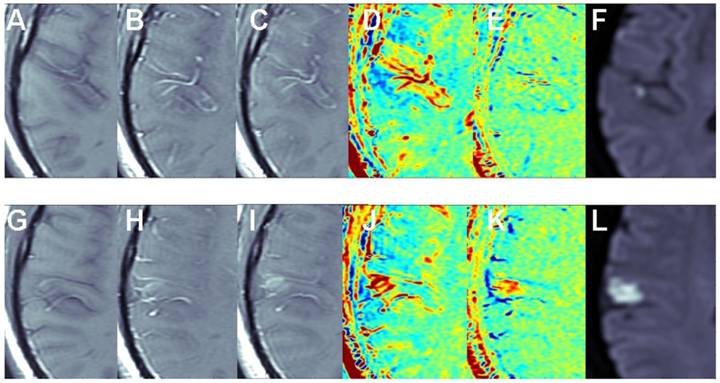
The benefit of the subtraction scheme for subtle BBB opening: Figure 2 shows two adjacent slices of a small stroke. When subtracting the image acquired pre contrast from the delayed image acquired ~15 min post contrast it is difficult to differentiate between swollen vessels and BBB opening since both result in positive signals. However, when the first image post injection is subtracted from the delayed image post contrast (acquired ~15 min later), the vessels appear blue, while BBB opening remains red, enabling clear differentiation between vessels and BBB compromise.
The benefit of the subtraction scheme for subtle BBB opening. T1-MRIs of two adjacent slices (A-F and G-L) of a small stroke pre-contrast (A, G), immediately post contrast (B, H), and ~15 min post contrast (C, I). Maps calculated by subtracting the pre-contrast images from the images acquired ~15 min post contrast (D, J) show both vessels and BBB disruptions as positive signals (red). Maps calculated by subtracting the immediate post-contrast images from those acquired ~15 min later (E, K) show vessels as negative signals (blue) and BBB opening as positive signals (red).
Brain metastases: Examples of T1-MRIs and calculated maps of a brain metastasis are shown in Figure 3, A-D. The apparent diffusion coefficient (ADC) map, calculated from DWMRIs, depicts viable tissues dark and liquefied/necrotic tissues bright. It can be seen that vessels that appear bright in the T1-MRI, appear blue in the subtraction maps. Viable regions in the tumor, which appear enhanced in the T1-MRI and dark in the ADC map, appear blue in the subtraction maps, suggesting fast clearance of the contrast agent. Necrotic regions of the tumor, appearing un-enhanced in the T1-MRI and bright in the ADC map, appear red in the subtraction maps, suggesting high accumulation of the contrast agent. Differentiation between viable and necrotic regions seems similar in the ADC map and in the enhanced subtraction map, while additional information, regarding the clearance rate of the contrast agent within the viable region is depicted in the regular subtraction map. A thin rim of significant contrast accumulation is depicted as a red ring surrounding the blue viable region of the tumor in the subtraction maps.
Contrast-enhanced T1-MRI (A, E) and ADC (B, F), subtraction (C, G) and enhanced subtraction (D, H) maps of patients with breast-cancer (A-D) and melanoma (E-H) brain metastases. Vessels are pointed to by blue arrows, viable regions in the tumor by green arrows and necrotic regions by black arrows.
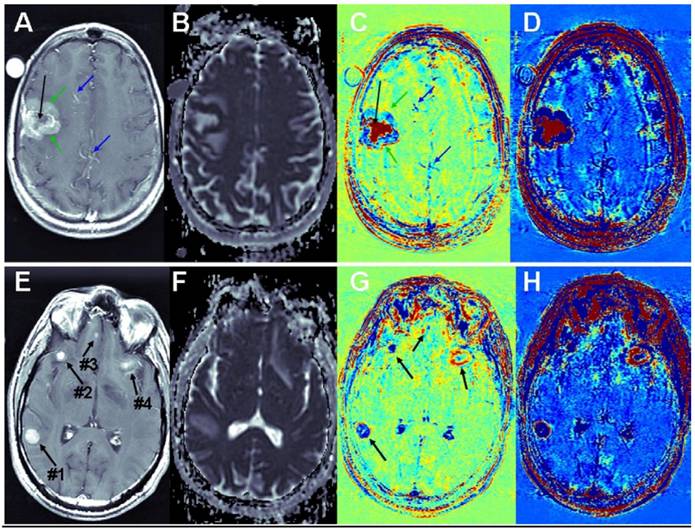
Additional examples of brain metastases are shown in Figure 3, E-H. In this case, the correlation between BBB leakiness and viability is less clear. Still there are significant variations between the appearances of the different metastases in the subtraction maps, suggesting that the information provided by the BBB maps is not redundant with that of conventional MRI.
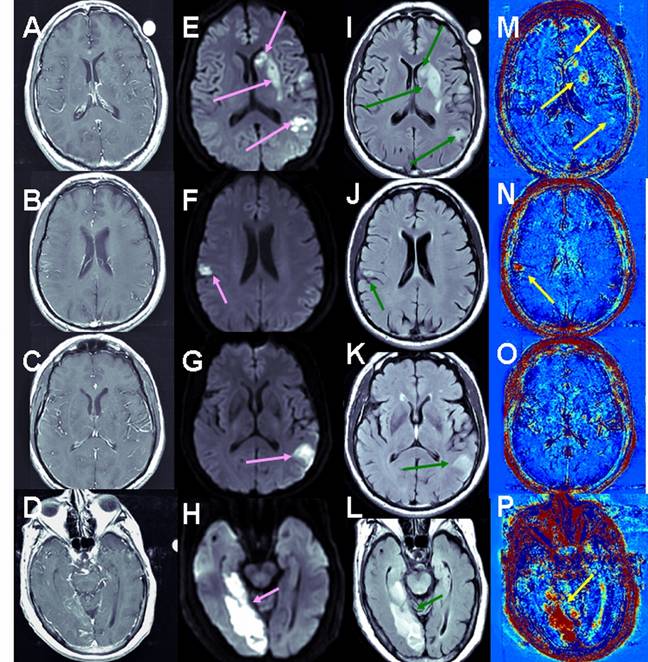
Stroke Cohort Results: Unlike brain metastases in which part of the enhancing tumors appear blue (fast clearance of the contrast from the tumor), all the strokes analyzed in this study appeared red in the subtraction maps, suggesting slow contrast accumulation in the tissue. Examples are shown in Figure 4.
Examples of BBB maps in ischemic stroke. Contrast-enhanced T1-MRI (A-D), DWMRI (E-H), T2 FLAIR (I-L) and enhanced maps (M-P) of 3 patients several days after the onset of ischemic strokes. The stressed tissue is enhanced on the DWMRI and FLAIR. BBB opening is depicted in red in the maps. Patient #2 (A, E, I, M) had a large stroke, divided into several ischemic lesions. Moderate BBB opening was depicted in several regions within these lesions. Patient #14 (B, F, J, N, C, G, K, O) had two ischemic regions. The small lesion showed significant BBB opening (N), while the larger lesion showed no evidence of BBB compromise (O). The stroke of patient #12 (D, H, L, P) presented significant BBB opening both in T1-MRI and on the subtraction maps. Still, the volume of BBB opening depicted on the maps was significantly larger than in the T1-MRIs.
Overall, 33 patients were included in the analysis. When calculating the BBB maps using the 2nd time point at 14.4±0.3 min, 12 exhibited no BBB abnormalities (score 0), 9 exhibited BBB opening only in the maps (score 1&2), and 12 exhibited opening in the maps and in T1-MRIs (score 3). Thus 27% of the patients depicted BBB opening that was detectable on the maps but not on T1-MRI. Of the 12 patients with score 3, the volume of BBB opening in the maps was 2.7 times that in T1-MRI: 4.2±1.5 cm3 vs. 1.5±0.6 cm3, p<0.0005 (Wilcoxon matched-pairs signed-ranks test). On maps using the 2nd time point at 7.0±1.7 min, BBB opening was 1.8 times larger (P<0.009) than in the T1-MRIs. The difference between the volumes calculated from the 7 min maps was significantly smaller than that calculated from the 14.4 min maps (p<0.04, paired t test).
The average score of lacunar strokes (n=10) was significantly lower than that of non-lacunar strokes (n=23): 0.5±0.2 vs. 1.9±0.3, p<0.003 (unpaired t test).
These results demonstrate the feasibility of imaging subtle BBB opening with high spatial resolution and high sensitivity to BBB leakiness. Several factors contribute to this high sensitivity. The early T1-series is acquired immediately after contrast injection instead of prior to it, enabling clear differentiation between swollen blood vessels and slow contrast accumulation (Figure 2). In addition, the ~15 min delay enables detection of the slow permeability compartment, reflected in larger volumes of disruption (Figure 1). Since high temporal resolution is not required, we use high resolution spin-echo T1-MRI which is highly sensitive to Gd-based contrast agents. The analysis includes extensive image pre-processing.
The clinical scenario requires short acquisition and analysis times. Since the maps are calculated from T1-MRI series acquired ~15 min apart, additional sequences may be acquired during this interim (in contrast to a continuous DCE acquisition throughout this period of time), thus significantly minimizing scan times. Offline analysis can be performed in less than 10 min.
The ~15 min time frame appears optimal in the case of ischemic stroke. The case presented in Figure 1 demonstrates that this delay significantly increases the sensitivity to BBB disruption. This effect is consistent with the significantly larger disruption volumes calculated at 14.4 min versus 7 min in the patients with score 3. In addition, in all patients, BBB opening was detected as positive signals, reflecting slow accumulation of the contrast agent in the tissue, unlike the case of brain metastases, in which both the fast permeability (blue) and the slow permeability (red) compartments were depicted.
The larger number of patients exhibiting BBB opening in the maps relative to T1-MRI, together with the larger volumes of disruption depicted in the maps, demonstrate the high sensitivity of this methodology and its ability to provide additional important information in the case of stroke.
Conclusion
We have developed a new methodology for depiction of subtle BBB disruption based on delayed contrast extravasation. The significant advantage of the relatively long delay was demonstrated in a DCE study showing that by waiting 16 minutes after contrast administration the volume of BBB disruption increased by a factor of 5.6-5.8 relative to the conventional time frame of 4 minutes. BBB maps are calculated from images acquired post contrast administration, thus providing clear differentiation between blood vessels and subtle BBB opening. Additional sensitivity is obtained by high resolution T1-MRIs and significant pre-processing. In the ischemic stroke scenario our BBB maps provide clear depiction of significant volumes of BBB disruption unattainable by conventional contrast-enhanced MRI without the need for long overall scan times. A significant clinical application for real-time depiction of BBB function would be to determine individual risk for hemorrhage induced by recanalization treatment. Further studies designed to establish the correlation between early BBB opening and later outcome are ongoing.
Depiction of subtle BBB disruption may be applied for other disorders as well. In the case of brain tumors presented by Lüdemann et al (25), the information obtained by delayed contrast extravasation demonstrated the feasibility of differentiation between tumor types and grades. In their work, they were limited to one slice and low spatial resolution. The ability to obtain high resolution maps of the whole brain may be lead to clinical translation of this information as well as further expanding to additional applications such as prediction of response to therapy. The ability to depict regions of subtle BBB opening in the clinical scenario may open new insights in the diagnosis, treatment planning and treatment monitoring of CNS disorders in which BBB abnormalities are suspected to play a key role, but limited by the low sensitivity of current imaging methodologies.
Acknowledgements
We thank Dr. Tamches for his helpful advice, Mr. Tamar and Mrs. Salomon for their assistance in the animal studies, and Dr. Koks, Mally Lewkowski and Meirav Izchak for their help with the patients.
Study Funding: A grant from the Nella and Leon Benoziyo Center for Neurological Diseases, a grant from Benoziyo Institute of Molecular Medicine, and a Yeda CEO grant of the Weizmann Institute to Talia Volk.
Conflict of interests
Drs. Israeli, Volk and Mardor are authors of a pending patent titled ASSESSMENT OF BLOOD-BRAIN BARRIER DISRUPTION (May 2007).
References
1. Roberts HC, Roberts TP, Brasch RC, Dillon WP. Quantitative measurement of microvascular permeability in human brain tumors achieved using DCE MR imaging: correlation with histologic grade. Am J Neuroradiol. 2000;21:891-899
2. Cao Y, Shen Z, Chenevert TL, Ewing JR. Estimate of vascular permeability and cerebral blood volume using Gd-DTPA contrast enhancement and dynamic T2*-weighted MRI. J Magn Res Imag. 2006;24:288-296
3. Starr JM, Wardlaw J, Ferguson K. et al. Increased blood-brain barrier permeability in type II diabetes demonstrated by gadolinium magnetic resonance imaging. J Neurol Neurosurg Psychiatry. 2003;74:70-76
4. Knopp EA, Cha S, Johnson G. et al. Glial neoplasms: DCE T2*-weighted MR imaging. Radiology. 1999;211:791-798
5. Patankar TF, Haroon HA, Mills SJ. et al. Is volume transfer coefficient (K(trans)) related to histologic grade in human gliomas? Am J Neuroradiol. 2005;26:2455-2465
6. Starr JM, Farrall AJ, Armitageb P. et al. Blood-brain barrier permeability in Alzheimer's disease: a case-control MRI study. Neuroimag. 2009;171:232-241
7. Tomkins O, Shelef I, Kaizerman I. et al. Blood-brain barrier disruption in post-traumatic Epilepsy. J Neurol Neurosurg Psychiatry. 2008;79:774-777
8. Yang S, Law M, Zagzag D. et al. DCE perfusion MR imaging measurements of endothelial permeability: Differentiation between atypical and typical meningiomas. Am J Neuroradiol. 2003;24:1554-1559
9. Hjort N, Wu O, Ashkanian M. et al. MRI detection of early blood-brain barrier disruption: parenchymal enhancement predicts focal HT after thrombolysis. Stroke. 2008;39:1025-8
10. Ding G, Jiang Q, Li L. et al. Detection of BBB disruption and hemorrhage by Gd-DTPA enhanced MRI after embolic stroke in rat. Brain Res. 2006;1114:195-203
11. Ewing JR, Knight RA, Nagaraja TN. et al. Patlak plots of Gd-DTPA MRI data yield blood-brain transfer constants concordant with those of 14C-sucrose in areas of blood-brain opening. Magn Res in Med. 2003;50:283-292
12. Jiang Q, Ewing JR, Ding GL. et al. Quantitative evaluation of BBB permeability after embolic stroke in rat using MRI. J Cereb Blood Flow Metab. 2005;25:583-92
13. Knight RA, Karki K, Ewing JR. et al. Estimating blood and brain concentrations and blood-to-brain influx by magnetic resonance imaging with step-down infusion of Gd-DTPA in focal transient cerebral ischemia and confirmation by quantitative autoradiography with Gd-[(14)C]DTPA. J Cereb Blood Flow Metab. 2009;29:1048-58
14. Nagaraja TN, Karki K, Ewing JR. et al. Identification of variations in blood-brain barrier opening after cerebral ischemia by dual contrast-enhanced magnetic resonance imaging and T 1sat measurements. Stroke. 2008;39:427-32
15. Neumann-Haefelin T, Kastrup A, de Crespigny A. et al. Serial MRI after transient focal cerebral ischemia in rats: dynamics of tissue injury, blood-brain barrier damage, and edema formation. Stroke. 2000;31:1965-72
16. Pillai DR, Dittmar MS, Baldaranov D. et al. Cerebral ischemia-reperfusion injury in rats-A 3 T MRI study on biphasic blood-brain barrier opening and the dynamics of edema formation. J Cereb Blood Flow Metab. 2009;29(11):1846-55
17. Taheri S, Sood R. Partial volume effect compensation for improved reliability of quantitative blood-brain barrier permeability. Magn Reson Imaging. 2007;25:613-25
18. Latour LL, Kang DW, Ezzeddine MA, Chalela JA, Warach S. Early blood-brain barrier disruption in human focal brain ischemia. Ann Neurol. 2004;56:468-477
19. Ning M, Furie KL, Koroshetz WJ. et al. Association between tPA therapy and raised early matrix metalloproteinase-9 in acute stroke. Neurology. 2006;66:1550-5
20. Warach S, Latour LL. Evidence of reperfusion injury, exacerbated by thrombolytic therapy, in human focal brain ischemia using a novel imaging marker of early blood-brain barrier disruption. Stroke. 2004;35(11 Suppl 1):2659-2661
21. Kassner A, Roberts T, Taylor K, Silver F, Mikulis D. Prediction of hemorrhage in acute ischemic stroke using permeability MR imaging. Am J Neuroradiol. 2005;26:2213-2217
22. Bang OY, Buck BH, Saver JL. et al. Prediction of HT after recanalization therapy using T2*- permeability magnetic resonance imaging. Ann Neurol. 2007;62:170-176
23. Bang OY, Saver JL, Alger JR. et al. Patterns and predictors of blood-brain barrier permeability derangements in acute ischemic stroke. Stroke. 2009;40:454-461
24. Rosenberg GA. Inflammation and white matter damage in vascular cognitive impairment. Stroke. 2009;40:s20-s23
25. Lüdemann L, Grieger W, Wurm R, Wust P, Zimmer C. Quantitative measurement of leakage volume and permeability in gliomas, meningiomas and brain metastases with DCE MRI. Magn Reson Imaging. 2005;23:833-841
Author contact
![]() Corresponding author: Yael Mardor, The Advanced Technology Center, Sheba Medical Center, Tel-Hashomer, Ramat-Gan 52621, Israel. Phone: 972-52-6667274; Fax: 972-3-5303146; E-mail: yael.mardorhealth.gov.il
Corresponding author: Yael Mardor, The Advanced Technology Center, Sheba Medical Center, Tel-Hashomer, Ramat-Gan 52621, Israel. Phone: 972-52-6667274; Fax: 972-3-5303146; E-mail: yael.mardorhealth.gov.il