Impact Factor ISSN: 1449-2288

 Global reach, higher impact
Int J Biol Sci 2011; 7(3):323-332. doi:10.7150/ijbs.7.323 This issue Cite
Research Paper
Genetic Differentiation among Populations and Color Variants of Sea Cucumbers (Stichopus Japonicus) from Korea and China
Jung-Ha Kang1, Yi-Kyong Kim1, Mi-Jung Kim1, Jung-Yeon Park1, Chul-Min An1, Bong-Seok Kim1, Je-Cheon Jun2, Sang-Kyu Kim1 ![]()
1. Biotechnology Research Division, NFRDI, Busan 619-705, Korea
2. Aquaculture Management Division, NFRDI, Busan 619-705, Korea
Received 2011-2-8; Accepted 2011-3-24; Published 2011-3-30
Abstract
The Far Eastern sea cucumber, Stichopus japonicus, is a favored food in Eastern Asia, including Korea, Japan, and China. Aquaculture production of this species has increased because of recent declines in natural stocks and government-operated stock release programs are ongoing. Therefore, the analyses of genetic structure in wild and hatchery populations are necessary to maintain the genetic diversity of this valuable marine resource. In addition, given that sea cucumber color affects market price, with the rare, possibly reproductively isolated, red type being the most valuable, an understanding of the genetic structure and diversity in color variation of green and red types is necessary. We analyzed the genetic structure of wild and hatchery-produced green type S. japonicus from Korea and China, and wild red type from Korea using 9 microsatellite makers. The number of alleles per locus ranged from 11 to 29 across all populations. The mean allele numbers of the green types from Korea (10.6) and China (10.1) were similar, but differed slightly from that of the red type (9.1). Pairwise multilocus FST and genetic distance estimations showed no significant differences between the green types from Korea and China, whereas the differences between the green and red types were significant. This was clearly illustrated by a UPGMA dendrogram, in which the two close subclusters of green types were completely separated from the red type. In addition, the allele frequencies of the green and red types were significantly different. Assignment tests correctly assigned 100% (quality index 99.97%) of individuals to their original color types and demonstrated the feasibility of microsatellite analysis for discrimination between color types.
Keywords: Stichopus japonicus, microsatellite, genetic differentiation, color variants
Introduction
Sea cucumbers are echinoderms of the class Holothuroidea. More than 1,250 species of sea cucumber are found on the sea floor worldwide, from shallow offshore areas to the deep sea, where they often make up the majority of the animal biomass. Among the approximately 20 species of edible sea cucumber, the Far Eastern sea cucumber (Stichopus japonicus), which inhabits the coastal areas of Eastern Asia, including Korea, Japan, China, and Far Eastern Russia, is one of the most favored species [1]. In response to decreases in natural resources in the face of increasing demand, aquaculture production of sea cucumbers is increasing. In addition to increased sea cucumber farming, the Korean government has sponsored artificial sea cucumber seeding release for natural resource restoration since 2004. However, hatchery production raises concerns regarding the maintenance of genetic diversity among cultured stocks, especially because their seedlings are released into natural habitats. This has created a need for a traceability system and has raised questions about the genetic differences among sea cucumber populations in Korea and China which are geographically close and trade of aquaculture products is very active these days. Although it has been reported that the genetic diversity of hatchery stocks had not changed during the last 20 years of sea cucumber farming in China [2], it is necessary to investigate the genetic variability of wild and cultured sea cucumbers for the restoration and management of wild populations, as well as to promote the production of high-quality sea cucumbers through aquaculture.
For S. japonicus populations in Eastern Asia, differences with respect to color variants are of concern. There are three color variants of S. japonicus: red, green, and black [3]. Color is one of the major traits affecting the price of sea cucumbers, with the rare red variant being the most favored. However, color variation is not noticeable in the early life stages, such as when seeds are released for resource restoration. Thus, it is possible to unintentionally introduce mixed color variants. Several reports have examined the genetic diversities of wild and cultured sea cucumber populations in relation to color variation. For example, analysis of ten alloenzyme makers showed clear genetic differences among these three color variants [4, 5]. Although alloenzyme analysis revealed population differences between color types, suggesting possible reproductive isolation, no fixed alloenzyme difference was detected. In addition, the use of alloenzyme markers was limited to fresh adult specimens. To address the limitations of the alloenzyme approach, microsatellite makers have been developed for sea cucumbers [6]. In an analysis of three color variants from five different localities in Japan using 11 microsatellite makers, the green and black color variants formed one cluster with subclusters from the same localities, which were separated from the red variants [7].
There is only one examination of the genetic diversity of sea cucumber populations in Korea [8] and it reported significant deviation from Hardy-Weinberg equilibrium for microsatellite alleles in five wild populations and clustering of those populations depending on geographical origin.
In the present study, using 9 microsatellite markers, we further analyzed wild and hatchery-produced green and red sea cucumbers from Korea and China to investigate the genetic diversities and relationships among populations for the discrimination of the origin and color variants.
Materials and Methods
Sample collection
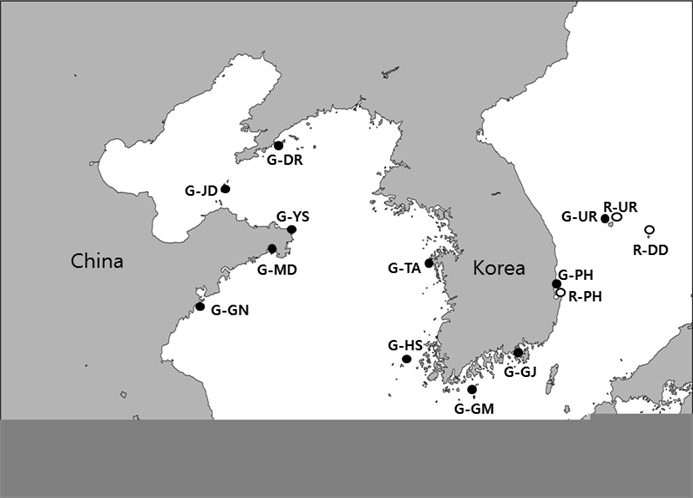
A total of 528 wild green sea cucumber samples were collected from six localities around the Korean Peninsula and five hatcheries located on the Yellow Sea coast of northern China. In addition, 134 individuals from three wild populations of red sea cucumber were sampled from the eastern cost of the Korean Peninsula (Fig. 1). Tissue samples were preserved in 100% ethanol at the sampling site and then transported to the laboratory for DNA extraction. Total DNA was isolated from each sample using a MagExtractor MFX-6100 automated DNA extraction system (Toyobo, Osaka, Japan). The extracted genomic DNA was quantified using a Nanodrop ND-1000 spectrophotometer (Thermo Fisher Scientific) and stored at −20°C until microsatellite genotyping analysis.
Geographical map showing locations and abbreviated names of S. japonicas samples from Korea and China. The prefixes G and R in the abbreviations mean green and red color types, respectively. The abbreviations are as follow: G-GN (Jiaonan), G-MD (Wendeng), G-YS (Rongcheng), G-JD (Changdo), G-DR (Dalian), G-TA (Taean), G-HS (Heuksan), G-GM (Geomun), G-GJ (Geoje), G-PH (Pohang), G-UR (Ulleung), R-PH (Pohang), R-UR (Ulleung) and R-DD (Dokdo).
Microsatellite analysis
A total of 20 microsatellite makers were tested for PCR compatibility, and the following 9 loci were selected for use: Psj2022, Psj2031, Psj2409, Psj2463, Psj2575, Psj2889, Psj2368, Psj3072, and Psj2969 [6]. For multiplex PCR, the 5′ end of each forward primer was labeled with one of three fluorescent dyes: 6-FAM, HEX, and NED (Applied Biosystems, Foster City, CA, USA). The combinations for the multiplex PCRs were as follows: Psj2031, Psj 2889 and Psj 2409 (annealing temperature 61ºC), Psj2463, Psj 2368 and Psj 2969 (annealing temperature 57ºC), Psj3072, Psj 2022 and Psj 2575 (annealing temperature 52ºC). PCR for the amplification of microsatellite loci was performed in a 10-µL reaction volume containing 1× ExTaq buffer, 10-50 ng of template DNA, 0.2 mM dNTPs, 0.5 µM of each primer, and 0.25 U Taq DNA polymerase (Takara, Shiga, Japan), using an RTC 200 MJ-Research thermocycler. The PCR conditions were as follows: initial denaturation at 95ºC for 11 min, followed by 35 cycles of denaturation at 94ºC for 1 min, annealing at optimum temperature for each primer set for 1 min, and extension at 72ºC for 1 min, with a final extension at 72ºC for 5 min. A 1-µl aliquot of PCR product was mixed with a genotyping reaction mixture containing formamide and a size standard, GeneScan-400HD ROX (Applied Biosystems), and electrophoresed using an ABI3130 DNA sequencer (Applied Biosystems). The fragment lengths of the PCR products were determined using GeneMapper software ver. 4.0 (Applied Biosystems).
Statistical analysis
The number of alleles per locus, allele frequency and heterozygosity were calculated using CERVUS 3.03 [9]. Deviations from Hardy-Weinberg equilibrium (HWE) were estimated using GENEPOP 3.4 [10], and adjusted P-values for both analyses were obtained using a sequential Bonfferoni test for multiple comparisons [11]. MICRO-CHECKER 2.2.3 [12] was used to test the presence of null allele. Allelic richness (AR) as a standardized measure of the number of alleles per locus independent of the sample size was calculated with FSTAT version 2.9.3 [13]. A possible geographical pattern in the distribution of genetic variability was analyzed through FST stimates and genetic distances between each pair of populations [14]. The genetic distance matrices were used to construct UPGMA genetic population relation trees with the software package PHYLIP ver. 3.5 [15]. GeneClass version 2.0 program [16] was used to estimate the likelihood of an individual's multilocus genotype to be assigned to the population from which it was sampled.
Results
Genetic variability
The genetic diversity indices estimated for the 14 sea cucumber populations are summarized in Table 1. All loci were highly polymorphic, although the degree of variability was different at each locus. The number of alleles per locus varied from 11 to 29, and allelic richness per locus ranged from 1 to 19.3 across all populations. The average allele number among all populations was 10.1, with a minimum of 8.2 in the R-UR population and a maximum of 11.0 in the G-PH and G-GM population. The mean allelic richness were 9.5 in all green type populations and 8.2 all red type populations. Although there was no significant difference in the average number of alleles between the green type sea cucumbers from Korea (10.6) and China (10.1), the average of the red type (9.1) was slightly different from that of the green type (10.4). In particular, the red type showed very limited genetic diversity at Psj2463, with the number of alleles ranging from 1 to 4. This is in contrast to the green population, which showed allele numbers ranging from 8 to 11 at that locus. The HWE test which indicates the deviation from expected heterozygosity showed significant deviation in 36 of the 126 single-locus exact tests after sequential Bonferroni's correction (Table 1). Null alleles were detected 7 of 9 loci except for loci Psj2463 and Psj3072.
Variability of alleles at nine microsatellite loci survey in eleven green type and three red type populations of S. japonicus.
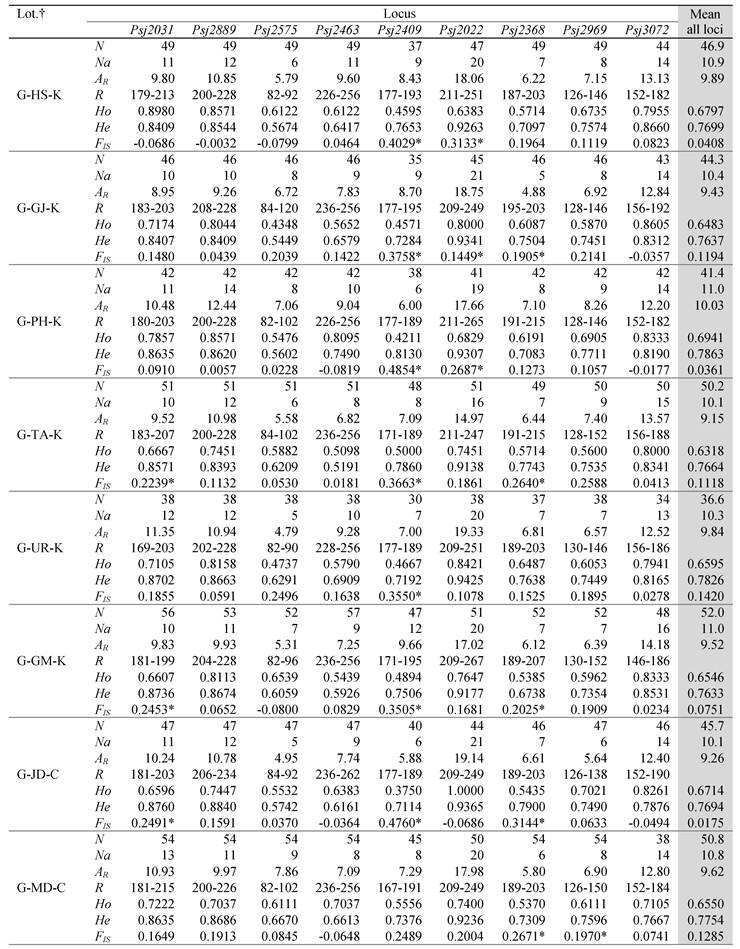
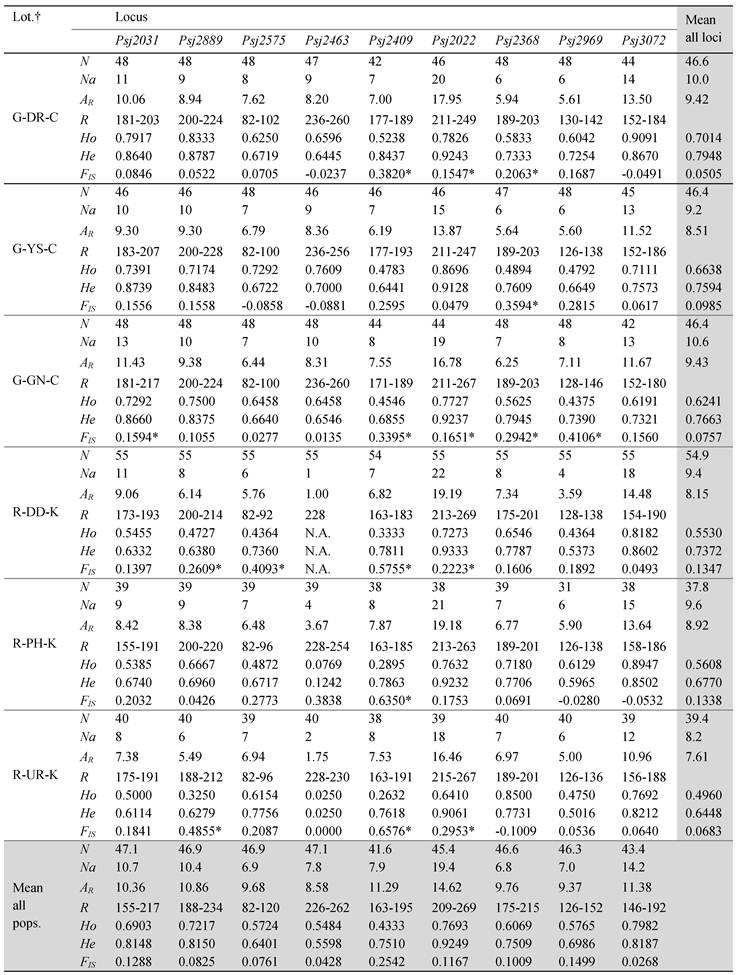
†The prefixes G and R in the abbreviation of locations mean green and red color types and the suffixes K and C mean the origin from Korea and China, respectively. All of samples originated from China is hatchery -produced and the others are from wild populations. N is the sample size, Na is the number of alleles, AR is the allele richness, R is the size range of PCR products, Ho is the observed heterozygosity, He is the expected heterozygosity, and FIS is the inbreeding coefficient. *Not in conformity with Hardy-Weinberg equilibrium (P < 0.005, Bonferroni-corrected value).
Genetic relationships among populations
Matrices of pairwise multilocus FST (below diagonal) and genetic distance (upper diagonal) estimates are given in Table 2. The pairwise FST values between the green and red populations were significantly different for all pairwise comparisons. The genetic distances among or between populations were as follows: among the wild green type from Korea, 0.029-0.075 (average, 0.054); among the hatchery green type from China, 0.040-0.106 (0.077); among the red type, 0.014-0.026 (0.020); between the Korean green and Chinese green types, 0.047-0.108 (0.074); between the green and red types, 0.656-0.853 (0.752). These results revealed that the genetic distances among the wild green types from Korea are less than those among the hatchery green types from China, but that the green types from Korea and China are very closely related. The red type sea cucumbers exhibited a much closer relationship among populations than the green types and showed significant distance from the green types.
Multilocus Estimates of FST (below diagonal) and genetic distance (upper diagonal) between all populations of S. japonicus.
| VARIANT | LOCATION | GREEN | RED | |||||||||||||
|---|---|---|---|---|---|---|---|---|---|---|---|---|---|---|---|---|
| KOREA | CHINA | KOREA | ||||||||||||||
| G-HS | G-GJ | G-PH | G-TA | G-UR | G-GM | G-JD | G-MD | G-DR | G-YS | G-GN | R-DD | R-PH | R-UR | |||
| Green | Korea | G-HS | - | 0.052 | 0.036 | 0.057 | 0.052 | 0.029 | 0.104 | 0.080 | 0.051 | 0.064 | 0.051 | 0.701 | 0.665 | 0.721 |
| G-GJ | 0.007* | - | 0.061 | 0.056 | 0.046 | 0.074 | 0.093 | 0.095 | 0.061 | 0.086 | 0.051 | 0.785 | 0.736 | 0.805 | ||
| G-PH | 0.000 | 0.009* | - | 0.066 | 0.051 | 0.048 | 0.108 | 0.083 | 0.047 | 0.091 | 0.079 | 0.705 | 0.656 | 0.732 | ||
| G-TA | 0.002 | 0.006* | 0.013* | - | 0.075 | 0.055 | 0.077 | 0.101 | 0.057 | 0.097 | 0.081 | 0.820 | 0.776 | 0.847 | ||
| G-UR | 0.002 | 0.005 | 0.001 | 0.009* | - | 0.054 | 0.079 | 0.054 | 0.066 | 0.066 | 0.063 | 0.744 | 0.684 | 0.775 | ||
| G-GM | 0.002 | 0.016* | 0.001 | 0.004 | 0.002 | - | 0.081 | 0.070 | 0.047 | 0.073 | 0.068 | 0.720 | 0.672 | 0.740 | ||
| China | G-JD | 0.004 | 0.007* | 0.006* | 0.003 | 0.004 | 0.004 | - | 0.040 | 0.089 | 0.105 | 0.106 | 0.853 | 0.802 | 0.875 | |
| G-MD | 0.001 | 0.014* | 0.002 | 0.012* | 0.002 | 0.000 | 0.003 | - | 0.079 | 0.081 | 0.087 | 0.829 | 0.765 | 0.864 | ||
| G-DR | 0.006* | 0.011* | 0.005 | 0.009* | 0.004 | 0.001 | 0.002 | 0.001 | - | 0.072 | 0.072 | 0.736 | 0.691 | 0.762 | ||
| G-YS | 0.012* | 0.025* | 0.017* | 0.019* | 0.009* | 0.014* | 0.009* | 0.008* | 0.006 | - | 0.055 | 0.709 | 0.681 | 0.755 | ||
| G-GN | 0.006 | 0.009* | 0.013* | 0.009* | 0.007 | 0.012* | 0.005 | 0.007* | 0.007 | 0.012* | - | 0.724 | 0.683 | 0.747 | ||
| Red | Korea | R-DD | 0.232* | 0.236* | 0.219* | 0.239* | 0.212* | 0.239* | 0.227* | 0.222* | 0.225* | 0.212* | 0.220* | - | 0.014 | 0.019 |
| R-PH | 0.201* | 0.205* | 0.187* | 0.209* | 0.179* | 0.209* | 0.197* | 0.190* | 0.195* | 0.184* | 0.189* | 0.003 | - | 0.026 | ||
| R-UR | 0.241* | 0.242* | 0.227* | 0.245* | 0.220* | 0.249* | 0.233* | 0.228* | 0.232* | 0.224* | 0.228* | 0.001 | 0.002 | - | ||
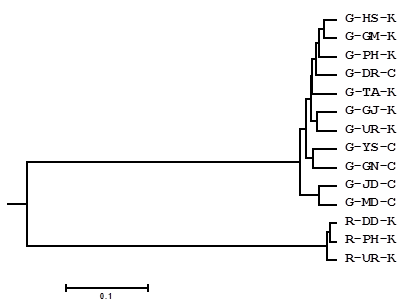
A UPGMA dendrogram illustrates the genetic relationships among populations (Fig. 2). The green and red types formed clearly separated clusters. The green type cluster was further segregated into three subclusters: the green populations from China, with the exception of the G-DR population, formed separate clusters, and all green sea cucumbers from Korea plus the G-DR population from China formed a separate subcluster.
UPGMA tree constructed from unweighted pair group method with the arithmetic mean from the Dc distance of nine microsatellite loci.
Distribution of alleles
A total of 156 alleles were found at the 9 loci in all populations, and 53 and 13 alleles were found only from the green and red type sea cucumbers, respectively. The frequencies of the alleles at each locus are shown in Fig. 3.
Allele frequencies at nine microsatellite loci from the green type (open box) and red type (closed box) populations S. japonicus. X axis: allele numbers, Y axis: allele frequencies.
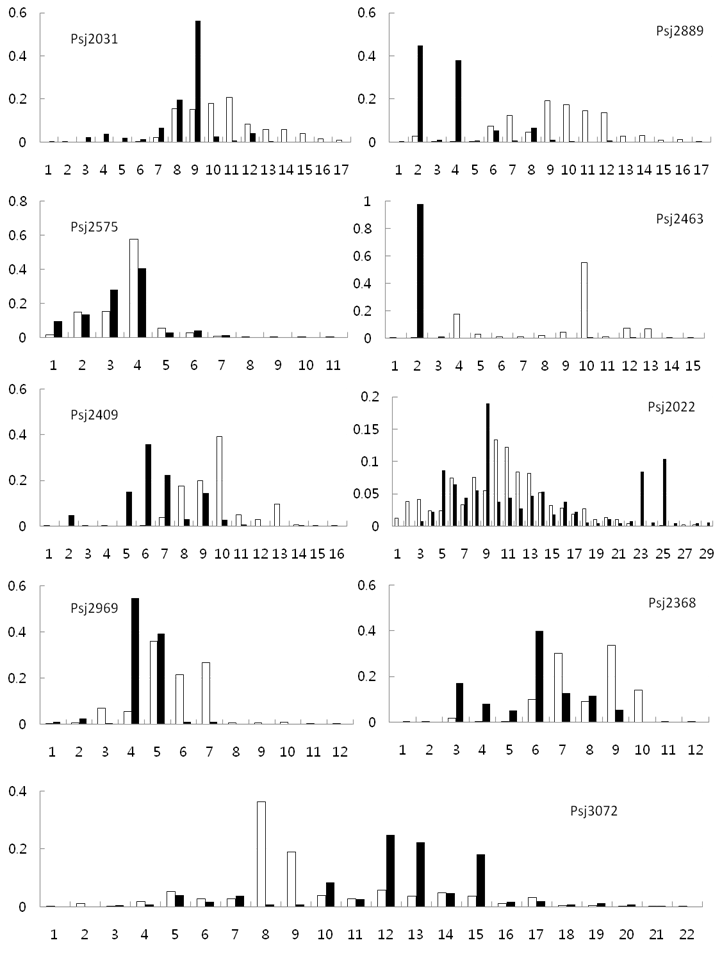
The maximum number of alleles was detected at locus Psj2022 (n = 29), and the allele frequencies at this locus were similar between the red and green type populations, except that two alleles were more common in the red type. Similar allele frequencies between the green and red types were also observed at loci Psj2575. However, there were clear differences in the allele frequencies between the green and red types at some loci, especially at Psj2889, Psj2463, and Psj3072. In addition to the differences in the allele distribution between the green and red types, the green types from China and Korea showed difference in allele distribution. Among 143 unique alleles in the green type, 35 and 12 alleles were found in sea cucumbers from wild (Korea) and hatchery (China), respectively. Assignment test based on the allele distribution confirmed these results, which showed discrimination of two color types with 100% accuracy (quality index 99.97%) and assignment of green type from China and Korea with 75% accuracy (quality index 71.79%) to their origin.
Discussion
Assessments of genetic diversity among marine resources, especially for species for which artificial stocks are produced by aqua farming or hatchery produced seed for natural resource restoration, are vital to ensure that genetic diversity is not lost. Sea cucumbers, which are important seafood and source for traditional medicines, have been produced by aquaculture for more than 20 years in Eastern Asia because of shortages in natural resources [17]. Color variation among sea cucumbers, which include green, black, and red variants, affects their taste and market price. This necessitates the development of genetic markers that can be used to assess genetic variations among populations and prevent the release of mixed hatchery seeds, the color of which is not detectible by eye. In this study, we used 9 microsatellite makers to examine the genetic diversity among 11 green type populations from Korea and China and three red type populations from Korea.
The mean allele number in the 14 populations ranged from 8.2 to 11.0, with an average of 10.1, while heterozygosity ranged from 0.320 to 0.798, with an average of 0.711. These results were similar to those of a previous study of Korea green types, but lower than those previously determined from Chinese populations [2]. The red type showed fewer alleles and lower heterozygosity, with values of 8.6 and 0.48, respectively, compared with 9.0 and 0.632 for the green type [7]. For the Japanese populations, the average number of alleles and heterozygosity for green type were 8.16 and 0.649, respectively, and those of the red type were 6.98 and 0.455, which is consistent with our results. The PCR products for 7 of 9 microsatellite loci showed very close size range to those of corresponding loci for samples from Japan, which suggest the presence of similar alleles in different populations.
Significant deviation from FIS value observed in 36 of the 126 single-locus /population combinations. The FIS values reflect deviation from HWE genotype frequencies, with a high positive FIS value indicating lower heterozygosity than that predicted by HWE. Several factors such as the presence of unrecognized null alleles, natural selection acting on the genetic markers, mating among relatives, or reduction of heterozygosity in a population caused by subpopulation structure known as the Wahlund effect have been suggest as the possible reasons of positive deviation from HWE [18]. Although high positive FIS values have been commonly observed in marine invertebrates, in many cases, the reasoning for this is unknown [19]. In a literature survey of FIS values of marine invertebrates, the mean FIS values for marine invertebrates with planktonic larval dispersal and non-dispersing larval development were 0.149 and 0.235, respectively [18]. Sea cucumbers reproduce by releasing sperm and eggs; thus, the possibility of assortative mating seems unlikely. Null alleles observed in the microsatellite loci could be a more plausible reason for the deviation. In our study, null alleles were observed 7 of 9 loci and no significant deviation from HWE value was observed in the Psj2463 and Psj3072 loci which do not have any null allele.
The fixation index (FST) in Table 2 also showed clear differences between the green and red types, but no difference was detected among red types. Among the green types, the G-GJ population from Korea and the G-YS and G-GN populations from China showed significant differences among the compared groups. The FST value reflects the genetic diversity attributable to allele frequency differences among populations [20], as can be seen in Fig. 3. Although some loci such as Psj2575 showed similar allele frequencies in both green and red type populations, overall, the allele frequencies differed greatly between the two color types. This difference was further confirmed in the analysis using the GeneClass software (ver. 2.0.) which showed that it was possible to discriminate the two color types with 100% accuracy with the quality index of 99.97%.
Factors such as habitat preferences and spawning season have also been suggested as possible reasons for the reproductive isolation and limited gene flow of the red type [3]. The red and green types occupy different habitats; i.e., offshore gravel beds and inshore sandy-muddy bottoms, respectively [21]. In Korea, the red type is caught from a restricted deep sea area off of Ulleungdo, Dokdo as well as the Jejudo area which are islands separated from the mainland. The geographical separation of these two color variants may result in allele frequency differences. Geographical barriers can affect genetic structure and speciation, even in terrestrial animals. A study of anoles reported little genetic differentiation between populations or individuals with different dewlap colors, but that a small amount of genetic structuring had occurred due to geographical barriers [22]. In addition to spatial separation, temporal separation caused by differences in spawning seasons of green and red variants can result in reproductive separation and thereby allele differentiation among these two groups [3].
In addition to analyses of isozyme loci [5] and microsatellite makers [7], differences among the red and green color variants of S. japonicus have been detected using single nucleotide polymorphism (SNP) analysis [23]. Six SNP markers from the sea cucumber HSP70 gene were clear difference between green and red variants.
Maintenance of genetic diversity in hatchery-produced populations has been reported for other marine organisms. For example, no difference in genetic diversity between natural and hatchery populations of Pacific oysters in Japan and Australia [24] and of Pacific Threadfin in Hawaii [25]. Additionally, no differences in the mean allele richness or heterozygosity were detected between hatchery and wild populations of Pacific oyster in China [26]. For both oysters and sea cucumbers, hundreds of parental males and females from different farms are used for spawning, which contributes to the maintenance of genetic diversity in these animals. In contrast, a marked reduction in genetic variability was observed when microsatellite markers were analyzed for the hatchery stocks and the counterpart natural population of pacific abalone [27, 28], Atlantic salmon [29], and flounder [30]. This reduced variability is likely due to the limited numbers of effective partners used for reproduction.
Factors such as the successful amplification of microsatellite makers from the red type S. japonicus using those originated from the green type and the absence of any fixed locus for genetic diversity indicate that the separation of the red type occurred relatively recently on an evolutionary time scale. Our results together with others obtained using alloenzyme [5], microsatellite markers [7] and SNP markers [21] suggest that the red and green variants are reproductively isolated. Specifically, differences in the frequencies of alleles between the red and green types provide evidence that they are reproductively separated. Analyses of genetic structure and diversity are critical for the establishment of suitable guidelines for resource management and selective breeding. The information obtained in this study will be useful for these purposes such as development of diagnostic kits for the discrimination of red and green type before seed release for restoration.
Acknowledgements
This work was supported by grants from the National Fisheries Research and Development Institute (NFRDI) in Korea (RP-2011-BT-012).
Conflict of Interests
The authors have declared that they have no conflict of interest.
References
1. Ramofafia C, Byrne M, Battaglene SC. Development of three commercial sea cucumbers, Holothuria scabra, H. fuscogilva and Actinopyga mauritiana: larval structure and growth. Marine and freshwater research. 2003;54(5):657-667
2. Chen L, Li Q, Yang J. Microsatellite genetic variation in wild and hatchery populations of the sea cucumber (Apostichopus japonicus selenka) from northern China. Aquaculture Research. 2008;39:1541-1549
3. Choe S, Ohshima Y. On the morphological and ecological differences between two commercial forms, “Green” and “Red”, of the Japan common sea cucumber, Stichopus japonicus Selenka. Bulletin of the Japanese Society of Scientific Fisheries. 1961;27:97-106
4. Kanno M, Kijima A. High genetic variability of isozymes in Japanese sea cucumber Stichopus japonicus. Fish Genet Breed Sci. 2002;3:7-12
5. Kanno M, Kijima A. Genetic differentiation among three color variants of Japanese sea cucumber Stichopus japonicus. Fish Sci. 2003;694:806-812
6. Kanno M, Li Q, Kijima A. Isolation and characterization of twenty microsatellite loci in Japanese sea cucumber (Stichopus japonicus). Mar Biotechnol. 2005;7(3):179-183
7. Kanno M, Suyama Y, Li Q, Kijima A. Microsatellite analysis of Japanese sea cucumber, Stichopus (Apostichopus) japonicus, supports reproductive isolation in color variants. Mar Biotechnol. 2006;8(6):672-685
8. Kim MJ, Choi TJ, An HS. Population genetic structure of sea cucumber, Stichopus japonicus in Korea using microsatellite markers. Aquaculture Research. 2008;39:1038-1045
9. Marshall TC, Slate J, Kruuk LEB, Pemberton JM. Statistical confidence for likelihood-based paternity inference in natural population. Molecular Ecology. 1998;7:639-655
10. Raymond M, Rousset F. GENEPOP (version 1.2): population genetics software for exact tests and exumenicism. J Hered. 1995;86:248-249
11. Rice WR. Analyzing tables of statistical tests. Evloution. 1989;43:223-225
12. Van Oosterhout C, Hutchinson WF, Wills DPM, Shipley P. MICRO-CHECKER: software for identifying and correcting genotyping errors in microsatellite data. Molecular Ecology Notes. 2004;4:535-538
13. Goudet J. FSTAT, a program to estimate and test gene diversities and fixation indices (Version 2.9.3). http://www.unil.ch/izea/software/fstat.html
14. Weir BD, Cockerham CC. Estimationg F-statistics for the analysis of population structure. Evolution. 1984;38:1358-1370
15. Felsenstein J. PHYLIP- phylogeny inference package (version 3.2). Cladistics. 1989;5:164-166
16. Piry S, Alapetite A, Cornuet JM, Paetkau D, Baudouin L, Estoup A. GeneClass2: a software for genetic assignment and first-generation migrant detection. J Hered. 2004;95:536-539
17. FAO. Sea cucumber (Stichopus japonicus) culture in China; In Training manual on breeding and culture of scallop and sea cucumber in China. FAO. 1991
18. Bohonak AJ. Dispersal, gene flow, and population structure. Q Rev Biol. 1999;74(1):21-45
19. Addison JA, Hart MW. Spawning, copulation and inbreeding coefficients in marine invertebrates. Biol Lett. 2005;1:450-453
20. Holsinger KE, Wei BS. Genetics in geographically structured populations: defining, estimating and interpreting FST. Nat Rev Genet. 2009;10(9):639-650
21. Nishimura S. Guide to seashore animals of Japan with color pictures and keys; Vol 2. Osaka: Hoikusha. 1995
22. Stapley J, Wordley C, Slate J. No evidence of genetic differentiation between anoles with different dewlap color patterns. J Hered. 2011;102(1):118-124
23. Kang JH, Yu KW, Park JY, An CM, Jun JC, Lee SJ. Allele-specific PCR genotyping of the HSP70 gene polymorphism discriminating the green and red color variants sea cucumber (Stichopus japonicus). J. Fish Biology. 2011 to appear
24. English LJ, Maguire GB, Ward RD. Genetic variation of wild and hatchery populations of the pacific oyster, Crassostrea gigas (Thunberg) in Australia. Aquaculture. 2000;187:283-298
25. Pan G, Yang J. Analysis of microsatellite DNA markers reveals no genetic differentiation between wild and hatchery populations of Pacific Threadfin in Hawaii. Int J Biol Sci. 2010;6(7):827-833
26. Yu H, Li Q. Genetic variation of wild and hatchery populations of the Pacific oyster Crassostrea gigas assessed by microsatellite markers. Journal of Genetics and Genomics. 2007;34(12):1114-1122
27. Hara M, Sekino M. Genetic differences between hatchery stocks and natural populations in Pacific Abalone (Haliotis discus) estimated using microsatellite DNA markers. Marine Biotechnology. 2007;9:74-81
28. Li Q, Park C, Endo T, Kijima A. Loss of genetic variation at microsatellite loci in hatchery stocks of the Pacific abalone (Haliotis discus). Aquaculture. 2004;235:207-222
29. Norris AT, Bradley DG, Cunningham EP. Microsatellite genetic variation between and within farmed and wild Atlantic salmon (Salmon salar) populations. Aquaculture. 1999;180:247-264
30. Sekino M, Hara M, Taniguchi N. Loss of microsatellite and mitochondrial DNA variation in hatchery strains of Japanese flounder Paralichthys olivaceus. Aquaculture. 2002;213:101-112
Author contact
![]() Corresponding author: Sang-Kyu Kim, Biotechnology Research Department, National Fisheries Research and Development Institute, Busan 619-705, Korea. E-mail: kjh0124go.kr
Corresponding author: Sang-Kyu Kim, Biotechnology Research Department, National Fisheries Research and Development Institute, Busan 619-705, Korea. E-mail: kjh0124go.kr