Impact Factor ISSN: 1449-2288

 Global reach, higher impact
Int J Biol Sci 2011; 7(6):700-707. doi:10.7150/ijbs.7.700 This issue Cite
Research Paper
Modeling the Effects of a Simple Immune System and Immunodeficiency on the Dynamics of Conjointly Growing Tumor and Normal Cells
Mitra Shojania Feizabadi1 ![]() , Tarynn M. Witten2
, Tarynn M. Witten2
1. Physics Department, Seton Hall University, South Orange, NJ 07079, USA
2. Center for the Study of Biological Complexity, PO Box 842030, Virginia Commonwealth University, Richmond, VA 23284-2030, USA
Received 2011-2-21; Accepted 2011-5-24; Published 2011-6-1
Abstract
In this paper, we develop a theoretical contribution towards the understanding of the complex behavior of conjoint tumor-normal cell growth under the influence of immuno-chemotheraputic agents under simple immune system response. In particular, we consider a core model for the interaction of tumor cells with the surrounding normal cells. We then add the effects of a simple immune system, and both immune-suppression factors and immuno-chemotherapeutic agents as well. Through a series of numerical simulations, we illustrate that the interdependency of tumor-normal cells, together with choice of drug and the nature of the immunodeficiency, leads to a variety of interesting patterns in the evolution of both the tumor and the normal cell populations.
Keywords: Aging, tumor cell dynamics, normal cell dynamics, tumor-normal cell interactions, chemotherapy, Immune system, Immunotherapy, Immunodeficiency
Introduction
Every day, clinical and experimental studies provide evidence of new features that can influence cancer dynamics and its treatment methodologies [1-4]. Ongoing research efforts aim to provide a clearer picture of the evolution of the tumor and normal cells with the objective of improving cancer treatment protocols.
During cancer progression, tumor cells interact with the surrounding environmental components such as normal cells, immune cells or therapeutic agents that have been externally added to the system. The nature of the tumor-environment interaction is complex and depends upon many factors such as host age, sex, and many more. They are all key factors that can lead to complex patterns of tumor cell evolution.
Considering the tumor-environment interaction, it has already been demonstrated that the growth of normal and tumor cells are co-dependent due to their biochemical and biomechanical interactions [5-12]. Additionally, researchers have experimentally explored the interaction of tumor cells with the host immune system and the suppressive effects of the immune cells in tumor progression [13-18]. Experimental evidence demonstrates that there is an alteration of the level of immune components during the various stages of cancer growth. This underlines the key role of the immune system in cancer dynamics [1, 19]. Understanding the intrinsic growth of tumor cells, together with the interaction with their surroundings, has led to several single and multi-therapeutic strategies to modulate and control the growth of these cells.
We can, however, examine the evolution of tumor and normal cells and complexity of the system through the use of computational and mathematical modeling and simulation. For example, the interaction of tumor cells with surrounding normal cells was first mathematically introduced by Witten [20-23]. The interaction of immune system and different therapeutic agents with tumor cells has been theoretically modeled and studied by several research groups [24-30].
In this paper, we make use of Witten's [23] core tumor-normal cell model. However, we modify it as follows. First, we model the interaction of the immune system with the conjointly growing tumor-normal cells. Then, we assume a deficiency in the immune system due to the presence of immune-suppressing factors such as viruses. Additionally, we add a different therapeutic approach to this modified model. We then investigate the evolution of normal and tumor cells through a series of computational simulations. Finally, we offer subsequent biological interpretations of the simulation results.
Building the Mathematical Model
Introducing the Conjoint Core Model
In the core model, both the normal and tumor cells independently increase according to a logistic growth law (other types of independent growth model may be used). The interaction of tumor with normal and normal with tumor cells is described by the second term in the model where the normal cells are denoted by N and the tumor cells are denoted by T. Thus, the original core model [20-23] expresses one possible dynamics for the interplay of normal and tumor cells and it is given by the following system of equations:
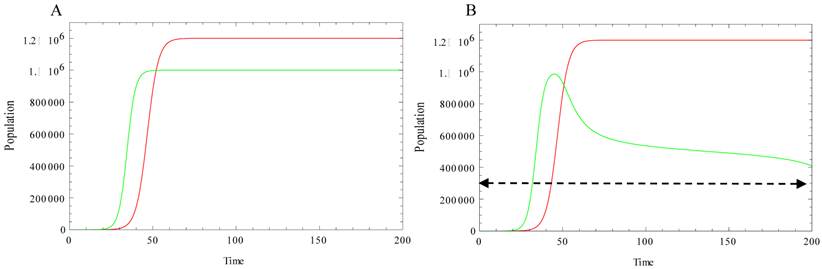
where T, N, KT, KN, rT, rN are the total number of tumor cells, the total number of normal cells, the carrying capacity of the tumor cells, the carrying capacity for the normal cells, and the per capita growth rate for the tumor and normal cells respectively and κ is the tumor-normal cell coupling constant. The second terms in each equation represent the normal-tumor/tumor-normal cell interactions. Here, β has the units of 1/time (where time is measured in arbitrary units depending upon the timescale of interest in the problem) and ρ0 is measured in units of cells. T* is the critical number of tumor cells and as T exceeds the critical size T*, the tumor cells increase their ability to inhibit normal cell growth. This behavior is illustrated in Figure 1. Figure 1A, shows the independent growth of the normal and tumor cells (no interactions). However, in the conjoint growth illustrated in Figure 1 B, we can see the dependency between the cell populations. As the size of the tumor cell population, T, exceed the critical size, T*, the size of the normal cell population, N, begins to decrease.
Green curve: Evolution of normal cell population. Red curve: Evolution of tumor cells. Simulation parameters: r N=0.4, r T =0.3, K T=1.2. 106, K N=106. A: There is no interaction between normal cells and tumor cells (both populations undergo logistic growth), κ=0, β=0. B: Normal and tumor cells are allowed to interact with each other, κ =0.028, β =1, ρ0=1, ρ1=1000, T*=3.105, N0=1, T0=1. As the size of the tumor cells T exceed the critical size, T* (dashed line), the size of normal cells N starts decreasing.
Immune-Tumor interaction
Panetta & Kirschner mathematically modeled the interaction of tumor cells with the immune system and immune-therapeutic agents [31, 32]. This model, which has been used in other studies [33, 34], explained clearly the equilibrium of the tumor-immune system as well as the oscillatory behavior of the tumor size around the equilibrium. In this paper, we add the concepts of the interaction of the immune system established by Panetta and Kirschner to our conjoint growth model. As explained in Kirschner's model, two variables are considered to be the main immune system components: the first is activated immune-system cells (effector cells) including T cells and other immune cells that are cytotoxic to tumor cells. E(t) represents the effector cells in the modified model equations below. The second immune system component is the concentration of IL-2, which is the main cytokine responsible for T cells activation, growth and differentiation at the tumor site. This variable is expressed by I(t).
The loss of tumor cells, due to the immune-effector cells can be characterized with a Michaelis-Menten interaction term, aET/(g2 + T). Here, 'a' is the rate of clearance of tumor cells as a result of these two populations and g2 is the half-saturation for cancer clearance. Also, the activation happens because of the presence of IL-2 hormones and is given by the term p1EI/(g1+ I). This is also a Michaelis-Menten term. Here p1 is the proliferation rate of immune cells and g1 is the half-saturation for the proliferation term. To express the natural death of effector cells, the term -µ3E is added. In this term µ2 is the death rate of the immune cells. The change in concentration of IL-2 is expressed as: p2TE/(g3 + T), which is the activation due to the presence of the tumor. In this term, p2 is the production rate of the effector molecules and g3 is the half-saturation of production. Finally, -µ2I, is the natural loss of IL-2 by the rate of µ2.
Adding Chemo/Immuno-Therapy to the Immune-Tumor Interaction
Many factors can be considered to be immune suppression factors, including immune-suppression viruses. These viruses can infect the activated immune cells. As a result of this infection, the population of activated cells decreases and this leads to a weakened immune system. In such a case, the treatment can consist of immune boosting drugs such as Interleukin-2 (IL-2) [35]. Kirschner [36, 37] mathematically characterized the general interaction of the Human Immunodeficiency Virus and activated immune cells. The presence of immune suppression factors reduces the efficiency of the immune system in battling tumor cells. These same mathematical terms are, thus, added to our model to explain a simple possible immune deficiency [35]. Similar to the approach of Kirshner, the production source of virus, V(t), can be introduced as ηV/(b+V) where η is the production rate and b is the saturated term. -µ1V expresses the natural death of viruses at rate of µ1. The interaction between effector cells and viruses can reduce the size of both populations with different rates. This is expressed as: - αVE and -γVE to illustrate the interaction between virus and effector cells. As a result of this interaction, the immune effector cells decrease the population of viruses at rate α. Additionally, viruses infect some of the effector cells and, therefore, the population of uninfected effector cells decreases at the rate γ.
Treatment Characterizations
To control cancer progression, many approaches can be implemented, among them chemotherapy, immunotherapy or some combination of the two. The enhancement of the immune system by immuno-therapeutic agents that directly boost the number of T cells has a key role in the reduction of both the number of tumor cells and viruses. Chemotherapeutic agents can kill the tumor population in a dose-dependent manner [38, 29]. Feizabadi and Witten [28] have investigated the effect of the chemotherapeutic agents on a conjoint system of tumor and normal cells. However, chemotherapeutic agents are cytotoxic not only to tumor cells, but also to normal and activated cells as well. Clinical evidence also indicates that some of the anticancer agents can control the replication of viruses in a dose-dependent manner. Some data supports and some discourage the use of anticancer agents for immuno-deficient virus treatment. On the one hand, some drugs have strong anti-activity virus effects, but not the ability to kill rapidly proliferating tumor cells. On the other hand, some of the anti-proliferating drugs may not have a positive effect on controlling viruses [39]. Consequently, it is obvious that therapeutic potential depends upon the impact and the cross-toxicity of the drug on different components of the system. Knowledge of these pharmacokinetic interactions can improve the future architecture of both drugs and treatment strategies.
Gardner [40], first suggested the general term aφ(1-e- ξ•MC)φ for φ = T, N, E as a means of describing as drug interaction term. In our model, we have considered cellular interaction with chemotherapeutic agents and we have allowed them to have some degree of toxicity to T, N, and E cells. Additionally, the immunotherapeutic agent is described by the term aEE(1-e ξ•MI) and it acts as an immune-boosting agent. In the interaction terms, the constants MC and MI represent the chemotherapy and immunotherapy drug concentrations and ξ is linked to the drug pharmacokinetics and is assumed to have the value ξ = 1 in this preliminary study [28, 29].
ODE Model: Mathematical Construction of the Modified Model
Combining all of the aforementioned interaction terms, the evolution of the full system can be expressed as follows:
The evolution of the above full system is discussed in the following sections.
Model Simulation
Simulation of the compartmental evolution was carried out using Mathematica V7.0. Our choice of parameters is based on values previously introduced or obtained from references in the literature. The citation for each parameter along with the associated parameter values is given in Table 1. However, given the generality of the model, alternate parameter values may also be implemented allowing the user to further investigate the kinetics of the various system components.
Simulation Parameters
| Parameter | Units | Description | Estimated Value | Reference Source |
|---|---|---|---|---|
| rT | Time-1 | Growth rate for the tumor cells | 0.3 | [28] |
| KT | Cells | Carrying capacity of tumor cells | 1.2*106 | [28] |
| β | Time-1 | Normal-tumor cell interaction rate | 01 | [28] |
| ρ0 | Cells | Interaction clearance term | 1 | [28] |
| ρ1 | Cells | Half-saturation for interaction | 1000 | [28] |
| a | Time-1 | Cancer clearance term | 1 | [31] |
| g2 | Cells | Half-saturation for cancer clearance | 105 | [31] |
| rN | Time-1 | Growth rate for the normal cells | 0.4 | [28] |
| KN | Cells | Carrying capacity of normal cells | 106 | [28] |
| κ | Time-1 | Tumor-normal cell interaction rate | 0-0.028 | [28] |
| T* | Cells | Critical size of tumor | 3*105 | [28] |
| c | Time-1 | Antigenicity | 0.005 | [31] |
| µ2 | Time-1 | Death rate of immune cells | 0.03 | [31] |
| p1 | Time-1 | Proliferation rate of immune cells | 0.1245 | [31] |
| g1 | Cells | Half-saturation proliferation term | 2*107 | [31] |
| p2 | Time-1 | Production rate of effector molecules | 5 | [31] |
| g3 | Cells | Half-saturation of production | 30 | [31] |
| µ3 | Time-1 | Half-life of effector molecules | 10 | [31] |
| µ1 | Time-1 | Death rate of viruses | 0.03 | - |
| b | Viruses | Half-saturation of virus population | 5 | - |
| α | Time-1 | Effector cell-virus interaction rate | 2.5*10-4 | - |
| η | Time-1 | Production rate of viruses | 3*104 | - |
| γ | Time-1 | Virus-effector cell interaction rate | 0.005 | - |
| ζ | Concentration-1 | Pharmacokinetic parameter | 1 | [29] |
The behavior of tumor, normal, effector cells and IL-2 concentration in a conjoint model is studied using different simulation assumptions. In Figure 2, the behavior of the components of the system is illustrated for the case where the system of tumor-normal cells interacts with the host immune system components.
A: Evolution of Tumor cells. B: Evolution of normal cells. C: Evolution of effector cells. D: Evolution of IL-2 Concentration. The common parameters are the same amount as Figure 1. The new parameters are: a=1, g2=105, c=0.005, µ2=0.03, p1=0.1245, g1=2*107, p2=5, g3=30, µ3=10. In this figure, Red curve represents the interaction with the immune system. The Black curve represents the interaction of the system with just chemotherapeutic agents when aT[1-exp(-MC)]=0.05, and aN[1-exp(-MC))=aE[1-exp(-MC)]=0.01. The Orange curve represents the interaction with the chemotherapeutic agent when the killing effect of the chemotherapeutic agents on effector and normal cells is minimum. In this case, aT[1-exp(-MC)]=0.05 and aN[1-exp(-MC)]=aE[1-exp(-MC)]=0.001. The Blue curve represents the interaction of the system with the chemotherapeutic agents with the same parameters as the orange graph and the immune boosting agents where aEE[1-exp(-MI)]=0.002. The Green curve represents the same case as the blue case with higher dosage of the immune boosting drugs, aEE[1-exp(-MI)]=0.004. As explained in the text, the most effective therapy is the case associated to the implementation of the chemotherapeutic agents that majorly kill tumor cells together with effector cells boosting drugs. Some oscillatory behavior can be seen though around the equilibrium when both agents are implemented before reaching the final equilibrium.
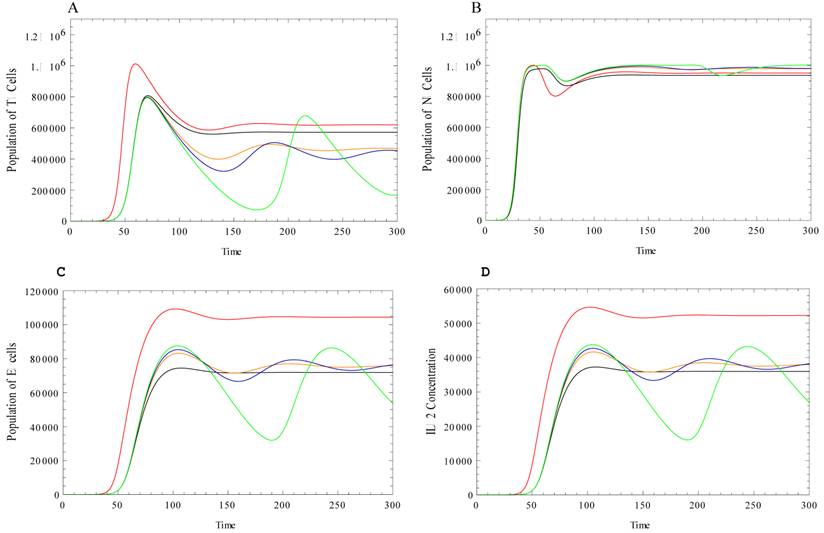
As the system of tumor and normal cells interacts with the immune cells, the amount of effector cells and the concentration of IL-2 are increased due to the presence of the tumor cells, Figure 2C and 2D. As a result of the cancer clearance effect of the effector cells, the population of the tumor cells decreases and the population of the normal cells increases as compared with the dynamics illustrated in Figures 2A, 2B. Chemotherapeutic agents are introduced into the system of tumor-normal cells that are already interacting with the immune system and the evolution of the system components changes. We first consider the case in which the chemotherapeutic agent kills tumor cells. These agents are also assumed to kill normal and immune cells due to their toxicity. However, it is assumed that the killing rate of the chemotherapeutic agent is higher for the tumor cells than for the normal and the effector cells. Therefore, we observe a slight decrease in the size of the tumor cell population. As the size of the tumor cell population decreases, the population of the effector cells and the IL-2 levels decrease as well. The Figure 2 black curves illustrate the chemotherapeutic interaction.
Ideal chemotherapeutic agents (Orange curves in Figure 2) are agents that are capable of killing significant numbers of tumor cells with very minimal effects on the normal and the effector cell populations. In this case, the shrinkage of tumor cells is significant. The population of the tumor cells decreases and both the tumor cells and normal cells experience oscillations around their equilibrium during the chemotherapeutic interaction. If we then add additional immunotherapeutic agents, the final population of tumor cells decreases significantly. However, the interaction of the tumor cell population with immuno-chemotherapeutic agents exhibits an increased amplitude of the oscillation before reaching a steady state behavior (Blue and Green curves in Figure 2).
This shrinkage is combined by an oscillatory behavior with small amplitude in oscillation. The system expresses a better response in terms of a reduction in the size of the tumor cells, when in the presence of chemotherapeutic agents, and the immunotherapy is added. In the current case, the final size of the tumor cell populations is significantly smaller. However, the more effective immunotherapeutic agents cause oscillations with larger amplitude before reaching to a steady state behavior.
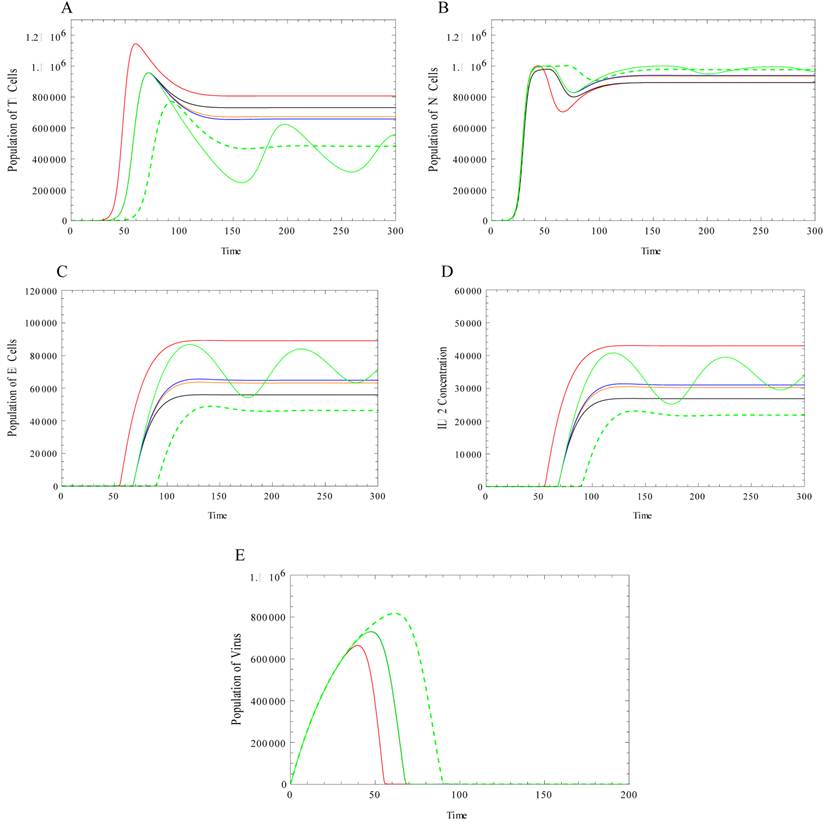
In our final case, we consider the scenario in which the immune system has reduced effectiveness. In this particular case, we assume that the reduction is due to a viral load. Due to the existence of an immune-suppressant, the population of the effector cells at the steady state decreases (Figure 3D) and, subsequently, the population of the tumor cells increases (Figure 3A). Also, in the immune-deficient system, the growth of the effector cells demonstrates a delayed onset as compared to the system with no deficiency. Additionally, we observe that the growth of effector cells is slower in the presence of this deficiency. In the absence of any immune deficiency, we simulated the behavior of the tumor cells under an immune-chemotherapeutic agent. As discussed above, under the effect of the immuno-chemotherapeutic drugs, the population of effector cells decreases, while there is an oscillatory behavior before reaching the steady state. In the presence of an immune system deficiency, in order to reach a nearly equivalent steady state after therapy, we first used the same amount of chemotherapy and increased the immunotherapeutic agent. We observe that a much larger amount of this same agent is needed in order for the system to approach the same steady state (Figure 3-Green). Alternatively, in order to reach the same steady state, in the presence of any limitation in the dosage of the immuno-therapeutic agent, one can slightly increase the amount of immuno-therapeutic agent together with a simultaneous increase in the amount chemotherapeutic agent (Figure 3, Dashed-Green).
In this figure the system behavior under the influence of immunodeficiency viruses is investigated. A: Evolution of Tumor cells. B: Evolution of normal cells. C: Evolution of effector cells. D: Evolution of IL-2 Concentration. E: Evolution of Virus. Same common parameters are implemented as before. The specific parameters are η=3*104, b=5, γ=0.005, α=2.5*10-4, µ1 =0.03. The Red curve represents the behavior of the components in the presence of the virus. Black: General chemotherapy is then introduced and then improved to the chemotherapeutic agents with major killing effects on tumor cells. Blue: the effector boosting drugs is added. Green: the dosage of the immune boosting drugs is significantly increases aEE[1-exp(-MI)]=0.02 to almost reach to the equilibrium of the system in the absence of any viruses. In dashed-Green line, instead of significantly increasing the dosage of immune boosting drugs to reach to the equilibrium discussed in Figure 2, both chemotherapeutic and immunotherapeutic drugs was increased, aEE[1-exp(-MI)]=0.01, aT[1-exp(-MC)]=0.05.
Closing Remarks
In this work, we modified Witten's [23] conjoint normal-tumor cell model in order to incorporate the presence of a simple immune system. The evolution of the system variables was investigated via computer simulation. Various cases were considered. We first considered the effect of a chemotherapeutic agent on the system. We investigated different therapeutic approaches to control the size of the tumor cell population. We then considered the possibility of the existence of a virally induced deficiency in the immune system function. In this scenario, the deficiency directly affected the behavior of tumor and normal cells as well as the immune system components. Among the possibilities, chemotherapeutic together with immunotherapeutic agents demonstrated the best outcome in terms of reducing the size of the tumor in the absence of any deficiency. In the presence of immune deficiency factors, even the most successful therapeutic agents needed to be re-evaluated to obtain similar outcomes in terms of the reduction in size of the tumor cells, as compared to a properly functioning immune system in the absence of any deficiency. Simulations demonstrated that either the level of immunotherapeutic agents should significantly increase or the level of chemotherapeutic together with immunotherapeutic agents should increase. This increase may control the size of the tumor cell population, but the toxicity of chemotherapy reduces the immune system and the ability to battle the virus, which may subsequently lead to death as a result of infection.
In an attempt to control the size of the tumor cell population, through different therapeutic protocols, it is necessary to first evaluate any factors, which may suppress the functionality of the immune system. Second, the nature of the therapeutic agents and the way that they interact with normal, tumor, immune cells and immunodeficiency factors needs to be investigated prior to implementation. In short, more information regarding the intrinsic interaction among different types of cells together with the interaction of each group of cells and externally added agents can lead to selecting a better treatment approach and reaching a better outcome in the reduction and control of the cancer.
Acknowledgements
M.S. Feizabadi acknowledges the support of the Seton Hall University Research Council.
Conflict of Interests
The authors have declared that no conflict of interest exists.
References
1. Richmond T Prehn, Lisa M Prehn. Cancer Immunotherapy by Immunosuppression. Theoretical Biology and Medical Modeling. 2010;7:45
2. Prehn RT. The initial immune reaction to a new tumor antigen is always stimulatory and probably necessary for the tumor's growth. Clin. Dev Immunol. 2010;2010:851728
3. D'Onofrio A, Gatti F, Cerrai P & Freschi L. Delay-induced oscillatory dynamics of tumor-immune system interaction. Math and Computer Model. 2010;51:572- 591
4. Carpenter AC & Bosselut R. Decision checkpoints in the thymus. Nature Immunology. 2010;11(8):666-673
5. Ludford RJ, Barlow H. Sarcomatous transformation of the stroma of mammary carcinomas that stimulated fibroblastic growth in vitro. Cancer Research. 1943;5:257-264
6. Ludford RJ, Barlow H. The influence of malignant cells upon the growth of fibroblasts in vitro. Cancer Research. 1994;8:694-703
7. Kasuta H, Takaota T, Nagai Y. Interaction in culture between normal and tumor cells of rats. In: (ed.) Kasuta H. Cancer Cells In Culture. Tokyo, Japan: University of Tokyo Press. 1968
8. Ranadive KJ, Bhide SV. Tissue interactions in normal and malignant cells. Boston, MA: Little, Brown & Company. 1962
9. Foley JF, Kennedy BJ, Ross JD. A factor from HeLa cells promoting colonial growth of human fibroblast-like cells in culture. Cancer Research. 1963;23:368- 371
10. Smith AG, Cress HR. Effect of tumor deoxyribonucleic acid upon tissue cultures of fibroblasts. Lab Invest. 1951;10:898-907
11. Hymes WF, Gilbert JB, Mengoli HF, Watne AL. Inhibition of migration of rat peritoneal exudate cells by Ascites tumor fluid fractions. Nature. 1967;213:108- 110
12. Rounds DE. A growth modifying factor from cell lines of human malignant origin. Cancer Res. 1970;30:2847-2851
13. O'Byrne KJ, Dalgleish AG, Browning MJ, Steward WP, Harris AL. The relationship between angiogenesis and the immune response in carcinogenesis and the progression of malignant disease. Eur. J. Cancer. 2000;36:151-169
14. Farrar JD, Katz KH, Windsor J, Thrush G, Scheuermann RH, Uhr JW, Street NE. Cancer dormancy. VII. A regulatory role for CD8+ T cells and IFN-gamma in establishing and maintaining the tumor-dormant state. J Immunol. 1999;162(5):2842-2849
15. Muller M, Gounari F, Prifti S, Hacker HJ, Schirrmacher V, Khazaie K. EblacZ tumor dormancy in bone marrow and lymph nodes: active control of proliferating tumor cells by CD8+ immune T cells. Cancer Res. 1998;58(23):5439-5446
16. Prehn RT, Prehn LM. The flip side of immune surveillance: immune dependency. Immunol Revs. 2008;222:341-356
17. Prehn RT. The immune reaction as a stimulator of tumor growth. Science. 1972;176:170-171
18. Fleisher MS, Loeb L. Immune reactions against tumor growth in animals with spontaneous tumors. J Med Res. 1996;34:1-19
19. Mazzoccoli G. et al. Stage dependent destructuration of neuro-endocrine-immune system components in lung cancer patients. Biomedicine & Pharmacotherapy. 2010 doi:10.1016/j.biopha.2010.12.006
20. Witten TM. Modeling cellular aging and tumorigenic transformation. Math and Computers in Simulation. 1982;24:572-584
21. Witten TM. Population models of cellular aging: Theoretical and numerical issues. In: (ed.) Vichnevetsky R, Stepleman RS. Advances in Computer Methods for Partial Differential Equations VI. New Jersey: IMACS, Rutgers University. 1987
22. Witten TM. A mathematical model for the effects of a lymphokine-like ring shaped particle on the dynamics of a conjoint tumor-normal cell culture: Some implications for the aging cancer question. In: (ed.) DiLisi JC. Mathematics and Computers in Biomedical Applications. New York: Elsevier North-Holland. 1985
23. Witten TM. Modeling the dynamics of conjoint tumor-normal cell culture systems: II. Further thoughts on the aging-cancer question. In: (ed.) Eisenfeld J, Witten TM. Modeling Of Biomedical Systems. Amsterdam: North-Holland. 1986
24. Bajzer B, Carr T, Josic K, Russell SJ, Dingli D. Modeling of cancer virotherapy with recombinant measles viruses. J Theor. Biol. 2008;252:109-122
25. Dingli D, Cascino MD, Josic K, Russell SJ, Bajzer Z. Mathematical modeling of cancer radiovirotherapy. Mathematical Biosciences. 2006;199:80-103
26. Feizabadi MS, Volk C, Hirschbeck S. A two-compartment model interacting with dynamic drugs. Appl Math Lett. 2009;22:1205-1209
27. Feizabadi MS, Carbonara J. Two-compartment model interacting with proliferating regulatory factor. Appl Math Lett. 2010;23:30-33
28. Feizabadi MS, Witten TM. Chemotherapy in cojoint aging-tumor systems: some simple models for addressing coupled aging-cancer dynamics. Theor Biol and Med Model. 2010;7:21
29. de Pillis LG, Radunskaya A. The dynamics of an optimally controlled tumor model: A case study. Mathematical and Computer Modeling. 2003;37:1221-1244
30. Cattani C, Ciancio A, d'Onofrio A. Metamodeling the learning-hiding competition between tumors and the immune system: a kinematic approach. Math Comput Modelling. 2010;52:62-69
31. Kirschner D, Panetta JC. Modeling immunotherapy of the tumor-immune interaction. J. Math Biol. 1998;37(3):235-252
32. Kirschner D, Tsygvintsev A. On the global dynamics of a model for tumor immunotherapy. Math Biosci and Engineering. 2009;6(3):573-583
33. de Pillis LG, Gu W, Radunskaya AE. Mixed immunotherapy and chemotherapy of tumors: modeling, applications and biological interpretations. J. Theor Biol. 2006;238:841-862
34. Caravagnaetal G, d'Onofrio A, Milazzo P, Barbuti R. Tumor suppression by immune system through stochastic oscillations. J. Theor Biol. 2010;265:336-345
35. Kovacs JA, Vogel S, Albert JM. et al. Controlled trial of IL-2 infusions in patients infected with HIV. New Eng J Med. 1996;335:1350-1356
36. Kirschner D, Webb GF. Immunotherapy of HIV-1 Infection. Journal of Biological System. 1998;6(1):71-83
37. Kirschner D, Webb GF. A mathematical model of combined drug therapy of HIV infection. J Theor Med. 1998;1:25-34
38. Pazdur R, Hoskins W, Wagman L, Coia L. Cancer Management: A Multidisciplinary Approach; Chapter: Principles of Chemotherapy, eighth ed. US: Oncology Publishing Group of CMP Healthcare Media. 2004
39. Sadaie MR, Mayner R, Doniger J. A novel approach to develop anti-HIV drugs: adapting non-nucleoside anticancer chemotherapeutics. Antivirial Research. 2004;61:1-18
40. Gardner SN. A mechanistic, predictive model of dose-response curves for cell cycle phase-specific and nonspecific drugs. Cancer Res. 2000;60:1417-1425
Author contact
![]() Corresponding author: Mitra Shojania Feizabadi, Physics Department, Seton Hall University, 400 South Orange Ave, South Orange, NJ 07079, Phone: 973-761-9403, Email: shojanmiedu
Corresponding author: Mitra Shojania Feizabadi, Physics Department, Seton Hall University, 400 South Orange Ave, South Orange, NJ 07079, Phone: 973-761-9403, Email: shojanmiedu