Impact Factor ISSN: 1449-2288

 Global reach, higher impact
Int J Biol Sci 2012; 8(1):66-78. doi:10.7150/ijbs.8.66 This issue Cite
Research Paper
Proteomic Analysis on Acetate Metabolism in Citrobacter sp. BL-4
Young-Man Kim1*, Sung-Eun Lee2*, Byeoung-Soo Park2, Mi-Kyung Son2, Young-Mi Jung3, Seung-Ok Yang4, Hyung-Kyoon Choi4, Sung-Ho Hur5, Jong Hwa Yum6 ![]()
1. Department of Food Science and Nutrition, Dong-eui University, Busan 614-714, Republic of Korea
2. Research Station, Nanotoxtech Inc., Gyeonggi Technopark Technology Development Center, Ansan 426-901, Republic of Korea
3. Department of Genetic Engineering, School of Life Sciences and Biotechnology, Kyungpook National University, Daegu 702-701, Korea
4. College of Pharmacy, Chung-Ang University, Seoul 156-756, Republic of Korea
5. Department of Clinical Laboratory Science, Dong-eui Institute of Technology University, Busan, 614-715, Korea
6. Department of Clinical Laboratory Science, Dong-eui University, Busan 614-714, Republic of Korea
* The same contribution to the paper.
Received 2011-8-3; Accepted 2011-10-26; Published 2011-11-23
Abstract
Mass production of glucosamine (GlcN) using microbial cells is a worthy approach to increase added values and keep safety problems in GlcN production process. Prior to set up a microbial cellular platform, this study was to assess acetate metabolism in Citrobacter sp. BL-4 (BL-4) which has produced a polyglucosamine PGB-2. The LC-MS analysis was conducted after protein separation on the 1D-PAGE to accomplish the purpose of this study. 280 proteins were totally identified and 188 proteins were separated as acetate-related proteins in BL-4. Acetate was converted to acetyl-CoA by acetyl-CoA synthetase up-regulated in the acetate medium. The glyoxylate bypass in the acetate medium was up-regulated with over-expression of isocitrate lyases and 2D-PAGE confirmed this differential expression. Using 1H-NMR analysis, the product of isocitrate lyases, succinate, increased about 15 times in the acetate medium. During acetate metabolism proteins involved in the lipid metabolism and hexosamine biosynthesis were over-expressed in the acetate medium, while proteins involved in TCA cycle, pentose phosphate cycle and purine metabolism were down-regulated. Taken together, the results from the proteomic analysis can be applied to improve GlcN production and to develop metabolic engineering in BL-4.
Keywords: Citrobacter sp. BL-4, proteomics, 1H-NMR, acetate metabolism, polyglucosamine production
Introduction
Glucosamine (GlcN) is now widely used to treat osteoarthritis in humans [1, 2]. However, nearly all GlcNs have been manufactured from shellfish wastes [3]. This chemically treated process on GlcN production may cause shellfish protein contamination and the production amount can be limited by raw materials available. Therefore, newly developed technology based on microbial fermentation for producing GlcN has been introduced [3-5] and Citrobacter sp. is one of good candidates for achieving mass production of GlcN [6]. Recently, a new extracellular polyglucosamine biopolymer PGB-2 from Citrobacter sp. BL-4 (BL-4) has been introduced and the structural similarity of PGB-2 with chitosan from crab shells has been determined [6]. For mass production of PGB-2 it is necessary to obtain whole biochemical information in BL-4 when acetate is available as a sole carbon source because the bacteria produced PGB-2 under acetate feeding only.
Proteomics technology can easily collect high-throughput information on intercellular changes due to up- and down-regulation of genes by a certain growth environment [7]. As the previous report demonstrated, acetate has been known to be toxic to bacterial cells [8] and inhibit growth because its free acid forms quickly penetrate the cell membrane and acidify the cytoplasm with dissociation, conferring the gradient of protons through the membrane cannot be maintained and the energy generation is decoupled [8]. Interestingly, Citrobacter sp. shows its preference for acetate rather than glucose as a carbon source [6]. Therefore, it is worthwhile to assess how BL-4 survives under acetate feeding and produces PGB-2 using proteomic technology.
Herein, we used differential expression proteomics which employed one dimensional polyacrylamide gel electrophoresis (1D-PAGE) coupled with liquid chromatography-quadrupole mass spectrometer (LC-MS/MS) system for producing high-throughput data. Confirmation of up- and down-regulation of proteins was conducted with 2D-PAGE. This methodology has been developed and applied to various biological samples [9-11]. Biochemical products mediated by differentially expressed proteins were determined by 1H-NMR to prove the proteomic results.
Materials and Methods
Strain and pH-stat fed batch cultivation of Citrobacter sp. BL-4
Citrobacter sp. BL-4 (KACC91177, BL-4) was cultured in a liquid medium composed of 1.5% (w/v) sodium acetate, 0.1% (NH4)2SO4, 0.01% yeast extract, 2% CaCl2, 0.5% FeCl3∙6H2O, and 0.05% trace elements at 30 oC, 500 rpm, and 0.5 vvm for 48 h [6]. A 5 M acetic acid solution was fed to maintain pH 8.0 for overproduction of microbial polyglucosamine biopolymer PGB-2. The molecular weights of PGB-2 were measured by gel permeation chromatography using a breeze HPLC system equipped with an ultrahydrogel column and RI detector (Waters, Milford, MA) with pullulan polysaccharides as standards (Phenomnex Inc., Torrance, CA). The hexosamine content was determined by the modified Elson-Morgan method using glucosamine as the standard after modification [6].
Analysis of element and monosaccharide compositions
PGB-2 was hydrolyzed with 6 M HCl at 105 oC for 10 h, neutralized with the same volume of 6 M NaOH, and then the monosaccharide compositions were determined by an HPLC system (Gilson, Villiers-Le-Bel, France) equipped with an OP-NH2 column (RStech Co., Daejeon, Korea) using acetonitrile/water (7:3, v/v) as the mobile phase at 1 ml min-1.
1-D PAGE and Coomassie staining
One dimensional PAGE and Coomassie staining were performed according to the methods previously reported [9].
2-D PAGE
Two-D PAGE (2-D PAGE) was performed according to the method previously reported [10] using an IPGphor unit (Amersham Biosciences, Uppsala, Sweden) with 130 mm pH 4-7 IPG strips, and 10%, and 12.5% acrylamide gels. Bacterial samples were dissolved in lysis buffer (2% CHAPS, 7 M urea, 2 M thiourea, 40 mM Tris-base, 20 mM DTT, 0.5% IPG buffer, trace of DNAase and protease inhibitor mixture) using an homogenizer and mixed with rehydration buffer (bromophenol blue added to lysis buffer). For the first dimension, 70 μg protein for silver staining were applied to a rehydrated IPG strip, and IEF was carried out at 25°C in an IPGphor IEF horizontal system. Before the second dimension separation, gel strips were equilibrated for 15 min in 50 mM Tris-chloride (pH 8.8), 6 M urea, 30% glycerol, 2% SDS containing 5% DTT and then re-equilibrated for 10 min in the same buffer containing 0.5% iodoacetamide. Bacterial extracts were placed on acrylamide gels, unstained molecular standards were applied, and electrophoresis performed. IEF was performed as follows: 50 V for 30 min, 100 V for 1 h, gradient 1000 V for 30 min, 1000 V for 1 h, gradient 8000 V for 30 min, 8000 V for 5 h for a total of 28000 V/h. Second dimension gels were run at 20 mA/gel for 12 h.
Silver staining
After 2-D PAGE, gels were fixed with 50% methanol, 12% acetic acid for 90 min, washed two times with 50% ethanol for 30 min, and treated with 0.02% sodium thiosulfate. Gels were washed with triple-distilled water and then incubated in 0.2% silver nitrate, 0.075% formaldehyde for 20 min. After washing with triple-distilled water, gels were treated with 2% sodium carbonate, 0.0004% sodium thiosulfate, and 0.05% formaldehyde. The reaction was stopped by 1% acetic acid.
Analysis of gel images
Images from silver-stained gels were obtained using a densitometer (GS800, Bio-Rad, Seoul, Korea). The analysis of gels to compare protein content between the acetate-fed Citrobacter and the glucose-fed Citrobacter was performed using PD-Quest software (Bio-Rad). Statistical data were obtained using GraphPad software.
LC-MS/MS analysis
LC-MS/MS analyses were performed according to the method previously reported [11] and carried out on an UltimateTM nano-electrospray LC system interfaced to an esquireHCTplus ion trap mass spectrometer (Bruker Daltonics, Billerica, MA). The nano LC column was C18 PepMap100 (3 μm film thickness, 75 μm i.d. × 15 cm, Dionex, Sunnylvale, CA). The mobile phase (A = 0.1% formic acid; B = 0.1% formic acid in acetonitrile) started at 95% A and 5% B for 5 min was changed to 40% A and 60% B in 88 min, 5% A and 95% B in 10 min, 95% A and 5% B in 15 min, and finally was held at 95% A and 5% B for 20 min. The flow rate was 180 nL/min. Peptide spectra were recorded over a mass range of m/z 300-2500 while MS/MS spectra were recorded in information dependent data acquisition over a mass range of m/z 50-1600. One peptide spectrum was recorded followed by two MS/MS spectra; the accumulation time was 1 sec for peptide spectra and 2 sec for MS/MS spectra. The collision energy was set automatically according to the mass and charge state of the peptides chosen for fragmentation. Doubly or triply charged ions were selected for product ion spectra. MS/MS spectra were interpreted by Mascot (Matrix Science Ltd, London, UK) via Biotools 2.2 software (Bruker Daltonics).
Analysis of peptide sequences
Peptide mass fingerprint (PMF) searches based on peptide masses measured were performed using the Swiss-Prot or MSDB databases with the Mascot server. PMF used the assumption that peptides are monoisotopic, oxidized at methionine residues and carbamidomethylated at cysteine residues. Up to one missed trypsin cleavage was allowed, although most matches did not contain any missed cleavages. Mass tolerance of 1.0 Da was the window of error allowed for matching the peptide mass values. Probability based Molecular Weight Search (MOWSE) scores were estimated by comparison of search results against estimated random match populations and were reported as: 10 x log10(p), where p is the absolute probability. Scores in Mascot larger than the MOWSE score at p = 0.05 were considered significant, meaning that the probability of the match being a random event is lower than 0.05 when scores in Mascot were larger than the MOWSE score at p = 0.05.
Extraction for metabolomic studies
One hundred mg of freeze-dried BL-4 samples were placed into a centrifuge tube. Five milliliters of a 50% water-methanol mixture and 5 ml of chloroform were added to the samples in tubes, and then vortexed and sonicated for 1 min, respectively. The tubes were then centrifuged at 2000 rpm for 20 min. The extraction was performed twice. The aqueous fractions was transferred separately into a 50 ml round-bottomed flask and dried with a rotary vacuum evaporator. Each experiment was performed in 5 times replication.
NMR measurements
KH2PO4 was added to D2O as a buffering agent to make up 0.1 M of final concentration. The pH of the D2O used for NMR measurements was adjusted to 6.0 using a 1N NaOD solution. All spectra were obtained by a NMR spectrometer (Avance 600 FT-NMR, Bruker Biospin GmbH, Rheinstetten, Germany) operating at a proton NMR frequency of 600.13 MHz. For each sample, 128 scans were recorded with the following parameters: 0.155 Hz/point, pulse width of 4.0 s (30°), and relaxation delay of 1.0 s. The presaturation pulse sequence was applied to suppress the residual water signal. Free induction decays were Fourier transformed with LB=0.3 Hz. The spectra were referenced to 0.01% (w/v) trimethylsilyl-propionic-2,2,3,3-d4 acid. Peak assignment was conducted by using Chenomx NMR suite software (version 4.6, Chenomx Inc., Edmonton, Alberta, Canada).
Data Analysis for NMR spectra
The 1H NMR spectra were automatically reduced to ASCII files using AMIX software (Biospin version 3.7, Bruker, Seoul, Korea). All spectral data were scaled to total intensity for aqueous extracts. The spectral region from 0.52 ppm to 10.00 ppm was segmented into regions of 0.04 ppm width giving a total of 237 integrated regions per NMR spectrum. The region from 4.60 to 4.90 was excluded from the analysis because of the residual signal of water in aqueous extracts. Primary component analysis (PCA) was performed with SIMCA-P software (version 11.0, Umetrics, Umeå, Sweden). The relative levels of metabolites derived from PCA were further statistically evaluated by one-way ANOVA followed by Duncan's multiple range tests using SPSS software (version 12.0, SPSS, Chicago, IL).
Results
Bacterial growth and polyglucosamine production
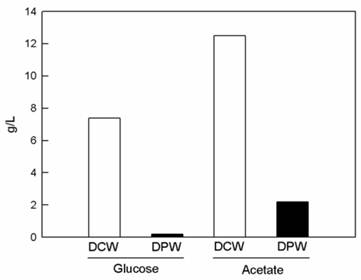
The growth of BL-4 increased when acetate but not glucose was supplied into the growth medium (Fig. 1). Acetate contains less energy than glucose. However, BL-4 preferred acetate for carbon and energy sources and glucose gives lower growth yield. The less biopolymer mass formed on the glucose medium than on the acetate medium.
pH-stat fed batch cultivation of Citrobacter sp. BL-4 for production of polyglucosamine PGB-2. The strain was cultivated in a basal medium containing 1.5% (w/v) glucose and sodium acetate at 500 rpm, 0.5 vvm for 48 h. DCW, dried cell weight; DPW, Dried polymer weight (PGB-2).
Proteomic analysis of the effect of different feeding on GlcN production
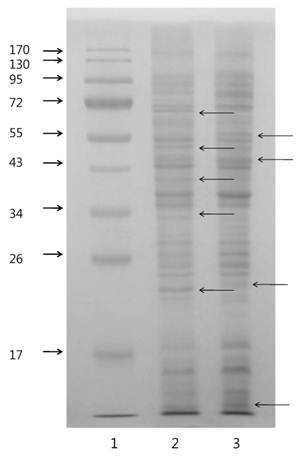
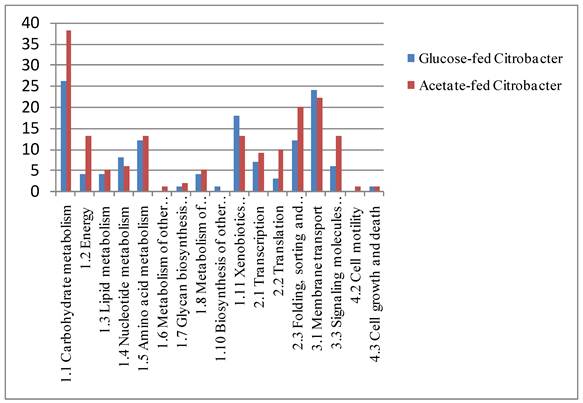
One dimensional-PAGE (1D-PAGE) was conducted with BL-4 cells grown in the different carbon sources (Fig. 2) and images of the gels were different from carbon sources. LC-MS/MS measurements of the proteins on 1D-PAGE gels showed mass differences between cells grown in the acetate medium and the glucose medium. A total of 280 proteins were identified from the bacterial cells grown in both growth medium (Fig. 2) and 92 proteins were expressed in both medium in BL-4. Sixty four proteins were selectively expressed in the glucose medium and 124 proteins were found only in the acetate medium (Fig. 3). Among the up-regulated proteins, proteins involved in carbohydrate metabolism including glyoxylate bypass, glycerol metabolic process and acetyl-CoA biosynthesis were over-expressed in the acetate medium. Energy, ATP biosynthesis and fatty acid biosynthesis were also elevated in the acetate medium were over-expressed. Proteins involved in transcription and translation process were enhanced in the acetate medium (Fig. 3). Selected proteins within the over-expressed proteins in BL-4 in response to acetate feeding were shown in Table 1. Acetate caused the down-expression of proteins involved in purine biosynthesis, de novo pathway, isoprene biosynthesis, and oxidoreductases. Among them, there were some important proteins such as acid phosphatase, transaldolase, adenylosuccinate synthase, orotate phosphoribosyltransferase, phosphoribosylaminoimidazole-succinocarboxamide synthase, pyruvate formate-lyase (PFL), radical SAM, glutamine synthetase, FKBP-type peptidyl-prolyl cis-trans isomerase, aromatic ring-cleaving dioxygenase, and diol dehydrase (Table 1).
1D-PAGE images of Citrobacter sp. BL-4 proteins (15 μg). Arrows indicate different patterns of proteins on the gel. 1, molecular size marker; 2, acetate-fed Citrobacter; 3, glucose-fed Citrobacter.
Functional classification of proteins identified by 1D-PAGE and nano-LC-Ms/MS analysis.
Selected proteins in the differentially expressed proteins of Citrobacter sp. BL-4 in acetate metabolism. Results were obtained by 1D-PAGE and LC-MS/MS analysis with Mascot search engine and the homology alignments. Uniprot and KEGGs classification were used to search functional roles of identified proteins.
| No. | Protein name | No. of matched peptides (status) | Mascot Score (value P=0.05) | Accession number | Biological function |
|---|---|---|---|---|---|
| Carbohydrate metabolism and Energy | |||||
| 1 | Acid phosphatase precursor | 3 (down) | 194 (55) | gi/11610581 | Acid phosphatase |
| 2 | Acetyl-CoA synthetase | 1 (up) | 58 (55) | gi/148105 | Acetyl-CoA biosynthesis |
| 3 | ADP-L-Glycero-D-manno-heptose epimerase | 1 (up) | 61 (55) | gi/5006980 | Carbohydrate metabolism |
| 4 | H+ ATPase F1 alpha subunit | 6 (up) | 198 (55) | gi/146323 | ATP synthesis coupled proton transport |
| 5 | Cytochrome d oxidase subunit | 4 (up) | 109 (55) | gi/2997421 | Respiratory chain |
| 6 | Cytochrome o ubiquinol oxidase subunit | 1 (up) | 67 (55) | gi/16501713 | Respiratory Chain |
| 7 | Glycerol dehydrogenase | 10 (up) | 430 (55) | gi/493084 | Glycerol metabolism |
| 8 | Glycerol kinase | 2 (up) | 80 (55) | gi/16422652 | Glycerol metabolism |
| 9 | Isocitrate lyase and phosphoryl mutase | 1 (up) | 103 (55) | gi/82410059 | Glyoxylate cycle |
| 10 | Phosphotransferase system IIA (PTS-dependent dihydroxyacetone kinase) | 3 (up) | 116 (55) | gi/37197902 | Gluconeogenesis |
| 11 | Phosphoenolpyruvate synthase | 1 (up) | 83 (56) | gi/13361876 | Gluconeogenesis |
| 12 | Pyruvate kinase | 2 (up) | 78 (55) | gi/75214842 | Carbohydrate degradation |
| 13 | Pyruvate dehydrogenase decarboxylase | 3 (down) | 216 (56) | gi/16418653 | Glycolysis |
| 14 | Transaldolase | 2 (down) | 66 (56) | gi/75820099 | Pentose phosphate cycle |
| Lipid metabolism | |||||
| 15 | Acetyl-CoA carboxylase | 2 (up) | 108 (55) | gi/4902926 | Fatty acid biosynthesis |
| 16 | 3-oxoacyl-(acyl-carrier-protein) synthase III | 1 (up) | 58 (55) | gi/83952158 | Fatty acid biosynthesis |
| Nucleotide metabolism | |||||
| 17 | Adenylosuccinate synthetase | 1 (down) | 61 (56) | gi/49613375 | Purine biosynthesis |
| 18 | CTP synthetase (EC 6.3.4.2) | 1 (up) | 64 (56) | gi/147478 | Pyrimidine biosynthesis |
| 19 | Orotate phosphoribosyltransferase | 1 (down) | 164 (55) | gi/26250288 | Purine metabolism |
| 20 | Phosphoribosylpyrophosphate synthetase | 5 (up) | 270 (55) | gi/147379 | Ribonucleoside monophosphate biosynthesis |
| Amino acid metabolism | |||||
| 21 | Carbamoylphosphate synthetase large subunit | 1 (up) | 113 (55) | gi/28805454 | Citrulline biosynthesis |
| 22 | Cysteine synthase A [Escherichia coli CFT073] | 9 (up) | 382 (59) | gi|26248790 | Cysteine biosynthesis |
| 23 | Glutamine synthetase | 2 (down) | 62 (55) | gi/3808290 | Glutamine synthesis |
| 24 | L-Glutamine: D-fructose-6-phosphate amidotransferase | 2 (up) | 65 (56) | gi/177961813 | Hexosamine biosynthesis |
| 25 | Glycine dehydrogenase (decarboxylating) | 2 (down) | 119 (56) | gi/403345 | Glycine biosynthesis |
| 26 | 2-oxoglutarate dehydrogenase (Dihydrolipoamide dehydrogenase) | 4 (down) | 141 (55) | gi/29418063 | Glycine cleavage system |
| 27 | Proline dehydrogenase | 5 (up) | 215 (55) | gi/74311578 | Glutamate biosynthesis |
| 28 | Pyruvate formate-lyase (formate acetyltransferase) | 2 (down) | 100 (55) | gi/16410835 | Carbohydrate metabolism |
| 29 | Radical SAM | 2 (down) | 63 (55) | gi/82703177 | Metabolic pathway |
| Biosynthesis of cofactors and vitamins | |||||
| 30 | 4-amino-4-deoxychorismate lyase | 2 (up) | 57 (55) | gi/82499592 | Cofactor biosynthesis |
| 31 | 4-aminobutyrate aminotransferase activity | 1 (up) | 98 (55) | gi/1789016 | γ-aminobutyric acid metabolic process |
| 32 | Putative carboxyphosphonoenolpyruvate mutase | 2 (up) | 195 (55) | gi/1641887 | Boalaphos biosynthesis |
| 33 | Putative cobalamin synthesis protein | 1 (up) | 70 (55) | gi/16423097 | Cobalamin biosynthesis |
| 34 | Putative diaminobutyrate-pyruvate transminase | 1 (down) | 59 (55) | gi/46913838 | Pyridoxal biosynthesis |
| Regulation and Signaling molecules | |||||
| 35 | CRP regulatory protein | 14 (up) | 372 (55) | gi/2190360 | Regulation of transcription |
| 36 | Global response regulator | 3 (up) | 185 (55) | gi/56416367 | Production of extracellular enzymes |
| 37 | Helix-turn-helix, AraC type | 2 (up) | 61 (56) | gi/67675520 | Signal transduction |
| 38 | Sensory transducer kinase CheA | 3 (up) | 100 (55) | gi/13362066 | Chemotaxis, signal transduction |
| 39 | Serine chemoreceptor CheD | 3 (up) | 147 (55) | gi/43218 | Chemotaxis, signal transduction |
| 40 | Serine phosphatase, regulator of sigma subunit | 3 (up) | 68 (55) | gi/23014626 | Signal transduction |
| 41 | Tubulin-like GTP-binding protein | 5 (down) | 289 (55) | gi/16418633 | Cell division |
| 42 | Two-component sensor histidine kinase | 3 (up) | 83 (55) | gi/52003113 | Signal transduction |
| Defense | |||||
| 43 | Alkyl hydroperoxide reductase | 4 (down) | 161 (55) | gi/16501859 | Defense |
| 44 | Similar to Aromatic ring-cleaving dioxygenase | 1 (down) | 58 (55) | gi/68539957 | Detoxification |
| 45 | Cytochrome P450 monooxygenase | 2 (up) | 63 (55) | gi/40458387 | Defense |
| 46 | Diol dehydrase alpha subunit | 3 (down) | 58 (55) | gi/868006 | Detoxification |
| 47 | Glutathione S-transferase | 1 (up) | 66 (55) | gi/39649640 | Defense |
| 48 | FKBP-type peptidyl-prolyl cis-trans isomerase | 3 (down) | 113 (56) | gi/75830739 | Chaperone |
| 49 | 4-oxalocrotonate decarboxylase | 1 (down) | 57 (55) | gi/45685 | Aromatic compound metabolic process |
| 50 | Universal stress protein A | 1 (up) | 57 (55) | gi/43280 | Response to DNA-damaging agents |
| Membrane transporter | |||||
| 51 | ABC-type metal ion transporter system | 5 (up) | 105 (55) | gi/77977719 | Transport |
| 52 | Glutamine binding protein | 8 (down) | 248 (55) | gi/16502041 | Glutamine transport |
| 53 | Molybdate transporter | 5 (down) | 309 (55) | gi/16419287 | Transport |
| 54 | Outer membrane protein and related peptidoglycan-associated (lipo) proteins | 14 (up) | 422 (55) | gi/75290025 | Cellular component |
| 55 | Preprotein translocase SecA | 2 (up) | 63 (55) | gi/36786944 | Protein transporter |
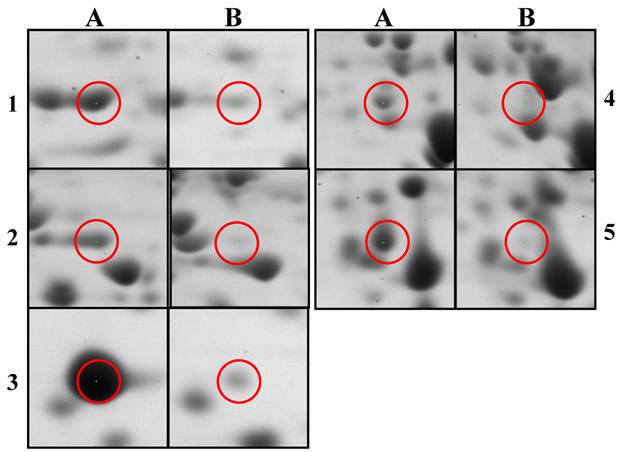
For the confirmation of the differentially expressed proteins 2D-PAGE and LC-MS/MS analysis were employed in this study. 2D-PAGE was done and the gel images were used for the comparison of the differentially expressed proteins from 1D-PAGE and LC-MS/MS analysis. Isozymes of isocitrate lyase were found in the acetate medium and glycerol dehydrogenase was up-regulated in the acetate-fed BL-4 (Fig. 4). Cysteine synthase isozymes were also found as up-regulated in the acetate medium (Fig. 4), while PFL isozymes, radical SAM, and FKBP-type peptidyl-prolyl cis-trans isomerases dramatically decreased in the acetate medium (Fig. 5). Some of proteins were not identified by 1D-PAGE and LC-MS/MS analysis, but by 2D-PAGE and LC-MS/MS analysis (Fig. 6).
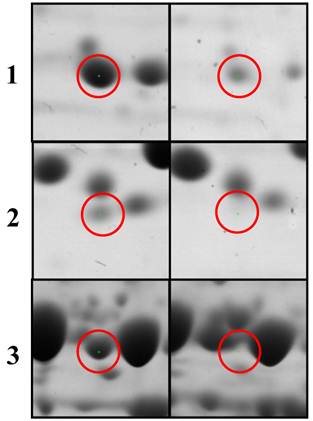
Comparison of selected up-regulated proteins after 2D-PAGE and nano-LC-MS/MS analysis of Citrobacter sp. BL-4. A and B indicate the proteins of Citrobacter sp. BL-4 grown in the acetate medium and the glucose medium, respectively. 1, cysteine synthase; 2, cysteine synthase; 3, universal stress protein A; 4, Helix-turn-helix; 5, isocitrate lyase.
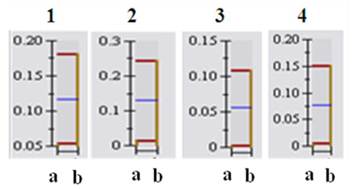
Histograms of selected down-regulated proteins after 2D-PAGE image analysis using PD-QUEST program and nano-LC-MS/MS. Citrobacter sp. BL-4 samples were grown in different growth medium and the proteins were obtained after cell lyses and precipitation. “a” and “b” indicate cells grown in the acetate and in the glucose medium, respectively. 1, S-adenosylmethionine synthetase; 2, Formate acetyltransferase (pyruvate-formate lyase); 3, FBKP-type peptidyl-prolyl cis-trans isomerase; 4, argininosuccinate synthase.
Comparison of selected up-regulated proteins after 2D-PAGE and nano-LC-MS/MS analysis of Citrobacter sp. BL-4. Proteins in this figure were not determined by 1D-PAGE and LC-MS/MS analysis, but by 2D-PAGE and LC-MS/MS analysis. A and B indicate the proteins of Citrobacter sp. BL-4 grown in the acetate medium and the glucose medium, respectively. 1, succinate dehydrogenase; 2, gamma-glutamyltransferase; 3, N-acetylglucosamine 6-phosphate deacetylase.
1H NMR spectra and assignment of several non-volatile metabolites
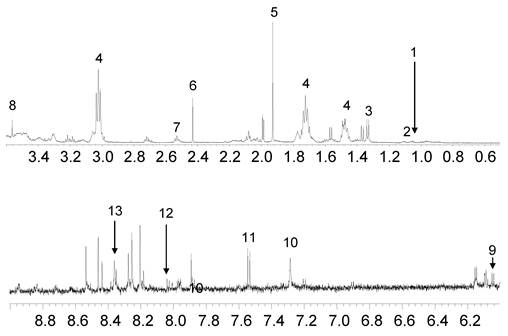
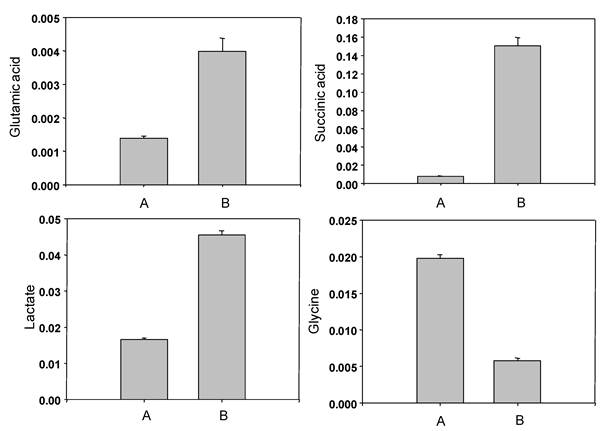
The representative 1H-NMR spectra were obtained from aqueous fractions of BL-4 grown in the acetate medium and the glucose medium. Differences were observed between the spectrum and the peaks were identified by comparison with the chemical shifts of standard compounds using Chenomx NMR suite software (Fig. 7). In the aliphatic region of the spectra (0-3 ppm), peaks that corresponded to leucine/isoleucine were observed at δ=0.96 (m), valine at δ= 0.98 (d, J=9.0 Hz), lactate at δ=1.34 (d, J=14.4 Hz), cadavarine at δ=3.00 (t, J=7.2 Hz), acetic acid at δ=1.90 (s), succinic acid at δ=2.42 (s), glutamic acid at δ= 2.50 (m), and glycine at δ=3.54 (s). The peaks in the aromatic region of the spectrum (6-10 ppm) revealed the presence of inosine at δ= 6.07 (d, J=10.8 Hz), imidazole at δ=7.27 (s), uracil at δ=7.51 (d, J=9.0 Hz), hypoxanthine at δ=8.18 (s), and adenine at δ=8.38 (s) (Fig. 7). The acetate-fed BL-4 produced high amount of succinate, lactate, and glutamate, whereas the glucose-fed BL-4 yielded high amount of glycine (Fig. 8).
Representative 1H NMR spectra of the total and aromatic region of the aqueous fraction of Citrobacter sp. BL-4 cultivation. IS, internal standard; 1, isoleucine/leucine; 2, valine; 3, lactate; 4, cadaverine; 5, acetic acid; 6, succinic acid; 7, glutamic acid; 8, glycine; 9, inoline; 10, imidazole; 11, uracil; 12, hypoxanthine; 13, adenine. Values on the X-axis are the chemical shift in ppm relative to TSP.
Comparison of non-volatile compounds obtained from Citrobacter sp. BL-4 grown in the glucose medium (A) and in the acetate medium (B).
Discussion
Acetate metabolism in microorganisms has been well studied [12-15] and reviewed [16-18]. Proteome differences according to acetate supply in BL-4 were studied in respect of biotechnological aspects for accomplishing industrial purposes as increasing production rate of the target biopolymer, PGB-2. It is the first report for the bacteria to describe proteomic changes due to acetate metabolism.
Up-regulation of acetyl-CoA synthetase activity for initiation of acetate activation
Acetate assimilation to acetyl-CoA must be occurred when acetate is available as a sole carbon source. This reaction is catalyzed by acetyl-CoA synthetase and its activity is not determined in bacterial cells grown on glucose. In contrast to acetyl-CoA synthetase acetate kinase (AK; ATP acetate phosphotransferase) and phosphotransacetylase (PT; acetyl-CoA: orthophosphate acetyl transferase) are employed for the formation of acetyl-CoA when glucose is used as the carbon source. Levels and expression of these two enzymes vary little with the different carbon sources in E. coli and Salmonella typhimurium [19, 20]. Therefore, three enzymes are involved in the process of acetyl-CoA production.
In our study, acetyl-CoA synthetase was newly expressed in the acetate medium (Table 1). According to the previous report the gene FacA is responsible for encoding acetyl-CoA synthetase and the gene has been known to be activated by acetate and deactivated by glucose [21]. Our finding was quite similar to the findings of the previous report [21].
Up-regulation of Glyoxylate pathway
Acetate has been known to regulate 37 genes using a newly developed metabolic array in the bacteria [15]. In the differential transcription profile in Corynebacterium glutaricum, two genes aceA (102-fold) and aceB (85-fold) were up-regulated in acetate when compared to glucose [15]. These genes produce isocitrate lyase (ICL) and malate synthase (MS) in the bacteria. ICL and MS proteins are functionally participated in the glyoxylate cycle. The glyoxylate cycle operates to produce one mole of malate from two moles of acetyl-CoA via two unique enzymes, ICL and MS, in bacteria. In this study, ICL dramatically increased in BL-4 in the acetate medium (Table 1 and Fig. 4). The enzyme catalyzes reversible cleavage of isocitrate to glyoxylate and succinate as the products. By the analysis of 1H NMR the concentration of succinic acid increased about 15 times higher in the acetate medium than in the glucose medium (Fig. 8). Therefore, the glyoxylate bypass was up-regulated in BL-4 when acetate was used as a sole carbon source.
TCA cycle in acetate metabolism in Citrobacter sp. BL-4
In a normal bacterial cell pyruvate is ready to be transferred into citric acid cycle (tricarboxylic acid cycle, TCA cycle) by pyruvate dehydrogenase complex. This enzyme produces carbon dioxide, NADH and acetyl-CoA from pyruvate, CoA and NAD+. As acetyl-CoA synthetase activity was up-regulated in the acetate medium, the role of pyruvate dehydrogenase for producing acetyl-CoA may be minimized in the acetate medium. In the result of the study, pyruvate dehydrogenase was dramatically down-regulated in the acetate medium (Table 1). Additionally, excessive acetyl-CoA or over-expression of acetyl-CoA synthetase may be related to the down-regulation of pyruvate formate lyase (PFL; formate acetyltransferase) in the acetate medium (Table 1 and Fig. 5). PFL is essential to be activated for forming acetyl-CoA and formate from pyruvate and CoA. For the PFL activation, bacterial cells require PFL activase and radical S-adenosylmethionine (SAM). In this study, radical SAM was down-regulated in the acetate medium, referring the down-regulation of PFL (Table 1 and Fig. 5).
Using the glyoxylate bypass in the acetate medium, excessive amount of succinate should be recycled in the TCA cycle to produce oxaloacetate to form citrate. Thus, succinate dehydrogenase was up-regulated in the acetate medium (Fig. 6). Therefore, up-regulation of glyoxylate bypass may change TCA cycle during acetate metabolism.
Up-regulation of lipid metabolism
Fatty acid biosynthesis and degradation requires carrier proteins and enzymes involved in the addition and subtraction reactions of acetate unit to a hydrocarbon chain. Acetyl-CoA carboxylases (ACCs) are the key enzymes and mediate a carboxylation reaction to produce malonyl-CoA from acetyl-CoA. Other key enzyme is fatty acid synthase consisting of six enzymatic activities and it is responsible for the reactions of adding acetate unit to a growing fatty acid chain. In this study, ACCs were up-regulated in the acetate medium in contrast to the glucose medium (Table 1). This finding is quite similar to the result previous reported as ACC was up-regulated in the acetate medium to generate polyhydroxyalcanoates (PHAs) in Ralstonia eutropha [11]. In R. eutropha, various fatty acid biosynthesizing proteins involved in the PHA production were over-expressed in relation to the use of acetate as a sole carbon source and they were acyl-CoA dehydrogenase, 3-oxoacyl-acyl-carrier protein synthase (FabH), enoyl-[acyl-carrier-protein]reductase (FabI) and fatty acid-CoA ligase [11]. In our study, FabI and β-ketoacyl carrier protein reductase (FabG) were found in both medium and they might be not expressed differently (data not shown). However, FabH was up-regulated in the acetate medium (Table 1) and it seemed to be involved in the PHA production in BL-4. Further studies may be needed to find possible PHA production in BL-4 when various organic acids are used as carbon sources.
Induction of hexosamine biosynthesis
GlcNs are produced by three different enzymes such as L-glutamine: D-fructose-6-phosphate amidotransferase (glucosamine synthase, GlmS), phosphoglucosamine mutase and acetyltransferase. Among them, GlmS is a key enzyme which catalyzes fructose-6-phosphate to glucosamine-6-phosphate in host cells. By the 1D-PAGE and LC-MS/MS analysis, GlmS was up-regulated in acetate-fed BL-4 (Table 1). As N-acetylglucosamine has been determined as a unit of peptidoglycan with N-acetylmuramic acid, its primary function is to preserve cell integrity by withstanding the internal osmotic pressure [22]. Therefore, it is likely that BL-4 expresses GlmS involved in the hexosamine biosynthesis to build up peptidoglycan to control osmotic pressure occurred by acetate supply in the growth medium.
On the other hands, excessive glucosamine-6-phosphate (GlcN-6-P) produced by metabolic engineered E. coli strongly inhibits GlmS activity in the host cells, whereas GlcN weakly inhibits GlmS activity [4]. GlcN-6-P may be a key compound to control glucosamine production in bacterial cells. Another biosynthetic intermediate, N-acetyl-D-glucosamine-6-phosphate (AcGlcN-6-P), can be catalyzed to GlcN-6-P by AcGlcN-6-P deacetylase. Our study showed that AcGlcN-6-P deacetylase was up-regulated 5 times in the acetate medium than in the glucose medium (Fig. 6). From the results, GlcN production is regulated by GlcN-6-P concentration in the bacterial cells. Therefore, GlcN production is definitely improved if those factors are controlled adequately. For instance, an AcGlcN-6-P deacetylase knock-out strain of BL-4 can be developed and this strain may produce massive GlcN under the acetate supply.
Presumable biosynthetic mechanisms induced by acetate
The expression of glycerol dehydrogenase and glycerol kinase (Table 1) was over-expressed in BL-4 in the acetate medium. Glycerol dehydrogenase catalyses the NAD+-dependent oxidation of 2,3-butanediol to acetoin as well as the corresponding reverse reactions. Glycerol kinase is a key enzyme in the regulation of glycerol uptake and metabolism and the enzyme plays an important role in gluconeogenesis to form glucose. Therefore, BL-4 may produce 2,3-butanediol from acetoin when acetate is available in the growth medium.
The aldehyde dehydrogenase B (lactaldehyde dehydrogenase) was over-expressed at least five-fold when acetate was available in BL-4 and it catalyzes (S)-lactaldehyde with NAD+ and a molecule of water to form (S)-lactate and NADH. Lactate concentration in the bacterial cells increased at least 15 times in the acetate medium when compared to the glucose medium (Fig. 8). Therefore, acetate plays an important role in the induction of 2,3-butanediol and lactate production.
Glutathione S-transferase (GST) is involved in the detoxification reaction when cells are exposed to various toxic compounds. In the acetate medium, BL-4 expressed more GSTs than in the glucose medium (Table 1). Glutathione is composed to three amino acids such as cysteine, glutamate and glycine. In this study, cysteine synthase was up-regulated (Table 1 and Fig. 4) and the concentration of glutamate in the acetate medium was about 3.1-fold higher than in the glucose medium (Fig. 8). Another key enzyme, gamma-glutamyltransferase, was also up-regulated in relation to glutathione biosynthesis (Fig. 6). Therefore, GST detoxification system may be needed to suppress oxidative stress in the acetate medium in BL-4.
Some of up- and down-regulated proteins analyzed on the 1D-PAGE was reconfirmed using 2D-PAGE were universal stress protein A, Helix-turn-helix, FBKP-type peptidyl-prolyl cis-trans isomerase, and argininosuccinate synthase. Further studies needs to find their role in the acetate medium in BL-4.
Conclusions
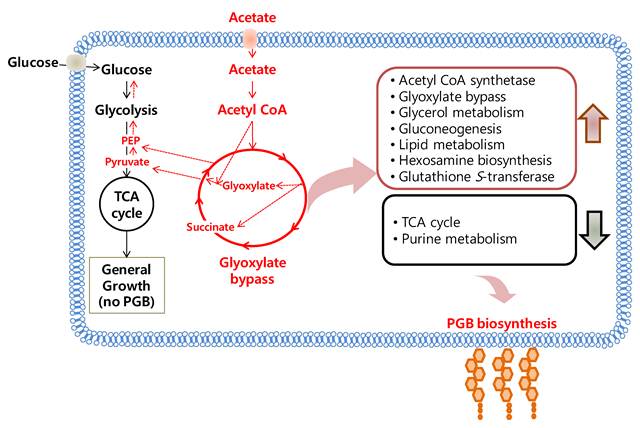
Proteomic analysis of BL-4 using LC-MS/MS after protein separation on 1D-PAGE found a dramatic change in the acetate medium when compared to the glucose medium. According to UNIPROT classification and KEGG regulatory pathways, most up-regulated proteins in relation to acetate feeding were involved in acetate assimilation, the glyoxylate cycle, glycerol metabolism, energy production, and lipid metabolism. On the other hand, BL-4 revealed down-regulation of proteins involved in the TCA cycle, pentose phosphate cycle and purine metabolism. These results were reconfirmed by LC-MS/MS analysis after 2D-PAGE and 1H-NMR. Higher amount of succinate, glutamate and lactate were found in the acetate medium than in the glucose medium. As BL-4 produced polyglucosamines (PGB-2) in the acetate medium, most proteomic changes were related to the production of PGB-2. Further studies in BL-4 will be necessary to modify metabolic pathways for becoming a cell factory to produce massive PGB-2. Whole proteomic findings are summarized in Fig. 9.
Acetate metabolism in Citrobacter sp. BL-4. PGB, polyglucosamine.
Acknowledgements
This work was supported by Dong-eui University Grant (Grant No. 2010AA131).
Conflict of Interests
The authors have declared that no conflict of interest exists.
References
1. Calamia V, Ruiz-Romero C, Rocha B, Fernandez-Puente P, Mateos J, Montell E, Verges J, Blanco F. Pharmacoproteomic study of the effects of chondroitin and glucosamine sulfate on human articular chondrocytes. Arthritis Res Ther. 2010;12:R138
2. Fox BA, Stephens MM. Glucosamine hydrochloride for the treatment of osteoarthritis symptoms. Clin Interv Aging. 2007;2:599-604
3. Chmielowski RA, Wu HS, Wang SS. Scale-up of upstream and downstream operations for the production of glucosamine using microbial fermentation. Biotechnol J. 2007;2:996-1006
4. Deng MD, Severson KD, Grund DA, Wasshink SL, Burlingame RP, Berry A, Running JA, Kunesh CA, Song L, Jerrell TA, Rosson RA. Metabolic engineering of Eschrichia coli for industrial production of glucosamine and N-acetylglucosamine. Metab Eng. 2005;7:201-214
5. Hsieh JW, Wu HS, Wei YH, Wang SS. Determination and kinetics of producing glucosamine using fungi. Biotechnol Prog. 2007;23:1009-1016
6. Kim LS, Hong SJ, Son MK, Lee YH. Polymeric and compositional properties of novel extracellular microbial polyglucosamine biopolymer from new stain of Citrobacter sp. BL-4. Biotechnol Lett. 2006;28:241-245
7. Mallick P, Kuster B. Proteomics: a pragmatic perspective. Nat Biotechnol. 2010;28:695-709
8. Lee SE, Li QX, Yu J. Diverse protein regulations on PHA formation in Ralstonia eutropha on short chain organic acids. Int J Biol Sci. 2009;5:215-225
9. Son J, Lee SE, Park BS, Jung J, Park HS, Bang JY, Kang GY, Cho K. Biomarker discovery and proteomic evaluation of cadmium toxicity on a collembolan species, Paronychiurus kimi (Lee). Proteomics. 2011;11:2294-2307
10. Lee SE, Seo JS, Keum YS, Lee KJ, Li QX. Fluoranthene metabolism and associated proteins in Mycobacterium sp. JS14. Proteomics. 2007;7:2059-2069
11. Lee SE, Li QX, Yu J. Proteomic examination of Ralstonia eutropha in cellular responses to formic acid. Proteomics. 2006;6:4259-4268
12. Lee YJ, Jang JW, Kim KJ, Maeng PJ. TCA cycle-independent acetate metabolism via glyoxylate cycle in Saccharomyces cerevisiae. Yeast. 2011;28:153-166
13. Sigala JC, Flores S, Flores N, Aguilar C, de Anda R, Gosset G, Bolivar F. Acetate metabolism in Escherichia coli strains lacking phosphoenolpyruvate:carbohydrate phosphotransferase system; evidence of carbon recycling strategies and futile cycles. J Mol MIcrobiol Biotechnol. 2009;16:224-235
14. Wendisch V, Spies M, Reinscheid DJ, Schnicke S, Sahm H, Eikmanns BJ. Regulation of acetate metabolism in Corynebacterium glutamicum: transcriptional control of the isocitrate lyase and malate synthase genes. Arch Microbiol. 1997;168:262-269
15. Hayashi M, Mizoguchi H, Shiraishi N, Obayashi M, Nakagawa S, Imai J, watanabe S, Ota T, Ikeda M. Transcriptome analysis of acetate metabolism in Corynebacterium glutaricum using a newly developed metabolic array. Biosci Biotechnol Biochem. 2002;66:1337-1344
16. Cozzone AJ. Regulation of acetate metabolism by protein phosphorylation in enteric bacteria. Annu Rev Microbiol. 1998;52:127-164
17. Gerstmeir R, Wendisch VF, Schnicke S, Ruan H, Farwick M, Reinscheid D, Eikmanns BJ. Acetate metabolism and its regulation in Corynebacterium glutamicum. J Biotechnol. 2003;104:99-122
18. Wolfe AJ. The acetate switch. Microbiol Mol Biol Rev. 2005;69:12-50
19. Brown TDK, Jones-Mortimer MC, Kornberg HL. The enzymatic interconversion of acetate and acetyl co-enzyme A in Escherichia coli. J Gen Microbiol. 1977;102:327-336
20. Kwan HS, Chui HW, Wong KK. ack::Mu d1-8(Aprac) operon fusions of Salmonella typhimurium LT2. Mol Gen Genet. 1988;211:183-185
21. De Cima S, Rua J, Perdiguero E, del Valle P, Busto F, Baroja-Mazo A, de Arriaga D. An acetyl-CoA synthetase not encoded by the facA gene is expressed under carbon starvation in Phycomyces blakesleeanus. Res Microbiol. 2005;156:663-669
22. van Heijenoort J. Recent advances in the formation of the bacterial peptidoglycan monomer unit. Nat Prod Rep. 2001;18:503-519
Author contact
![]() Corresponding author: Jong Hwa Yum, Tel: +82-51-890-2682; fax: +82-51-890-2622, E-mail address: auxotypecom.
Corresponding author: Jong Hwa Yum, Tel: +82-51-890-2682; fax: +82-51-890-2622, E-mail address: auxotypecom.