Impact Factor ISSN: 1449-2288
- Issue 9; 2026
- Issue 8; 2026
- Issue 7; 2026
- Issue 6; 2026
- Issue 5; 2026
- Volume 22; 2026
- Past Issues
- Advance Articles
- Editorial Board
- Cover Images
- Index & Coverage
- Cover Suggestion
- Special Issues
Introduction
Materials and Methods
Results
Discussion
Acknowledgements
Supplementary Material
References

 Global reach, higher impact
Int J Biol Sci 2012; 8(2):171-186. doi:10.7150/ijbs.8.171 This issue Cite
Research Paper
The Murine Caecal MicroRNA Signature Depends on the Presence of the Endogenous Microbiota
Natasha Singh1, Elize A. Shirdel2,3, Levi Waldron2,#, Regan-Heng Zhang1,*, Igor Jurisica2,3,4, Elena M. Comelli1 ![]()
1. Department of Nutritional Sciences, Faculty of Medicine, University of Toronto, Ontario, Canada
2. Ontario Cancer Institute, Princess Margaret Hospital, University Health Network and the Campbell Family Institute for Cancer Research, Toronto, Ontario, Canada
3. Department of Medical Biophysics, University of Toronto, Ontario, Canada
4. Department of Computer Science, University of Toronto, Ontario, Canada
# Present address: Department of Biostatistics, Harvard School of Public Health, Building 1, Room 412C, 655 Huntington Avenue, Boston, Massachusetts 02115, USA
* Present address: The Biomedical Research Centre, Department of Medical Genetics, Faculty of Medicine, The University of British Columbia, Vancouver, Canada
Received 2011-8-17; Accepted 2011-12-4; Published 2011-12-19
Abstract
The intestinal messenger RNA expression signature is affected by the presence and composition of the endogenous microbiota, with effects on host physiology. The intestine is also characterized by a distinctive micronome. However, it is not known if microbes also impact intestinal gene expression epigenetically. We investigated if the murine caecal microRNA expression signature depends on the presence of the microbiota, and the potential implications of this interaction on intestinal barrier function. Three hundred and thirty four microRNAs were detectable in the caecum of germ-free and conventional male mice and 16 were differentially expressed, with samples from the two groups clustering separately based on their expression patterns. Through a combination of computational and gene expression analyses, including the use of our curated list of 527 genes involved in intestinal barrier regulation, 2,755 putative targets of modulated microRNAs were identified, including 34 intestinal barrier-related genes encoding for junctional and mucus layer proteins and involved in immune regulation. This study shows that the endogenous microbiota influences the caecal microRNA expression signature, suggesting that microRNA modulation is another mechanism through which commensal bacteria impact the regulation of the barrier function and intestinal homeostasis. Through microRNAs, the gut microbiota may impinge a much larger number of genes than expected, particularly in diseases where its composition is altered. In this perspective, abnormally expressed microRNAs could be considered as novel therapeutic targets.
Keywords: gut microbiota, microRNA, caecum, intestinal barrier, glycosylation, mouse
Introduction
Humans are complex supra-organisms composed of various endosymbionts that stem from all three domains of life including bacteria, archaea, and eukarya in addition to their own cells. Body habitats that are considered “hot spots” for microbial colonization include the skin, oral cavity, gut and urogenital tract [1,2]. However, in utero, the fetus is completely sterile with colonization beginning postnatally. It is this developmental property that enables for the exploitation of germ-free animals, which are devoid of microbes on or within their body, in order to determine the functional properties of host endogenous microbiota.
In fact, the gastrointestinal (GI) tracts of both humans and conventionally raised mice harbor upwards of 1014 micro-organisms with levels increasing along the cephalocaudal axis. Temporo-spatially the organization of bacterial cohorts differs with the largest densities residing in the large intestine, with the caecum acting as a fermentation chamber where upwards of 1011-1012 bacteria/gram luminal contents ferment otherwise indigestible polysaccharides leading to the production of short chain fatty acids. The predominant bacteria groups found in human caecal fluid stems from the E. coli and Lactobacillus-Enterococcus groups that represent 50% of the caecal bacterial ribosomal Ribonucleic Acid (rRNA) whereas, Bacteroides (Bacteroides, Porphyromonas and Prevotella spp.) and Clostridium groups (Clostridium, Eubacterium and Ruminococcus spp.) represent 13% of caecal bacterial rRNA [3]. Similarly, the murine caecal microbiota establishes gradually during early postnatal life, and its complexity increases with age until a mature community is reached by 4-6 weeks of age predominately comprising the Bacteroides and Lactobacillus genera and the Clostridium coccoides group [4]. The microbiota residing along the alimentary canal takes advantage of a continuous supply of nutrients and optimal temperature while playing a pivotal role in host physiology, including nutrient processing and generation, affecting energy homeostasis, education of the immune system, and fortifying the intestinal barrier both directly and indirectly [5]. One of the mechanisms underlying this host-microbe mutualistic relationship is the reciprocal impact of host and microbial cells on each other's gene expression programs [6,7]. In particular, the endogenous microbiota acts as an environmental factor impacting the expression of thousands genes in the host epithelium [8,9], and this is a function of its composition [9,10]. However, the impact of the microbiota on the intestinal gene expression signature at the messenger RiboNucleic Acid (mRNA) level may have thus far been under-evaluated due to a lack of studies linking gut microbiota to epigenetic changes in gene expression particularly, via micro-RiboNucleic Acids (miRNA).
MiRNAs are 20-22 nucleotide, single-stranded, non-coding RNA molecules involved in post-transcriptional gene regulation. Nascent miRNA exist as large hairpin-loop precursor structures that undergo several stages of enzymatic processing. Precursor miRNA molecules are first generated in the nucleus and then exported into the cytosol where they are processed by the enzyme Dicer to form shorter duplexes, with one of the two single-stranded molecules being incorporated as part of the molecular machinery involved in post-transcriptional gene regulation while the other, passenger strand (usually indicated with *), is short-lived and rapidly degraded. The association between the single-stranded miRNA molecule and the enzymatic complex RNA Induced Silencing Complex (RISC) lends to translational repression, or cleavage of the targeted mRNA via complementary base pairing to the three prime untranslated region (3'UTR) of their target mRNAs, with the degree of complementarity dictating the fate of the target [11]. What has come to light in recent years is that miRNAs can also induce the up-regulation of gene expression through interactions with genes that contain complementary binding sequences in their promoter regions [12]. To date, 1,048 miRNAs have been annotated in humans and 672 in mice (miRBase release 16, 2010) [13] with the true number suggested to be well over 1,000 miRNAs that are encoded in the mammalian genome [14]. Indeed, it is estimated that these short non-coding RNA molecules regulate up to 50% of the transcriptome (protein encoding mRNAs) [15], however, the true breadth of their potential lies in the fact that each miRNA can have hundreds of targets [16] and in retrospect, multiple miRNAs can have the same mRNA targets. These properties of miRNAs suggest that a single miRNA can potentially influence multiple biological pathways [17]. In fact, miRNAs whose expression is tissue and developmentally regulated [18], have been shown to affect a broad range of biological processes in plants and animals including; development, differentiation, cell proliferation, apoptosis [19], regulation of innate immunity [20] and defense from viruses and pathogens [21,22].
Whilst few studies have investigated the mammalian intestinal miRNA signature, a recent analysis of the global porcine micronome demonstrated the expression of 332 miRNAs along the intestinal tract with region-specific expression along the longitudinal gut axis [23]. In line with these findings, upwards of 200 known mature miRNAs and 122 miRNA* species were identified in colorectal cell lines [24] with some found in following clinical studies to have a greater affinity for expression in specific regions and most expressed globally in the human GI tract [25]. Intestinal miRNAs have experimentally proven biological roles ranging from the regulation of neonatal nutrient metabolism [26] to the control of intestinal fluid and electrolyte transport [27] and permeability [28], besides affecting intestinal epithelial cell differentiation [29] and maturation [30].
The intestinal miRNA signature has been found to be deregulated in various disease states. MiRNAs can display both oncogenic or tumor suppressive effects in several types of cancers [31], and recently 11 miRNAs were found to be differentially expressed in the sigmoid colon of patients with active ulcerative colitis (UC) versus healthy controls [32], with effects on secretion of pro-inflammatory chemokines [32].
In addition, both plants and animals differentially express miRNAs following sensing of pathogen-associated molecular patterns (PAMPs). For instance, bacterial flagellin-induced upregulation of miR-393 in Arabidopsis thaliana participates in the regulation of the host defense system [22]. In animals, specific miRNAs are induced in response to various bacterial components, such as lipopolysaccharide (LPS) in monocytes [33] and to viral infection such as in Hepatitis B and C [34]. Moreover, miR-155 is upregulated in gastric epithelial cells following Helicobacter pylori infection [35]. All of these changes resulted in downstream regulation of the immune response.
It has been recently suggested that the onset of several intestinal diseases including Inflammatory Bowel Disease (IBD) and Irritable Bowel Syndrome (IBS), are caused by both deregulation of the intestinal barrier function and by microbial factors [36,37], but how the two intertwine to affect such conditions is not well understood. The intestinal barrier is a multi-tiered line of defense localized at the interface between the external environment and internal milieu and comprises physical, chemical and receptor-mediated pathogen sensing components [38]. The endogenous gut microbiota is an important constituent of the barrier in that it not only participates in the formation of the physical and chemical barrier via pathogen exclusion, antimicrobial peptide secretion, and immuno-modulation, but also acts as a vector of change by modulating the mRNA expression of a number of genes involved in intestinal barrier function [9,7]. However, the epigenetic basis of these interactions is yet to be elucidated as there is a lack of studies evaluating modulation of host miRNAs in response to symbiotic microorganisms. Intriguingly, legumes miRNAs are modulated during the establishment and maintenance of the rhizobia symbiosis in root nodules [39]. Though, it is unknown if this is also true for animals who live in a symbiotic relationship with complex microbial communities at various body sites such as the intestine.
We used germ-free and conventionally raised mice to investigate the impact of the endogenous microbiota on the global expression of caecal miRNAs in vivo. We show that the murine miRNA signature in the caecum is comprised of several variously expressed species and that it is indeed affected by the presence of the microbiota. Moreover, we show that several of the putative mRNA targets of the modulated miRNAs encode for genes known to be involved in the regulation of the intestinal barrier function, including glycosylation enzymes, junctional proteins, proteins found in the mucus layers and genes involved in immune regulation.
Materials and Methods
Animals
Swiss Webster male mice were used according to the Regulations of the Animals for Research Act in Ontario and the Guidelines of the Canadian Council on Animal Care. Animal study design and procedures were approved by the animal ethics committee at the University of Toronto (Animal Use Protocol Number: 20008318). Five germ-free and five conventionally raised mice, 6 weeks of age, were obtained from Taconic Farms (Germantown, NY), sacrificed via cervical dislocation and then dissected in sterile conditions. Upon sacrifice, the entire caecum was immediately excised and caecal contents were collected. Caecal tissues were further cleaned with sterile 0.9 % NaCl, divided into two halves longitudinally, snap-frozen in liquid nitrogen and stored at -80°C until further processing. Caecal contents were immediately fixed in 4% paraformaldehyde and used to confirm the germ-free status of the animals by Fluorescence in situ Hybridization with the EUB338 5'-Cy3 labeled 16S rRNA probe specific for all bacteria (5'/5Cy3/GCT GCC TCC CGT AGG AGT-3') (Integrated DNA Technologies), as previously described [40].
RNA extraction
Small RNA-containing total RNA was extracted from one-half segment of the caecum from both germ-free (n = 5) and conventionally-raised (n = 5) mice, using miRVANATM miRNA Isolation Kit (Ambion, Austin, TX, USA), as per the manufacturer's instructions, eluted in 100 µl of RNAse-free water and stored at -80°C. Recovered total RNA concentration and purity were spectrophotometrically assessed using Thermoscientific's Nanodrop 1000 Spectrophotometer (Nanodrop Technologies, Wilmington, DE, USA) and ranged between 2.13-2.16 and 2.01-2.12, respectively. RNA integrity was confirmed by denaturing agarose gel electrophoresis.
Global microRNA expression profiling
cDNA was synthesized from 1 µg of total RNA (n = 3 per group) using the Taqman® MicroRNA Reverse Transcription Kit in conjunction with Rodent Megaplex™ Primer Pools according to the manufacturer's protocol (Applied Biosystems, CA, USA). The Rodent Megaplex™ Primer Pools contains two sets of microRNA-specific RT primers, pools A and B, that enable for the RT of 375 microRNAs/6 species-specific controls and 210 microRNAs/6 species-specific controls, respectively. Separate reactions were run for pools A and B in Applied Biosystems' GeneAmp® PCR System 2700 Thermocycler. Global microRNA expression profiling was conducted by TaqMan quantitative PCR using Applied Biosystems' Taqman® Rodent MicroRNA Array Set v2.0 (Taqman Low Density Arrays, TLDAs) that comprise two microfluidic cards (plates A and B) containing a total of 384 Taqman® Assays per card (some of which are duplicate probes). cDNA products from the Megaplex RT pools set were independently assessed on both microfludic cards with plate A enabling for the simultaneous quantification of 375 microRNA targets/6 controls while plate B, 210 microRNA targets/6 controls. The protocol suggested by the manufacturer was followed. Real-Time PCR was performed using an Applied Biosystems 7900 HT Real-Time PCR system and default thermal-cycling conditions for 384-wells Taqman Low Density Arrays.
Real-Time PCR validation of individual microRNAs expression
Ten ng of total RNA (n=5 per group) was reverse transcribed with the Taqman® MicroRNA Reverse Transcription Kit and primers specific for miR-455 (Assay ID: 002455) and the endogenous control snoRNA135 genes (Assay ID: 001230) (Applied Biosystems) in Applied Biosystems' GeneAmp® PCR System 2700 Thermocycler according to the manufacturer's protocol. Real time PCR was then conducted using undiluted cDNA, TaqMan MicroRNA Assays (miR-455 assay ID: 002455 and snoRNA135 assay ID: 001230) and the TaqMan 2X Universal PCR Master Mix, No AmpEraseUNGa (Applied Biosystems) in a 10 µl PCR reaction. Each reaction was run in triplicates in a 384-well optical plate in Applied Biosystems' 7900 HT Real-Time PCR machine using the 9600 emulation mode with an initial hold at 95°C for 10 minutes followed by 40 cycles of 95°C for 15 seconds, and 60°C for 60 seconds. Results were expressed as fold change between germ-free and conventional mice as calculated by ΔΔCt method [41] after normalization to sno-135 gene, which was shown to be equally expressed in the caeca of the two groups of mice by the TLDA experiments. Significance of differential gene expression was assessed with the Mann-Whitney test using GraphPad Prism 5 Software (La Jolla, CA, USA).
Analysis of TLDA data
Raw data were pre-processed in SDS 2.3 for individual plates and then concurrently for all plates in SDS RQ Manager 1.2 (Applied Biosystems) for the generation of Ct (Cycle threshold) values. A pre-selection filter was applied to all miRNA TLDA data to reduce noise in the dataset and to reduce the severity of the multiple testing adjustment. To this end, any miRNA not meeting both of the following criteria were removed from further analysis: a) Presence in all three of either conventional samples or the germ-free group; b) Presence in at least one of the conventional samples to enable the ΔΔCt method to be used for normalization. Following pre-filtering, all duplicate probes for the same miRNA species on the same plate were averaged and the mean Ct value was utilized for further analysis. Data were then normalized by “columnwise mean” normalization, such that the target miRNA is normalized to the mean Ct of all miRNA for each sample, a method that has been suggested as an improvement for high-throughput miRNA Quantitative PCR (qPCR) [42] where the mean abundance of hundreds of targets may be more stable than any endogenous control across samples and experimental groups. To identify differentially expressed genes, the empirical Bayes-moderate t-test was used as implemented in the LIMMA R package [43]. For this approach, missing Ct values were assumed to be unknown rather than imputed to 40, to avoid creating a bimodal distribution of Ct values, which would violate the assumption of the t-test. False discovery rate was calculated by the method of Benjamini and Hochberg, as implemented in the R package multtest (Pollard et al., v.1.22.0). Supervised heatmaps were created using the R package gplots. Clustering in the heatmaps is based on complete linkage and Euclidean as the distance metric, using default setting for the hclust (hierarchical cluster) function in R [44].
Analysis was performed in the R language and environment for statistical computing (R Development Core Team, 2008, v2.8.1) [45].
MiRNAs target prediction
To investigate the relationship between selected miRNAs of interest and the genes that they potentially target, we mapped them into a miRNA network using NAViGaTOR ver. 2.2 [46]. We first used high precision miRNA:target relationships in mouse - taken from the TargetScan Conserved Targets (Conserved_Sites_Context_Scores.txt Release 5.1) [47,48,49] or PITA TOP database predictions (PITA_targets_mm9_0_0_TOP.tab.gz, May 2010 download) [50]. Previous work examining miRNA:target relationships suggests that both PITA and TargetScan provide high quality interactions suitable for the construction of an interaction network [51]. Genes identified by this first analysis were then filtered based on their inclusion in an intestinal barrier gene set to assess the potential impact of differentially expressed miRNAs on the intestinal barrier function. A subset of 527 genes important in maintenance of the intestinal barrier function were identified and classified according to function - mainly physical, chemical and pathogen sensing components as per Cummings J. H., et al. [38] (Additional file 5: Table S5). Identified miRNA target genes were filtered by the intestinal barrier set prior to being mapped into the miRNA network. This reduced the number of initial miRNA target genes of the 11 miRNAs with predicted targets from 2,755 in the general setting to 34 present in the intestinal barrier setting.
Analysis of miRNA potential targets biological function
To further understand the functions of gene targets of miRNAs with altered expression in this study, we examined all 2,755 gene targets of the 11 miRNAs prior to the filtering step. Using the Panther Classification System Version 7.0 [52,53], we examined the over- or under- representation of our miRNA target genes compared to a universe consisting of all genes listed as miRNA targets in the PITA Top Targets or TargetScan Conserved Targets (as discussed above). Categories examined include Gene Ontology Classes: Biological Processes, Molecular Function, Cellular Component as well as Pathway Analysis and Protein Class Analysis.
Results
Differential expression of miRNAs in the caecum of germ-free and conventionally raised mice
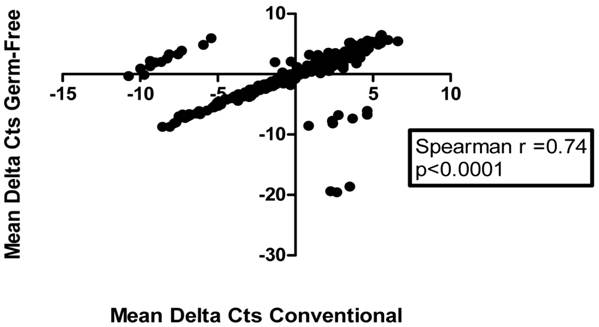
To assess if the caecal miRNA expression signature is associated with the presence of the endogenous microbiota, we examined small RNA-containing total RNA extracted from the caecum of germ-free (n=3) and conventionally raised mice (n=3). Each sample was independently run on two different Taqman Low Density Arrays (Plates A and B), which combined allow for the analysis of 585 mature miRNAs. Fifty-seven percent of the targeted miRNAs were detectable (Ct<35) in the caeca of both germ-free and conventionally raised mice (Additional file 1: Table S1). Ranked mean abundance of miRNAs was similar for both groups of mice (Spearman R=0.74, P< 0.0001, 95% CI= 0.68 to 0.78) (Figure 1).
Caecal global microRNA expression is correlated in germ-free and conventional mice. Scatter plot depicting the relationship between global miRNA expression levels of 336 miRNAs in germ-free (GF) and conventional (Conv) caecal samples (n=3/group) as assessed by qRT-PCR and TLDA plates A and B. Data are presented as mean delta Ct values for each miRNA (mean delta Cts represent the average delta Ct for all three samples/group, with each individual Ct normalized by mean expression value normalization procedure). Of the 585 miRNA species analyzed, 336 remained after filtering and normalization, as explained in Materials and Methods and were used in subsequent analyses.
We found 18 transcripts differentially expressed between the two groups, including both up- and down-regulated miRNAs with a fold change (germ-free vs. conventional) ranging between 0.2 and 4.6 (Table 1) (False Discovery Rate = 0.2). These correspond to 16 unique miRNAs, including mmu-miR-351 and rno-miR-351 - two sequences conserved in mouse and rat - while Y1 is a rat endogenous small RNA. A second rat miRNA species, rno-miR-664, was found to be significantly up-regulated by 2.85-fold in germ-free samples. The murine homolog, mmu-miR-664, is not represented on the TLDA plates that we used. Sequence analysis using miRviewer [54] demonstrates that miR-664-1 shows sequence similarity in rat, mouse and horse with a greater conservation amongst rat and mouse. Therefore, it is likely that the measured signal is biologically reliable and derives from cross-reaction of the rno-miR-664 TaqMan assay with the homologous murine miRNA species. Five of the sixteen transcripts correspond to passenger miRNA (miRNA*) sequences. Up-regulation of miR-455 in germ-free versus conventional mice was confirmed in a separate experiment using gene-specific single-well TaqMan PCR and RNA from the caecum of five mice per group (fold change germ-free versus conventional=1.7, Mann-Whitney test p=0.0079).
Differentially expressed microRNA in germ-free versus conventional mice. Real-time PCR analysis of the global expression of microRNAs in the caecum of germ-free (GF) (n=3) versus conventional (CONV) mice (n=3). Fold-change and statistical significance were calculated after mean expression value normalization. Statistical significance is based on Bayes-moderated t-test with a FDR of 20%. In total 18 transcripts were found to be differentially expressed between the two groups with 16 unique mature microRNAs (Y1 is a rat endogenous small RNA). Fold change corresponds to the ratio of mean expression of the microRNA in GF mice to mean expression in CONV mice. Values < 1 indicate lower expression in GF (down-regulated in GF mice compared to CONV mice), whereas values > 1 indicate higher expression in GF (up-regulated in GF mice compared to CONV mice). Genomic locations and corresponding microRNA sequences (5' - 3') are based on miRBase version 16. Homology of microRNA sequences between diverse species is derived from miRviewer (last updated November 9, 2008).
| miRNA | Fold GF vs. Conv | Adjusted P-values | Genomic Location | Mature miRNA Sequence (5' - 3') | Homology |
|---|---|---|---|---|---|
| mmu-miR-21* | 0.20 | 0.06 | chr11: 86397569-86397660 [-] | 56 -CAACAGCAGUCGAUGGGCUGUC - 77 | NA |
| rno-miR-351 | 0.31 | 0.06 | chrX: 139999130-139999210 [-] | 16 -UCCCUGAGGAGCCCUUUGAGCCUGA- 40 | Mmu, Rno |
| mmu-miR-351 | 0.33 | 0.20 | chrX: 50406432-50406530 [-] | 16 -UCCCUGAGGAGCCCUUUGAGCCUG- 39 | Mmu, Rno |
| mmu-miR-487b | 0.45 | 0.12 | chr12: 110965543-110965624 [+] | 50 -AAUCGUACAGGGUCAUCCACUU- 71 | Mmu, Rno, Hsa, Ptr, Mml, Str, Bta, Laf |
| mmu-miR-467a -1 mmu-miR-467a -2 mmu-miR-467a -3 mmu-miR-467a -4 mmu-miR-467a -5 mmu-miR-467a -6 mmu-miR-467a -7 mmu-miR-467a -8 mmu-miR-467a -9 mmu-miR-467a -10 | 0.47 | 0.06 | chr2: 10397973-10398045 [+] chr2: 10400425-10400507 [+] chr2: 10405305-10405387 [+] chr2: 10407762-10407844 [+] chr2: 10410226-10410308 [+] chr2: 10412675-10412757 [+] chr2: 10415137-10415219 [+] chr2: 10417607-10417689 [+] chr2: 10420020-10420102 [+] chr2: 10424900-10424982 [+] | 10 -UAAGUGCCUGCAUGUAUAUGCG- 31 15 -UAAGUGCCUGCAUGUAUAUGCG- 36 15 -UAAGUGCCUGCAUGUAUAUGCG- 36 15 -UAAGUGCCUGCAUGUAUAUGCG- 36 15 -UAAGUGCCUGCAUGUAUAUGCG- 36 15 -UAAGUGCCUGCAUGUAUAUGCG- 36 15 -UAAGUGCCUGCAUGUAUAUGCG- 36 15 -UAAGUGCCUGCAUGUAUAUGCG- 36 15 -UAAGUGCCUGCAUGUAUAUGCG- 36 15 -UAAGUGCCUGCAUGUAUAUGCG- 36 | Mmu |
| mmu-miR-27b* | 0.54 | 0.16 | chr13: 63402020-63402092 [+] | 7 -AGAGCUUAGCUGAUUGGUGAAC- 28 | NA |
| mmu-miR-148a | 0.58 | 0.12 | chr6: 51219811-51219909 [-] | 61 -UCAGUGCACUACAGAACUUUGU- 82 | Mmu, Hsa, Ptr, Ppy, Mml, Oga, Cpo, Ocu, Opr, Bta, Cfa, Eca, Eeu, Fca, Laf, Tbe, Mlu, Mdo, Gga, Xtr |
| mmu-miR-145 | 1.52 | 0.17 | chr18: 61807479-61807548 [-] | 7 -GUCCAGUUUUCCCAGGAAUCCCU - 29 | Mmu, Rno, Hsa, Ptr, Ppy, Mml, Mim, Oga, Cpo, Ocu, Opr, Sar, Str, Bta, Cfa, Dno, Eca, Eeu, Ete, Fca, Tbe, Mlu, Mdo, Oan, Dre, Gac, Tru, Xtr |
| mmu-miR-183 | 1.56 | 0.17 | chr6: 30119668-30119737 [-] | 6 -UAUGGCACUGGUAGAAUUCACU- 27 | Mmu, Rno, ,Hsa, Ptr, Ppy, Mml, Mim, Oga, Opr, Sar, Str, Bta, Cfa, Dno, Eca, Ete, Fca, Tbe, Mlu, Mdo, Oan, Gga, Dre, Gac, Ola, Tni, Tru, Xtr, Cin |
| mmu-miR-133a -1 mmu-miR-133a-2 | 1.61 | 0.12 | chr18: 10782907-10782974 [-] chr2: 180133084-180133187 [+] | 43 -UUUGGUCCCCUUCAACCAGCUG- 64 59 -UUUGGUCCCCUUCAACCAGCUG- 80 | miR-133a-1: Mmu, Hsa, Ptr, Cpo, Ocu, Opr, Sar, Str, Bta, Cfa, Dno, Eca, Eeu, Ete, Fca, Tbe, Gga, Dre, Gac, Ola, Tru miR-133a-2: Mmu, Hsa, Ptr, Gga, Dre |
| mmu-miR-150 | 1.66 | 0.15 | chr7: 52377127-52377191 [+] | 6 -UCUCCCAACCCUUGUACCAGUG- 27 | Mmu, Rno, Hsa, Ptr, Ppy, Mml, Mim, Opr, Sar, Str, Bta, Cfa, Eca, Fca, Tbe, Oan, Dre, Ola, Xtr |
| Y1-4386739.B | 2.02 | 0.15 | NA | NA | NA |
| mmu-miR-672 | 2.74 | 0.06 | chrX: 101311514-101311613 [-] | 25 -UGAGGUUGGUGUACUGUGUGUGA- 47 | Mmu, Rno, Mim, Oga, Cpo, Ocu, Str, Dno, Eca, Ete, Cin |
| mmu-miR-181a-1* | 2.79 | 0.17 | chr1: 139863032-139863118 [+] | 54 -ACCAUCGACCGUUGAUUGUACC- 75 | NA |
| rno-miR-664 -1 rno-miR-664-2 | 2.85 | 0.06 | chr18: 47881354-47881412 [+] chr13: 101253993-101254051 [+] | 38 -UAUUCAUUUACUCCCCAGCCUA- 59 38 -UAUUCAUUUACUCCCCAGCCUA- 59 | miR-664-1: Mmu, Rno, Eca miR-664-2: Rno, Laf |
| mmu-miR-455 | 3.00 | 0.15 | chr4: 62917885-62917966 [+] | 54 -GCAGUCCACGGGCAUAUACAC- 74 | Mmu, Rno, Hsa, Ptr, Ppy, Mml, Mim, Oga, Cpo, Ocu, Opr, Str, Bta, Cfa, Eeu, Ete, Fca, Laf, Mlu, Mdo, Gga, Dre, Gac, Ola, Tni, Tru, Xtr |
| mmu-miR-138* | 4.43 | 0.12 | chr9: 122591994-122592092 [+] | 61 -CGGCUACUUCACAACACCAGGG- 82 | NA |
| mmu-let-7g* | 4.60 | 0.10 | chr9: 106081171-106081258 [+] | 63 -ACUGUACAGGCCACUGCCUUGC- 84 | NA |
Analysis of miRNA conservation and their genomic contexts revealed that all of the significantly differently expressed miRNAs belong to various families and cluster separately in terms of their genomic locations with the exception of miR-351 in which both rat miRNA (rno-miR-351), and murine miRNA (mmu-miR-351) were found to belong to the same mir-351 family, based on sequence conservation [13].
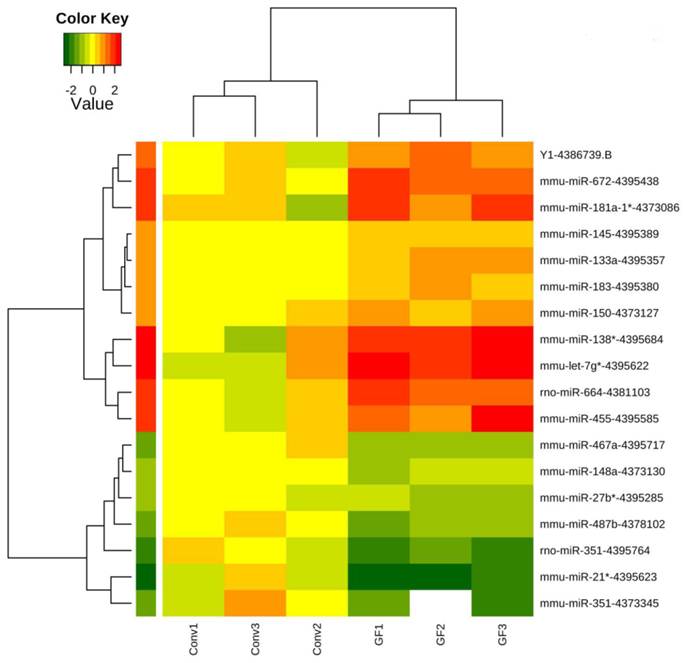
Furthermore, supervised hierarchical clustering analysis using the 18 differentially expressed transcripts demonstrated intra-group similarities in miRNA expression with inter-group variation in miRNA expression (Figure 2), showing that the caecal miRNA signatures cluster according to the presence or absence of the endogenous microbiota.
Clustering of caecal microRNAs expression profiles in germ-free and conventionally raised mice. The profiles of 18 transcripts including 16 microRNAs significantly differently expressed (p<0.05, FDR<20%) between germ-free and conventional caecal samples were visualized using a supervised heatmap (complete linkage and Euclidean distance metric). Expression values range from +2.5 log2 to -2.5 log2 of ∆Ct values normalized using mean expression value normalization with positive values (red) indicating higher expression and negative values (green) indicating lower expression in germ-free versus conventional mice. Dendrograms indicate the correlation between groups of samples and genes. Samples are in columns and transcripts in rows.
Experimentally verified and predicted mRNA targets of the differentially expressed miRNAs
Based on Tarbase V5.0 [55] and miRecords V2.0 [56], two freely available databases that provide a repository of information pertaining to experimentally validated miRNA targets in several animal species, plants and viruses, six (miR-133a, miR-672, miR-183, miR-148a, miR-145, miR-150) of the sixteen differentially expressed miRNAs have experimentally verified mRNA targets (Additional file 2: Table S2). Of these mRNA targets, seven (Serum response factor (Srf), Ras homolog gene family, member A (Rhoa), Cell division cycle 42 homolog (S. cerevisiae) (Cdc42), Peroxiredoxin 6 (PRDX6), Homeo box A9 (Hoxa9), Vascular endothelial growth factor A (Vegfa), and Myeloblastosis oncogene (Myb) were detected with a signal intensity higher than 150 in microarray experiments analyzing gene expression in C57BL/6 mice caeca (n=2) (Gene Expression Omnibus [57] dataset GSE1133 [58]). Therefore, based on the miRNA/mRNA co-expression criterion for target validation [59], these genes are good candidates for microbiota-dependent expression modulation via miRNA.
However, each miRNA species is likely to have multiple physiologically relevant targets, most of which are unknown, and several algorithms can be employed for their in silico identification. To predict targets for the 16 miRNAs found to be differentially expressed between germ-free and conventional mice, we adopted a conservative approach. We extracted target predictions from 2 sources: Probability of Interaction by Target Accessibility (PITA) [50] and TargetScan [47,48,49]; thus, our target prediction sets are based on several criteria including conservation of target binding sites and the degree of accessibility of the three prime untranslated regions of the mRNA target. Two thousand seven hundred and fifty-five unique genes were found to map as targets of these miRNAs as predicted by both algorithms (Additional file 3: Table S3). These genes were mapped to PANTHER database [52] to assess their group descriptors. We first considered the Gene Ontology classifications and found our gene list to be significantly enriched in several categories: (1) biological processes including development, cell communication, signal transduction (all at p<0.0001), among others; (2) molecular functions including DNA, transcription factor, protein binding (all at p<0.0001), among others; and (3) cellular components such as actin cytoskeleton (p<0.0001) (Additional file 4: Table S4). Next, we found our targets enriched in the Wnt signaling pathway, angiogenesis, transforming growth factor-beta (TGF-β) and cadherin signaling pathways and in the transcription factors protein class followed by enzyme modulator and ribosomal proteins (all at p<0.0001), among others (Additional file 4: Table S4). Several of the 2,755 global putative targets of the differentially expressed miRNAs were found to map to diverse components of the intestinal barrier function when assessing gene ontologies. These include; (1) Biological Processes such as cell-cell adhesion (p<0.0001), immune system processes (p<0.001) encompassing antigen processing and presentation (p<0.01) and defense response to bacterium (p<0.2) amongst others; (2) Molecular Functions including structural constituents of cytoskeleton (p<0.0001) and (3) Cellular Components such as actin cytoskeleton (p<0.0001), MHC protein complex (p<0.01), cell junction (p<0.01) as well as other factors (Additional file 4: Table S4). Similarly, identification of the inflammation mediated by chemokine and cytokine signaling pathway (p<0.001) during functional analysis of in silico data demonstrate potential implications of microbial-dependent miRNA regulation on the intestinal barrier function.
MiRNA-dependent regulation of the intestinal barrier function by the endogenous microbiota
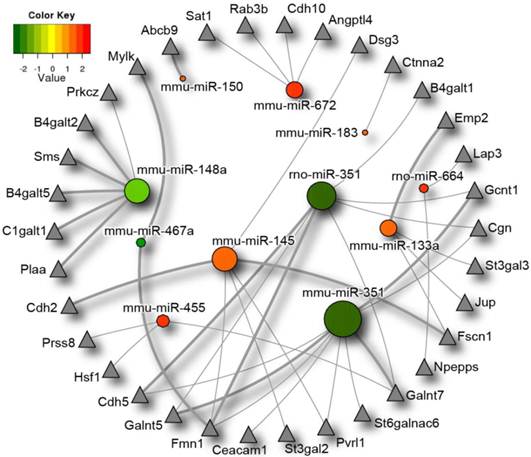
Considering the results described above, and the fact that endogenous microbes play an important role in the creation and maintenance of the intestinal barrier we decided to investigate the potential impact of the microbiota-responsive miRNAs on the intestinal barrier function via analysis of intestinal barrier specific gene targets. We first compiled a gene set containing 527 genes involved in the regulation of the intestinal barrier function, as explained in Materials and Methods, which we called the “Intestinal Barrier Gene Set”. The list of genes included in this gene set is provided as (Additional file 5: Table S5). We then filtered the 2,755 target genes by this pre-defined gene set and established all miRNA:target interactions for the remaining genes. Using NAViGaTOR (Network Analysis, Visualization and Graphing Toronto) ver. 2.2 [46], a scalable, network analysis and visualization system, we mapped the miRNA network linking our identified miRNA of interest in order to examine the micronome, as described before [51] (Figure 3). miR-487b did not have any intestinal barrier targets as per the algorithms employed and therefore it does not appear in the figure. Thirty-four intestinal barrier-related genes were found to be among the potential targets of the intestinal miRNAs the expression of which depends on the endogenous microbiota, and fifteen of these were identified by both algorithms. These include genes involved in glycosylation, cell-cell junction formation, the mucus layer and genes involved in immune regulation particularly MHC I and II proteins amongst others. Closer inspection of this miRNA interaction network reveals several genes co-targeted by the miRNAs identified as differentially expressed between the caecal miRNA signatures in germ-free and conventional mice. Formin 1 (FMN1) is co-targeted by 2 miRNAs down-regulated in the germ-free mice (miR-351 and miR-467a) as well as one up-regulated miRNA (miR-145). Other genes appearing to be co-targeted by multiple differentially expressed miRNAs are: Cadherin 5 (Cdh5), UDP-N-acetyl-alpha-D-galactosamine:polypeptide N-acetylgalactosaminyltransferase 5 (Galnt5), poliovirus receptor-related 1 (Pvrl1), fascin homolog 1, actin bundling protein (Fscn1), Cingulin (Cgn), glucosaminyl (N-acetyl) transferase 1, core 2 (Gcnt1) and UDP-N-acetyl-alpha-D-galactosamine: polypeptide N-acetylgalactosaminyltransferase 7 (Galnt7). Of the thirty-four predicted intestinal barrier genes targets, twenty had been previously found to be expressed in the caeca of C57BL/6 mice (n=2), in microarray experiments with a hybridization signal higher than 150 (ATP-binding cassette, sub-family B (MDR/TAP) member 9 (Abcb9), Nicastrin (Ncstn), Spermidine/spermine N1-acetyl transferase 1 (Sat1), Desmoglein 3 (Dsg3), UDP-Gal:betaGlcNAc beta 1,4- galactosyltransferase, polypeptide 1 (B4galt1), Leucine aminopeptidase 3 (Lap3), beta-1,3-galactosyl-O-glycosyl-glycoprotein beta-1,6-N-acetylglucosaminyltransferase (Gcnt1), CMP-N-acetylneuraminate-beta-1,4-galactoside alpha-2,3-sialyltransferase (St3gal3), Junction plakoglobin (Jup), Aminopeptidase puromycin sensitive (Npepps), UDP-N-acetyl-alpha-D-galactosamine: polypeptide N-acetylgalactosaminyltransferase 7 (Galnt7), Plakophilin 1 (Pkp1), (alpha-N-acetyl-neuraminyl-2,3-beta-galactosyl-1,3)-N-acetylgalactosaminide alpha-2,6-sialyltransferase 6 (St6galnac6), Carcinoembryonic antigen-related cell adhesion molecule 1 (Ceacam1), Formin-1 (Fmn1), Prostasin (Prss8), glycoprotein-N-acetylgalactosamine 3-beta-galactosyltransferase 1 (C1galt1), UDP-Gal:betaGlcNAc beta 1,4-galactosyltransferase, polypeptide 5 (B4galt5), UDP-Gal:betaGlcNAc beta 1,4- galactosyltransferase, polypeptide 2 (B4galt2), Myosin, light polypeptide kinase (Mylk) (Gene Expression Omnibus [57] dataset GSE1133 [58]). This list is conservative, since not all of the genes shown in Figure 3 had microarray probes.
Differentially expressed microRNAs impact on the intestinal barrier. MicroRNAs significantly differentially expressed between germ-free and conventional mice are represented in this diagram by circles, with the colour corresponding to degree of differential microRNA expression in germ-free and conventional samples. Expression values range from +2.5 log2 to -2.5 log2 of ∆Ct values with positive values (red) indicating higher expression, and negative values (green), indicating lower expression in germ-free versus conventional mice. Putative intestinal barrier gene targets as identified by the algorithms TargetScan and PITA are represented by triangles. MicroRNAs with a greater number of intestinal barrier targets are symbolized with a larger circle size. Intestinal barrier gene targets that are predicted by both algorithms are indicated by thicker lines. Differentially expressed microRNAs* were not included in the diagram as they are not present in both prediction databases. miR-487b did not have any intestinal barrier targets as per the algorithms and therefore was excluded from the figure.
Seventy one percent of the genes included in our gene set were not considered by PITA and TargetScan due to the low conservation of the 3'UTR in homologous genes. Moreover, this analysis did not incorporate passenger miRNAs because they are not considered in PITA and TargetScan databases. Alternatively, when using MicroCosm targets [13] to map these, only miR-let7g* had targets remaining after filtering with the intestinal barrier gene set. These are: C1GALT1-specific chaperone 1 (C1galt1c1), Claudin-7 (Cldn7), Histocompatibility 2, class II antigen A, beta 1 (H2-Ab1), Pancreatitis-associated protein (Pap), Phospholipase A2, group XIIA (Pla2g12a), Phospholipase A2, group IB (Pla2g1b), Spermidine synthase (Srm), Thimet oligopeptidase 1 (Thop1), Toll-like receptor-11 (Tlr11) and Toll-like receptor-13 (Tlr13).
Finally, in order to substantiate the hypothesis that gut commensals impact the intestinal barrier via miRNA expression modulation, we crossed-matched our global list of intestinal barrier genes with genes previously identified to be differentially expressed in the jejunal mucosa of intestinal-specific Dicer knock-out mice [60]. The result of this analysis provides experimental evidence that miRNAs indeed impact on barrier-related gene expression, with potential repercussions on its function. Of particular interest are intestinal barrier genes from our list that were found to be experimentally perturbed (up- or down-regulated) by the conditional knock-out of Dicer [60]. They include: glycosylation enzymes, immuno-inflammatory response genes, components of MHC I and II, junctional proteins, mucus layer associated proteins and defense response proteins, including antimicrobial peptides and Pathogen Associated Molecular Pattern (PAMP) responsive elements. Although, this analysis shows that miRNAs affect genes that comprise the intestinal barrier, in order to further establish a nexus between microbial induced modulation of miRNAs, which in turn affects barrier function, we combined putative barrier related gene targets of the microbial dependent miRNAs (Figure 3) with the Dicer knock-out mice data [60]. Among the genes differentially expressed in the absence of miRNAs in the jejunal mucosa, we found that seven intestinal barrier related genes were either up-regulated (glycoprotein-N-acetylgalactosamine 3-beta-galactosyltransferase 1 (C1galt1), myosin, light polypeptide kinase (Mylk), Aminopeptidase puromycin sensitive (Npepps), UDP-N-acetyl-alpha-D-galactosamine: polypeptide N-acetylgalactosaminyltransferase 7 (Galnt7) and Prostasin (Prss8)), or down-regulated (protein kinase C zeta isoform a (Prkcz), beta-1,3-galactosyl-O-glycosyl-glycoprotein beta-1,6-N-acetylglucosaminyltransferase (Gcnt1)). More specifically, since these seven genes are in silico targets of the miRNAs modulated by the absence or presence of the microbiota (germ-free versus conventional mice) and experimental evidence points to a role of epigenetic regulation of these genes via miRNAs (Dicer knock-out study) it reiterates a potential novel mechanism of host-microbial cross-talk via microbial dependent regulation of miRNAs that may translate into effects on the host with respect to regulation of the intestinal barrier function.
Discussion
Gene expression modulation is one of the mechanisms underlying the cross-talk between gut endogenous microbiota and host epithelium, and therefore plays a critical role in intestinal homeostasis. Here we show that the presence of the microbiota in the murine intestinal tract, particularly in the caecum, also associates with a distinctive miRNA signature, supporting a role for gut endosymbionts in post-transcriptional regulation of gene expression. Few studies have looked at the relative expression of miRNAs along the cephalocaudal axis of the healthy gut, particularly with respect to the passenger miRNA* forms, and to the best of our knowledge, this is the first study examining miRNA expression in the murine caecum. We found a characteristic micronome in the caecum, with 334 miRNA species expressed in this region in both germ-free and conventional mice; of these, 74 are miRNA* forms. While miRNAs* are thought to correspond to the rapidly degraded strand of the miRNA duplex, there is evidence suggesting that they may play a so-far unrecognized role within cells [24], and in fact may act in a similar fashion to guide strand miRNAs in terms of abundance and gene regulation [61].
Comparison of the global murine miRNA signature along several intestinal loci, namely the small and large intestinal mucosa, as well as our caecal analysis allows for certain parallels to be drawn. Some of the miRNAs belonging to the 15 miRNAs/miRNA families most expressed in the jejunal and colonic mucosa [60] are also expressed in the caeca of both germ-free and conventional mice (Additional file 6: Table S6) and 3 (miR-192, miR-378, miR-29a) of the 15 miRNAs most highly expressed (based on Ct values) in the caecum are also expressed in both the jejunum and colon [60]. Although diverse genes cannot be compared by Ct values, sorting allows for a qualitative measure of the relative level of gene expression and to identify genes that do or do not display a regional expression pattern within the intestine. miR-143 and miR-145 were part of the top expressed miRNAs in common between the jejunum and caecum, and are found in the same genomic cluster (<10kb distance from one another on chromosome 18). miR-200b was found in common as a highly expressed miRNA within both the large intestine and caecum. Interestingly, other miRNAs with sequence similarities to miR-200b were also found to be highly expressed, including miR-200a in the colon, and miR-200c in the caecum, suggesting that members of the miR-8 family play an important physiological role in distal intestinal regions. On the other hand, 19 miRNAs were found to be expressed in the caecum of conventional mice (Ct<35) but not in the jejunal or colonic mucosa based on the absence of sequence read data [60] in either of the two regions (Additional file 6: Table S6), suggesting they may be restricted to the caecum. Intergroup comparisons between germ-free and conventional mice illustrate a relatively high degree of similarity between the top miRNAs expressed in germ-free and conventional caeca with all 15 of the miRNAs with the lowest Ct values overlapping between the two groups (Additional file 6: Table S6). Moreover, there is a general concordance between the murine caecal micronome and the human intestinal micronome, which incorporates the caecum. Juxtaposing data on the 13 most highly constitutively expressed miRNAs in both the terminal ileum and colon (caecum, transverse colon, sigmoid colon and rectum) from pinch biopsy samples of healthy adults [25] with the murine caecal miRNA signature of conventional and germ-free mice, revealed that, five miRNAs (miR-143, miR-192, miR-200b, miR-200c and miR-24) found in the intestines of humans were amongst the top 15 mostly highly expressed miRNAs in the murine caecum based on Ct values (Additional file 6: Table S6). Moreover, miR-19b which was found to have a 3.2-fold higher expression in the caecum versus the terminal ileum from biopsied samples in humans, was also found, based on our aforementioned analysis, to be part of the 15 most highly expressed miRNAs in the murine caecum (germ-free and conventional mice) but not within the jejunal or colonic mucosa, suggesting this miRNA may exert a more profound effect within the caecum. Although our analysis of miRNA expression between intestinal regions in the mouse is qualitative and cannot be used to determine fold differences in expression, it gives merit into using the mouse as a model organism to investigate intestinal miRNAs as certain parallels can be found in humans.
The expression of these miRNAs may be under genetic and environmental control. The latter is particularly important in the case of the intestine where the epithelium engages in a continuous cross-talk with the luminal microbes. Here we show that indeed the endogenous microbiota contributes to the physiological miRNA signature in the caecum, which results in 16 miRNAs being differentially expressed between germ-free and conventionally raised mice. Moreover, of these, miR-133a and miR-467a were found to be caecal specific miRNAs when compared with the jejunum and colonic mucosa and miR-145 was a non-selectively expressed miRNA with high levels of expression along the intestine, insinuating a role for microbial control of both regional specific and globally expressed miRNAs that may transcend the boundaries of the caecum. Host miRNA modulation has been so far observed in response to pathogenic insults including prions [62], viruses such as Hepatitis B and C [34] and influenza virus [63], bacteria such as Helicobacter pylori [64], Francisella novicida [65] and Gram negative bacteria LPS [66], the yeast Candida albicans [67] or parasites such as Cryptosporidium parvum [68] and Toxoplasma gondii [69]. To our knowledge, the only host-microbe symbiotic relationship associated to miRNA modulation in the host is the legume-rhizobium symbiosis [39]. While we used whole-thickness caeca, and therefore could not establish the cellular origin of our measured signals, a previous study revealed that at least nine human miRNAs (hsa-miR-145, hsa-miR-150, hsa-miR-133a, hsa-miR-148a, hsa-miR-183, hsa-let-7g*, hsa-miR-181a*, hsa-miR-21*, hsa-miR-27b*) that have sequence homology with our differentially expressed murine miRNA are indeed expressed in colorectal cell lines [24], suggesting that the intestinal epithelial monolayer is susceptible of responding to the endogenous symbionts or their products, by miRNA modulation.
To date limited information is available on the biological role of these miRNAs; however, several of the miRNAs found to be differentially expressed in this study are known to be altered in cancer states. miR-148a, which we found to be expressed more highly in conventional mice, was found to be more highly expressed in tumor samples versus normal colonic epithelium [24], while miR-133a and miR-145, which we found to be more highly expressed in germ-free mice, were shown to exhibit significantly higher levels of expression in normal versus tumor tissues [70,71,72]. There is a general consensus in the literature that endogenous gut microbes can alter colon cancer susceptibility and germ-free rats were found to develop less and smaller tumors than their conventional counterparts when using a protocol that induces colorectal cancer [73]. This was attributed to enhanced anticancer immune response. In our study, a novel pathway may be proposed that incorporates microbe signaling to the host and can alter the expression of tumor-suppressors or oncogenes post-transcriptionally via miRNA regulation. Indeed, miR-145 and miR-133a were both predicted by multiple algorithms to target Fascin-1 (FSCN1) (Figure 3), a gene involved in actin cytoskeleton assembly, the down-regulation of which was experimentally found to explain the tumor suppressive effects of miR-145 and miR-133a in bladder, esophageal squamous cell and breast carcinomas [71,74,75].
However, inferring a microbiota-dependent physiological role for differentially modulated miRNA species depends on the identification of their mRNA targets in the caecum. Six of the endogenous microbiota-dependent miRNAs were experimentally proven in previous studies to target various genes, some of which are expressed in the caecum. These genes are categorized in various Gene Ontology classes including development, DNA binding, protein binding, transcription as well as signaling pathways including Wnt receptor signaling suggesting that the microbiota may be an additional factor controlling these functions. These findings are also in line with our PANTHER analysis where experimentally validated targets that are co-expressed in the caecum also map to some of the same functions of the targets predicted in silico.
Moreover, PANTHER, TargetScan and PITA findings collectively reinforce the role that gut bacteria play in organization of the actin cytoskeleton and gut angiogenesis, both previously shown to be affected by gut bacteria at the transcriptional (mRNA) level [9,7,76] suggesting that the impact of gut bacteria on specific pathways is many-sided. Particularly, in terms of angiogenesis, global pathway analysis of targets affected by the microbiota-dependent miRNAs illustrate effects on angiogenesis including the process of angiogenesis (p= 4.56E-13) itself and the Vascular Endothelial Growth Factor (VEGF) signaling pathway (p=7.67E-3). Although both the microbiota [76] and miRNAs [77] have been independently shown to affect vascularization, in silico findings in this study establish a possible link between them, and demonstrate a potential mechanism in which the molecular dialogue between gut bacteria and the host is carried out to affect these functions. Gut bacteria are important in the formation of the intestinal vascular network during postnatal development [76] and miRNAs in general are known to be developmentally regulated. Since the gut microbiota gradually establishes during postnatal life, it is possible for the two processes to intertwine. Indeed, a recent study showed that exposure to LPS from endogenous E. coli in the developing gut of the murine neonate, results in toll-like receptor-4 mediated expression of miR-146a and subsequent down-regulation of interleukin-1 receptor-associated kinase 1 (IRAK1) and the creation of an immunologically tolerant environment [78]. Future studies could examine the postnatal expression pattern of the differentially expressed miRNAs and of their target genes.
Several studies have shown microbial dysbiosis and miRNA deregulation to be important culprits in a number of digestive diseases, including irritable bowel syndrome [36,28] and ulcerative colitis [79,32]. Though, it is not understood if and how the two associate to impact these conditions. Based on our findings, we suggest that deregulation of the microbial composition in digestive diseases may at least partially affect the miRNA expression signature, and in turn influence the associated pathologies. One line of evidence involves miR-455, which in our study was found to be up-regulated in the caecum of germ-free mice, and found to target heat-shock factor 1 (hsf1) based on bioinformatics analysis. Hsf1 attenuates the effects of experimentally induced colitis in mice models via indirectly inhibiting the production of pro-inflammatory cytokines, cellular apoptosis and cell adhesion molecule induction [80]. Although the authors did not take into account both the microbiota and miRNAs in these mice models we speculate that altered microbial composition in these disease states may affect miRNAs that in turn impact on hsf1 with potential repercussions on gastrointestinal disease states.
In both a healthy situation and disease state one of the primary lines of defense in the gastrointestinal tract is the intestinal barrier, of which the gut microbiota is a critical component. Though, at the same time gut microbes act as a regulator of the barrier function at the mRNA level, by impacting the expression of several genes. Recently, genes regulating the intestinal barrier were found to be differentially expressed in the jejunum of intestinal-specific Dicer knock-out mice, highlighting a role for intestinal miRNAs in the regulated expression of intestinal barrier genes [81]. In line with this finding, we found that a number of genes included in our intestinal barrier gene set are indeed regulated post-transcriptionally in Dicer knock-out mice and therefore depend on miRNAs. Interestingly, these genes are also the potential targets of gut microbiota-dependent miRNAs (Figure 3). These were identified despite a stringent approach excluding 376 of our intestinal barrier genes which are not reported in the PITA and TargetScan databases. Further supporting the existence of an intestinal barrier regulatory network involving miRNAs and the gut microbiota, some of the intestinal barrier genes targeted by our selected miRNAs were found to be up- or down-regulated in Dicer 1-deficient mice versus controls [60], suggesting that the microbiota can indirectly impact on the intestinal barrier post-transcriptionally via miRNA regulation. Though, it is important to note that in this study we used whole thickness tissues in order to obtain a comprehensive evaluation of the intestinal miRNA signature response to the commensals.
Physiologically, the basis of this dialogue has yet to be established; nonetheless, an emerging concept incorporates the utilization of toll-like receptors (TLRs) as potential mediators. For example, miR-147 was found to respond to LPS stimulation of TLR4 in murine peritoneal macrophages, resulting in an attenuated release of Interleukin-6 (IL-6) and Tumour Necrosis Factor alpha (TNF-α) [82]. Moreover, miR-146a was also reported to dampen the inflammatory response upon up-regulation through PAMP activated TLRs [83,33]. In turn, these studies show applicability of microbial alterations in miRNA which can impact the barrier function. Therefore, it seems plausible that TLRs which are localized at the interface between the microbiota and the molecular machinery of host cells may be a potential facilitator of this communication.
In summary, this study shows that the murine caecum expresses a large variety of miRNAs, sixteen of which exhibit differential expression in the presence or absence of the endogenous microbiota. Therefore, gut bacteria may impact on intestinal gene regulation not only at the transcriptional level but also post-transcriptionally; thus, contributing to intestinal homeostasis through fine-tuning gene expression. By modulating miRNAs, the gut microbiota may affect a much larger number of genes than so far expected, particularly in a disease situation where the microbiota composition is altered towards less desirable species. In this perspective, abnormally expressed miRNAs could be considered novel therapeutic targets.
Acknowledgements
The authors would like to thank Wen Su and Stefania Arioli for help with dissections and fluorescence in situ hybridization. This study was funded by the J. P. Bickell Fdn Medical Research Program. Computational analyses were in part supported by Ontario Research Fund (GL2-01-030), Canada Foundation for Innovation (CFI #12301 and CFI #203383), and Canada Research Chair Program. NS was in part supported by an Ontario Graduate Scholarship (OGS).
Supplementary Material
Additional File 1Table S1. Detection levels of 336 mature miRNAs expressed in the caecum of conventionally raised and germ-free mice.
Table S2. Experimentally validated microRNA targets.
Table S3. List of putative targets of the differentially expressed miRNAs.
Table S4. Panther enrichment analysis of the putative targets of differentially expressed miRNAs.
Table S5. Intestinal barrier gene set.
Table S6. Top expressed miRNAs.
References
1. Costello EK, Lauber CL, Hamady M. et al. Bacterial community variation in human body habitats across space and time. Science. 2009;326:1694-1697
2. Witkin SS, Linhares IM, Giraldo P. Bacterial flora of the female genital tract: function and immune regulation. Best Pract Res Clin Obstet Gynaecol. 2007;21:347-354
3. Marteau P, Pochart P, Dore J. et al. Comparative study of bacterial groups within the human cecal and fecal microbiota. Appl Environ Microbiol. 2001;67:4939-4942
4. Kibe R, Sakamoto M, Hayashi H. et al. Maturation of the murine cecal microbiota as revealed by terminal restriction fragment length polymorphism and 16S rRNA gene clone libraries. FEMS Microbiol Lett. 2004;235:139-146
5. Leser TD, Molbak L. Better living through microbial action: the benefits of the mammalian gastrointestinal microbiota on the host. Environ Microbiol. 2009;11:2194-2206
6. Denou E, Berger B, Barretto C. et al. Gene expression of commensal Lactobacillus johnsonii strain NCC533 during in vitro growth and in the murine gut. J Bacteriol. 2007;189:8109-8119
7. Hooper LV, Wong MH, Thelin A. et al. Molecular analysis of commensal host-microbial relationships in the intestine. Science. 2001;291:881-884
8. Chowdhury SR, King DE, Willing BP. et al. Transcriptome profiling of the small intestinal epithelium in germfree versus conventional piglets. BMC Genomics. 2007;8:215
9. Comelli EM, Simmering R, Faure M. et al. Multifaceted transcriptional regulation of the murine intestinal mucus layer by endogenous microbiota. Genomics. 2008;91:70-77
10. Sonnenburg JL, Chen CT, Gordon JI. Genomic and metabolic studies of the impact of probiotics on a model gut symbiont and host. Plos Biology. 2006;4:e413
11. Ambros V, Chen X. The regulation of genes and genomes by small RNAs. Development. 2007;134:1635-1641
12. Place RF, Li LC, Pookot D. et al. MicroRNA-373 induces expression of genes with complementary promoter sequences. Proceedings of the National Academy of Sciences of the United States of America. 2008;105:1608-1613
13. Griffiths-Jones S, Saini HK, van Dongen S. et al. miRBase: tools for microRNA genomics. Nucleic Acids Res. 2008;36:D154-158
14. Gao Y, Schug J, McKenna LB. et al. Tissue-specific regulation of mouse microRNA genes in endoderm-derived tissues. Nucleic Acids Res. 2011;39:454-463
15. Krol J, Loedige I, Filipowicz W. The widespread regulation of microRNA biogenesis, function and decay. Nat Rev Genet. 2010;11:597-610
16. Brennecke J, Stark A, Russell RB. et al. Principles of microRNA-target recognition. PLoS Biol. 2005;3:e85
17. Shirdel EA, Xie W, Mak T.W, Jurisica I. NAViGaTing the micronome: Using multiple microRNA prediction databases to identify signalling pathway-associated microRNAs. PLoS ONE. 2011;6:e17429
18. Liu CG, Calin GA, Meloon B. et al. An oligonucleotide microchip for genome-wide microRNA profiling in human and mouse tissues. Proc Natl Acad Sci U S A. 2004;101:9740-9744
19. Ambros V. The functions of animal microRNAs. Nature. 2004;431:350-355
20. Baltimore D, Boldin MP, O'Connell RM. et al. MicroRNAs: new regulators of immune cell development and function. Nat Immunol. 2008;9:839-845
21. Lecellier CH, Dunoyer P, Arar K. et al. A cellular microRNA mediates antiviral defense in human cells. Science. 2005;308:557-560
22. Navarro L, Dunoyer P, Jay F. et al. A plant miRNA contributes to antibacterial resistance by repressing auxin signaling. Science. 2006;312:436-439
23. Sharbati S, Friedlander MR, Sharbati J. et al. Deciphering the porcine intestinal microRNA transcriptome. BMC Genomics. 2010;11:275
24. Cummins JM, He Y, Leary RJ. et al. The colorectal microRNAome. Proc Natl Acad Sci U S A. 2006;103:3687-3692
25. Wu F, Zhang S, Dassopoulos T. et al. Identification of microRNAs associated with ileal and colonic Crohn's disease. Inflamm Bowel Dis. 2010;16:1729-1738
26. Liao Y, Lonnerdal B. miR-584 mediates post-transcriptional expression of lactoferrin receptor in Caco-2 cells and in mouse small intestine during the perinatal period. Int J Biochem Cell Biol. 2010;42:1363-1369
27. Sansom SE, Nuovo GJ, Martin MM. et al. miR-802 regulates human angiotensin II type 1 receptor expression in intestinal epithelial C2BBe1 cells. Am J Physiol Gastrointest Liver Physiol. 2010;299:G632-642
28. Zhou Q, Souba WW, Croce CM. et al. MicroRNA-29a Regulates Intestinal Membrane Permeability in Patients with Irritable Bowel Syndrome. Gut. 2010Jun;59(6):775-84
29. Dalmasso G, Nguyen HT, Yan Y. et al. MicroRNAs determine human intestinal epithelial cell fate. Differentiation. 2010;80:147-154
30. Zeng L, Carter AD, Childs SJ. miR-145 directs intestinal maturation in zebrafish. Proc Natl Acad Sci U S A. 2009;106:17793-17798
31. Bandres E, Cubedo E, Agirre X. et al. Identification by Real-time PCR of 13 mature microRNAs differentially expressed in colorectal cancer and non-tumoral tissues. Molecular Cancer. 2006;5:29
32. Wu F, Zikusoka M, Trindade A. et al. MicroRNAs are differentially expressed in ulcerative colitis and alter expression of macrophage inflammatory peptide-2 alpha. Gastroenterology. 2008;135:1624-1635
33. Taganov KD, Boldin MP, Chang KJ. et al. NF-kappaB-dependent induction of microRNA miR-146, an inhibitor targeted to signaling proteins of innate immune responses. Proceedings of the National Academy of Sciences of the United States of America. 2006;103:12481-12486
34. Ura S, Honda M, Yamashita T. et al. Differential microRNA expression between hepatitis B and hepatitis C leading disease progression to hepatocellular carcinoma. Hepatology. 2009;49:1098-1112
35. Xiao B, Liu Z, Li BS. et al. Induction of microRNA-155 during Helicobacter pylori infection and its negative regulatory role in the inflammatory response. Journal of Infectious Diseases. 2009;200:916-925
36. Krogius-Kurikka L, Lyra A, Malinen E. et al. Microbial community analysis reveals high level phylogenetic alterations in the overall gastrointestinal microbiota of diarrhoea-predominant irritable bowel syndrome sufferers. BMC Gastroenterol. 2009;9:95
37. Strober W, Fuss I, Mannon P. The fundamental basis of inflammatory bowel disease. Journal of Clinical Investigation. 2007;117:514-521
38. Cummings JH, Antoine JM, Azpiroz F. et al. PASSCLAIM--gut health and immunity. European Journal of Nutrition. 2004;43(Suppl 2):II118-II173
39. Simon SA, Meyers BC, Sherrier DJ. MicroRNAs in the rhizobia legume symbiosis. Plant Physiol. 2009;151:1002-1008
40. Jansen GJ, Wildeboer-Veloo AC, Tonk RH. et al. Development and validation of an automated, microscopy-based method for enumeration of groups of intestinal bacteria. J Microbiol Methods. 1999;37:215-221
41. Livak KJ, Schmittgen TD. Analysis of relative gene expression data using real-time quantitative PCR and the 2(-Delta Delta C(T)) Method. Methods. 2001;25:402-408
42. Mestdagh P, Van Vlierberghe P, De Weer A. et al. A novel and universal method for microRNA RT-qPCR data normalization. Genome Biology. 2009;10:R64
43. McCarthy DJ, Smyth GK. Testing significance relative to a fold-change threshold is a TREAT. Bioinformatics. 2009;25:765-771
44. Lucas A, Jasson S. Using amap and ctc Packages for Huge Clustering. R News. 2006;6:58-60
45. Team R. R: A language and environment for statistical computing. R Foundation for Statistical Computing. Vienna, Austria: R Foundation for Statistical Computing. 2008
46. Brown KR, Otasek D, Ali M. et al. NAViGaTOR: Network Analysis, Visualization and Graphing Toronto. Bioinformatics. 2009;25:3327-3329
47. Friedman RC, Farh KK, Burge CB. et al. Most mammalian mRNAs are conserved targets of microRNAs. Genome Res. 2009;19:92-105
48. Grimson A, Farh KK, Johnston WK. et al. MicroRNA targeting specificity in mammals: determinants beyond seed pairing. Mol Cell. 2007;27:91-105
49. Lewis BP, Burge CB, Bartel DP. Conserved seed pairing, often flanked by adenosines, indicates that thousands of human genes are microRNA targets. Cell. 2005;120:15-20
50. Kertesz M, Iovino N, Unnerstall U. et al. The role of site accessibility in microRNA target recognition. Nat Genet. 2007;39:1278-1284
51. Shirdel EA, Xie W, Mak T.W, Jurisica I. NAViGaTing the micronome: Using multiple microRNA prediction databases to identify signalling pathway-associated microRNAs. PLoS ONE. In press
52. Thomas PD, Campbell MJ, Kejariwal A. et al. PANTHER: a library of protein families and subfamilies indexed by function. Genome Res. 2003;13:2129-2141
53. Thomas PD, Kejariwal A, Guo N. et al. Applications for protein sequence-function evolution data: mRNA/protein expression analysis and coding SNP scoring tools. Nucleic Acids Res. 2006;34:W645-650
54. miRviewer. Kiezun A et al. http://people.csail.mit.edu/akiezun/miRviewer/
55. Papadopoulos GL, Reczko M, Simossis VA. et al. The database of experimentally supported targets: a functional update of TarBase. Nucleic Acids Res. 2009;37:D155-158
56. Xiao F, Zuo Z, Cai G. et al. miRecords: an integrated resource for microRNA-target interactions. Nucleic Acids Res. 2009;37:D105-110
57. Barrett T, Troup DB, Wilhite SE. et al. NCBI GEO: archive for high-throughput functional genomic data. Nucleic Acids Res. 2009;37:D885-890
58. Su AI, Wiltshire T, Batalov S. et al. A gene atlas of the mouse and human protein-encoding transcriptomes. Proc Natl Acad Sci U S A. 2004;101:6062-6067
59. Kuhn DE, Martin MM, Feldman DS. et al. Experimental validation of miRNA targets. Methods. 2008;44:47-54
60. McKenna LB, Schug J, Vourekas A. et al. MicroRNAs control intestinal epithelial differentiation, architecture, and barrier function. Gastroenterology. 2010;139:1654-1664
61. Guo L, Lu Z. The fate of miRNA* strand through evolutionary analysis: implication for degradation as merely carrier strand or potential regulatory molecule? PLoS One. 2010;5:e11387
62. Saba R, Goodman CD, Huzarewich RL. et al. A miRNA signature of prion induced neurodegeneration. PLoS One. 2008;3:e3652
63. Li Y, Chan EY, Li J. et al. MicroRNA expression and virulence in pandemic influenza virus-infected mice. J Virol. 2010;84:3023-3032
64. Matsushima K, Isomoto H, Inoue N. et al. MicroRNA signatures in Helicobacter pylori-infected gastric mucosa. Int J Cancer. 2011;128:361-370
65. Cremer TJ, Ravneberg DH, Clay CD. et al. MiR-155 induction by F. novicida but not the virulent F. tularensis results in SHIP down-regulation and enhanced pro-inflammatory cytokine response. PLoS One. 2009;4:e8508
66. Schmidt WM, Spiel AO, Jilma B. et al. In vivo profile of the human leukocyte microRNA response to endotoxemia. Biochem Biophys Res Commun. 2009;380:437-441
67. Monk CE, Hutvagner G, Arthur JS. Regulation of miRNA transcription in macrophages in response to Candida albicans. PLoS One. 2010;845:e13669
68. Zhou R, Hu G, Liu J. et al. NF-kappaB p65-dependent transactivation of miRNA genes following Cryptosporidium parvum infection stimulates epithelial cell immune responses. PLoS Pathog. 2009;5:e1000681
69. Zeiner GM, Norman KL, Thomson JM. et al. Toxoplasma gondii infection specifically increases the levels of key host microRNAs. PLoS One. 2010;5:e8742
70. Akao Y, Nakagawa Y, Naoe T. MicroRNA-143 and -145 in colon cancer. DNA & Cell Biology. 2007;26:311-320
71. Chiyomaru T, Enokida H, Tatarano S. et al. miR-145 and miR-133a function as tumour suppressors and directly regulate FSCN1 expression in bladder cancer. British Journal of Cancer. 2010;102:883-891
72. Schaefer A, Jung M, Mollenkopf HJ. et al. Diagnostic and prognostic implications of microRNA profiling in prostate carcinoma. International Journal of Cancer. 2010;126:1166-1176
73. Vannucci L, Stepankova R, Kozakova H. et al. Colorectal carcinogenesis in germ-free and conventionally reared rats: different intestinal environments affect the systemic immunity. Int J Oncol. 2008;32:609-617
74. Gotte M, Mohr C, Koo CY. et al. miR-145-dependent targeting of Junctional Adhesion Molecule A and modulation of fascin expression are associated with reduced breast cancer cell motility and invasiveness. Oncogene. 2010;29:6569-6580
75. Kano M, Seki N, Kikkawa N. et al. miR-145, miR-133a and miR-133b: Tumor suppressive miRNAs target FSCN1 in esophageal squamous cell carcinoma. Int J Cancer. 2010;127:2804-2814
76. Stappenbeck TS, Hooper LV, Gordon JI. Developmental regulation of intestinal angiogenesis by indigenous microbes via Paneth cells. Proc Natl Acad Sci U S A. 2002;99:15451-15455
77. Wang S, Aurora AB, Johnson BA. et al. The endothelial-specific microRNA miR-126 governs vascular integrity and angiogenesis. Dev Cell. 2008;15:261-271
78. Chassin C, Kocur M, Pott J. et al. miR-146a mediates protective innate immune tolerance in the neonate intestine. Cell Host Microbe. 2010;8:358-368
79. Sokol H, Seksik P, Furet JP. et al. Low counts of Faecalibacterium prausnitzii in colitis microbiota. Inflamm Bowel Dis. 2009;15:1183-1189
80. Tanaka K, Namba T, Arai Y. et al. Genetic evidence for a protective role for heat shock factor 1 and heat shock protein 70 against colitis. J Biol Chem. 2007;282:23240-23252
81. McKenna LB, Schug J, Vourekas A. et al. MicroRNAs control intestinal epithelial differentiation, architecture, and barrier function. Gastroenterology. 2010;139:1654-1664
82. Liu G, Friggeri A, Yang Y. et al. miR-147, a microRNA that is induced upon Toll-like receptor stimulation, regulates murine macrophage inflammatory responses. Proc Natl Acad Sci U S A. 2009;106:15819-15824
83. Nahid MA, Satoh M, Chan EK. Mechanistic Role of MicroRNA-146a in Endotoxin-Induced Differential Cross-Regulation of TLR Signaling. J Immunol. 2011;186:1723-1734
Author contact
![]() Corresponding author: EMC: elena.comellica
Corresponding author: EMC: elena.comellica