Impact Factor ISSN: 1449-2288
- Issue 12; 2026
- Issue 11; 2026
- Issue 10; 2026
- Issue 9; 2026
- Issue 8; 2026
- Volume 22; 2026
- Past Issues
- Advance Articles
- Editorial Board
- Cover Images
- Index & Coverage
- Cover Suggestion
- Special Issues
Introduction
Materials and methods
Result
Discussion
Conclusion
Abbreviation
Acknowledgements
References

 Global reach, higher impact
Int J Biol Sci 2012; 8(3):353-362. doi:10.7150/ijbs.3157 This issue Cite
Research Paper
Comparison of Protein Expression Profiles of Different Stages of Lymph Nodes Metastasis in Breast Cancer
Hui-Hua Lee1, Chu-Ai Lim1, Yew-Teik Cheong2, Manjit Singh2, Lay-Harn Gam1 ![]()
1. School of Pharmaceutical Sciences, Universiti Sains Malaysia, USM, Penang, Malaysia;
2. Department of Surgery, Penang General Hospital, Penang, Malaysia.
Received 2011-6-17; Accepted 2012-1-4; Published 2012-2-20
Abstract
Breast cancer is the most common cancer among women worldwide. Breast cancer metastasis primarily happens through lymphatic system, where the extent of lymph node metastasis is the major factor influencing staging, prognosis and therapeutic decision of the disease. We aimed to study the protein expression changes in different N (regional lymph nodes) stages of breast cancer. Protein expression profiles of breast cancerous and adjacent normal tissues were mapped by proteomics approach that comprises of two-dimensional polyacrylamide gel electrophoresis (2D-PAGE) and tandem mass spectrometry (LC-MS/MS) analysis. Calreticulin and tropomyosin alpha 3 chains were the common up-regulated proteins in N0, N1 and N2 stages of breast cancer. Potential biomarker for each N stage was HSP 70 for N0, 80 k protein H precursor and PDI for N1 stage while 78 kDa glucose-regulated protein was found useful for N2 stage. In addition, significant up-regulation of PDI A3 was detected only in the metastasized breast cancer. The up-regulation expression of these proteins in cancerous tissues can potentially use as indicators for diagnosis, treatment and prognosis of different N stages of breast cancer.
Keywords: Breast cancer, lymph nodes, proteomic, 2D-PAGE, LC-MS/MS.
Introduction
Breast cancer is a malignant disease originated from breast's cell, where it usually forms from the terminal duct-lobular unit that supplies milk [1]. In 2008, 460,000 deaths due to breast cancer were reported worldwide [2].
Infiltrating ductal carcinoma (IDC) is the most common and aggressive type of breast cancer [3]. It is originated in the lactiferous duct, where it can break through the duct tube and invade or infiltrate the surrounding breast tissue, it can also spread to other parts of the body through lymph and blood systems [4].
Metastasis is defined as the process by which tumor cells spread from primary tumor site to secondary site (nearby or distant organ) and proliferate. Metastasis can occur through blood or lymph node [5]. In breast cancer, metastasis primarily happens through the lymphatic system [6]. The extent of lymph node (N) metastasis is the major factor influencing staging and prognosis of most malignancies and often determines therapeutic decision [7]. Therefore, we aimed to study protein expression changes of N stages of IDC breast tissues as classified by the TNM staging system, where emphasis will be given to the up-regulated proteins in cancerous tissues. Protein expression profiles for breast cancerous and its adjacent normal tissues were mapped by using proteomics approach. We hoped to identify biomarkers that can be used as diagnostic or therapeutic markers for different stages of breast cancer.
Materials and methods
Tissue collection: Human ethical approval was obtained from the Human Ethical Clearance Committee of Universiti Sains Malaysia (USM) and the Ministry of Health Malaysia. Patient consents were obtained from the patients or their next of kin before collection of tissue specimens. Thirty-eight pairs of breast tissues comprised of normal and cancerous tissues were collected from Penang General Hospital (GH) after being confirmed as normal and cancerous, respectively by hospital pathologist. The tumor type used was IDC. There were 13 patients in N0 stage, 13 patients in N1 stage and 12 patients in N2 stage according to the TNM staging system (Table 1). The patients did not receive any preoperative neo-adjuvant chemotherapy or radiotherapy prior to surgery.
Basic information of all patients.
| Variables | No. of patient |
|---|---|
| Age | |
| 36-45 | 6 |
| 46-55 | 7 |
| 56-65 | 14 |
| 66-75 | 8 |
| 76-85 | 3 |
| Tumor origin | |
| Right breast | 20 |
| Left breast | 18 |
| Lymph Node Staging | |
| 0 | 13 |
| 1 | 13 |
| 2 | 12 |
Tissue processing: The tissue specimens were stored frozen at -80°C until analysis. Prior to protein extraction, tissues were thawed to room temperature and then rinsed thoroughly with distilled water. Fat tissues were removed from the tissue specimens and the specimens were cut into small pieces and transferred to microcentrifuge tubes.
Protein extraction: An amount of 250 mg of tissue was subjected to sequential extraction using Tris Buffer (TRIS) and Thiourea Lysis Buffer (TLB). First, a volume of TRIS (40 mM Tris, 1 mM protease inhibitor and 2 mM benzonase) was added to the tissue in a microcentrifuge tube following a ratio of 1:2; tissue (weight): buffer (volume). The tissue was then disrupted on ice for 10 minutes using a plastic homogenizer. The lysate was vortex for 30 seconds and centrifuged at 13000 rpm for 15 minutes at 4°C. The supernatant was recovered and kept at -80°C for other analysis. Subsequently, 250 μL of TRIS was added to the remaining pellet and vortex briefly. The mixture was then centrifuged at 13000 rpm for 15 minutes at 4°C. The supernatant was discarded. TLB [8 M Urea, 2 M Thiourea, 4% (w/v) 3-[(3-Cholamidopropyl)dimethylammonio]-1-propanesulfonate (CHAPS), 0.4% (w/v) carrier ampholyte, 50 mM DTT and 1 mM AEBSF] was added to the remaining pellet following a ratio of 1:1 pellet (weight): buffer (volume). The mixture was mixed thoroughly by brief vortexing and centrifuged at 13000 rpm for 15 minutes at 4°C. After centrifugation, the supernatant was collected in a microcentrifuge tube and subjected to protein concentration determination using RC-DC protein assay (Bio-Rad, USA),
Two-dimensional polyacrylamide gel electrophoresis (2D-PAGE): This method was implemented by O'Farrell (1975) and Klose (1975). 150 ug of lysate in 125 µL TLB buffer containing trace amount of Bromophenol Blue was passively rehydrated unto a 7cm 4-7 immobilized pH gradient (IPG) strip (Bio-Rad, USA) for 15 hours, this was followed by isoelectric focusing (IEF) using an IEF Cell (Bio-Rad, USA) in a linear ramping mode, starting from 0 to 200 V for 15 minutes, followed by 200 to 4000 V for 2 hours and hold at 4000 V until 7000 V-hr was achieved. After focusing, the IPG strip was treated with equilibration buffer I (6 M urea, 0.375 M Tris pH 8.8, 2% SDS, 20% glycerol, and 2% DTT) and subsequently with equilibration II (6 M urea, 0.375 M Tris pH 8.8, 2% SDS, 20% glycerol, and 2.5% iodoacetamide). The second dimension separation was carried out on 10% SDS-PAGE using a constant voltage of 200 V throughout the run. The gel was stained using Bio-SafeTM Colloidal Coomasie Blue G-250 Stain (Bio-Rad, USA) and destained with deionized water.
Image analysis: All 2D images were captured using VersaDoc Imaging System (Bio-Rad, USA) and analyzed using PDQuest Software version 7.3 (Bio-Rad, USA). Match sets consisted of 2D-gel images of protein extracts from normal and cancerous tissues of the same patient were created. The common and differentially expressed protein spots between normal and cancerous tissues were compared and identified. Normalization was applied to all the captured gel images, using this device, the intensity of every protein spots were measured as proportion to the total density of valid spots. Wilcoxon paired-sample test was used to determine the statistical significance in the difference in intensity between protein spots from normal and cancerous tissues.
In-gel digestion: All targeted protein spots were subjected to in-gel digestion according to Gam et al. (2003). It is a sample preparation procedure prior to LC-MS/MS analysis. Spots containing proteins were excised from gel and rinsed thoroughly with deionized water to remove excess SDS. The gel pieces were washed with 100 mM ammonium bicarbonate (NH4HCO3) for 10 minutes. The buffer was discarded. Acetonitrile (ACN) was added onto the gel pieces for dehydration purpose and discarded after 5 minutes incubation. Then, the gel pieces were subjected to vacuum centrifugation (Eppendorf, Germany) until dried. These steps were repeated four times. Then, 15 μL of 10 ng/μL trypsin prepared in digestion buffer (50 mM NH4HCO3, 5 mM CaCl2) was added to the gel pieces and incubated on ice for 45 minutes. The excess digestion buffer containing trypsin was discarded and 10 μL of digestion buffer without trypsin was added and incubated at 37°C overnight. After centrifugation at 2000 rpm for 2 minutes at room temperature, the supernatant were collected and kept in microcentrifuge tube. Subsequently, 15 μL of 20 mM NH4HCO3 was added to the gel pieces and incubated at room temperature for 10 minutes. The supernatant was collected and pooled with the previous collection after a brief spin. Then, the remaining peptides were further extracted using four repeated extraction cycles using 5% (v/v) formic acid in 7:3 ACN: dH2O. In each cycle, gel pieces were incubated for 20 minutes in the buffer and spun down. All the supernatants recovered were pooled with the previous collections. The pooled peptide extracts were evaporated until dried using continuous flow of nitrogen gas.
Reverse phase high performance liquid chromatography and tandem mass spectrometry (LC-MS/MS): The peptides were reconstituted in 30 µL of 0.1% (v/v) formic acid in 85:15 solution of dH2O: ACN. The mixture was briefly spun and the supernatant was recovered and transferred into a polypropylene vial insert and placed in autosampler of a HPLC system. A sample volume of 15 µL was injected into the enrichment column (Zorbax SB C18, 35 X 0.5 mm, particle size 5 µm) at an isocratic flow rate of 0.05 mL/min using a binary pump HPLC 1100 Series (Agilent, Germany). The mobile phase was 0.1% (v/v) formic acid in 97:3 dH2O: ACN. Then, the concentrated peptides were eluted and transferred to a reverse phase column (Zorbax 300SB C18, 150 X 0.3 mm, particle size 5 µm) by using a capillary pump operated at flow rate of 4 µL/min. The peptides were eluted at a linear gradient of 5% B to 95% B in 70 minutes and held constant at 95% B for 5 minutes. Mobile phase A was 0.1% (v/v) formic acid in deionized water while mobile phase B was 0.1% (v/v) formic acid in ACN. The HPLC was interfaced to an electrospray ionization (ESI)-ion trap mass analyzer. The MS data was acquired through data dependent analysis method consisted of full scan MS and MS/MS scan. The eluted peptides from HPLC were ionized by ESI operating in positive ion mode. The two most intense positively charged ions in every MS scan that exceeded the minimum threshold of 3000 counts were isolated and excited to MS/MS scan. In MS/MS scan, the peptide was subjected to collision induced dissociation (CID) to produce MS/MS spectrum. The MS parameters used were: dry gas flow rate of 6 L/min, dry gas temperature of 300ºC, nebulizer gas flow rate of 15 L/min and nebulizer pressure of 15.0 psi. The MS/MS analysis was performed with these parameters: collision energy at 1.15 V, capillary voltage of 3.5 kV, exit capillary voltage of 84.5 V, skimmer 1 voltage of 17.2 V, skimmer 2 voltages at 6.0 V, scan range of 200-1800 m/z with a scan time of 1 second, charge state of 2, and isolation width of 2 m/z.
Protein identification: The MS/MS data obtained was used to interrogate the identity of protein through Mascot Protein Database (MSDB) search engine. The parameters used were Homo sapiens for taxonomy, trypsin for enzyme, carboxymethyl for fixed modification. The peptide tolerance and MS/MS tolerance were +/- 2 Da and 0.8 Da, respectively. The instrument type was set as ESI-TRAP and only one missed cleavage was allowed. The function and characteristic of proteins were obtained from Swiss-Prot (www.expasy.org) and NCBI (www.ncbi.nlm.nih.gov) protein database. The protein name, score, molecular weight (MW), isoelectric point (pI), and sequence coverage (seq. cov) were obtained through MASCOT Protein Database (MSDB) search engine (www.matrixscience.com). The Swiss-Prot number was obtained through NCBI blast (www.ncbi.nlm.nih.gov). The grand average of hydropathy (GRAVY) was obtained through Expasy proteomic server (expasy.org). GRAVY is a value calculated by sum of the hydropathy value for each amino acid and dividing by number of residue in protein sequence. It ranged from -4 to +4, where the more positive value means the protein is more hydrophobic and vice versa for protein with negative value [8]. The function of proteins was obtained through www.uniprot.org.
Western Blot: Western blotting was performed according to Towbin et al., (1979) with modifications. The tissue extract was separated using SDS-PAGE at constant voltage of 200 V. After SDS-PAGE, the gel was soaked in cold transfer buffer [25 mM Tris, 192 mM Glycine, 1.3 mM SDS and 20% (v/v) methanol] for 30 minutes while nitrocellulose membrane and blotting papers of 8.0 x 7.4 cm in size (Bio-Rad, USA) were soaked in transfer buffer for 1 hour. The pore size of nitrocellulose membrane was 0.45 µm. Semi-dry blotting method (Lauriere, 1993) was applied using TE Semiphor semi-dry transfer unit (Hoefer Scientific, Germany). The transfer of proteins from gel to nitrocellulose membrane was conducted at 134 mA for 1.5 hours. After this, the membrane was rinsed with washing buffer [0.1% (w/v) BSA, 0.1% (v/v) Tween 20 in PBS] and blocked with blocking buffer [3% (w/v) BSA, 0.1% (v/v) Tween 20 in PBS] with gentle agitation for 2 hours at room temperature. The blocking buffer was discarded and the membrane was washed three times with washing buffer. The membrane was then incubated with primary antibody overnight at 4ºC with gentle agitation. This is followed by incubation with secondary antibody for 2 hours at room temperature after being washed three times with washing buffer. The membrane was incubated with substrate solution containing 5-bromo-4-chloro-3-indolyl phosphate (Bio-Rad, USA) with gentle shaking for 15 minutes in order to visualize the interaction between targeted protein and its antibody (primary antibody).
Result
In this study, a total of 38 pairs of normal and cancerous breast tissues were subjected to identical protein extraction and 2D-PAGE procedures. All 2D-images were analyzed using gel image analyzer. Table 1 shows basic information of all patients.
Inconsistent expression of a few proteins between patients was observed although a general consistent pattern of proteomes can be identified within normal and cancerous tissues, respectively. Hence, only the protein spots that were consistently expressed in greater than 80% of all patients in the same cohort were considered as valid protein spot. Using this approach, we hoped to minimize the identification of invalid protein spots that may result from variation between gels or error in the image analysis. The consistently expressed protein is more likely to be involved in the process of transformation of normal cell into cancer cells. A protein spot was categorized as up-regulated when the intensity of the spot in cancerous tissue is at least 2 folds or greater than that of normal tissue. The vice-versa was applied to down-regulated proteins. A protein was termed as up-regulated protein when it showed consistent up-regulation characteristic in greater than 65% patients in the cohort. The similar was applied to the down-regulated proteins.
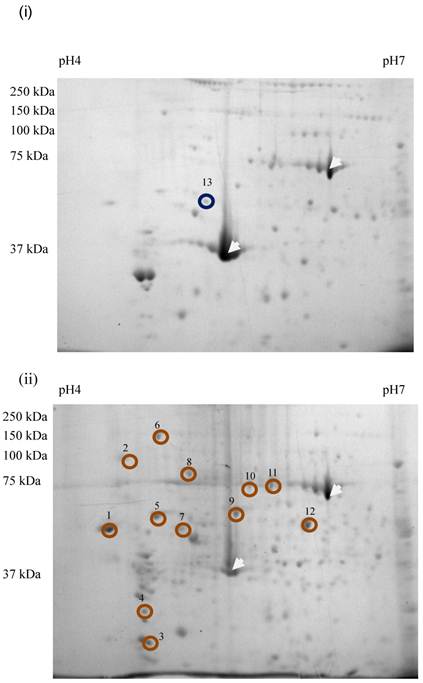
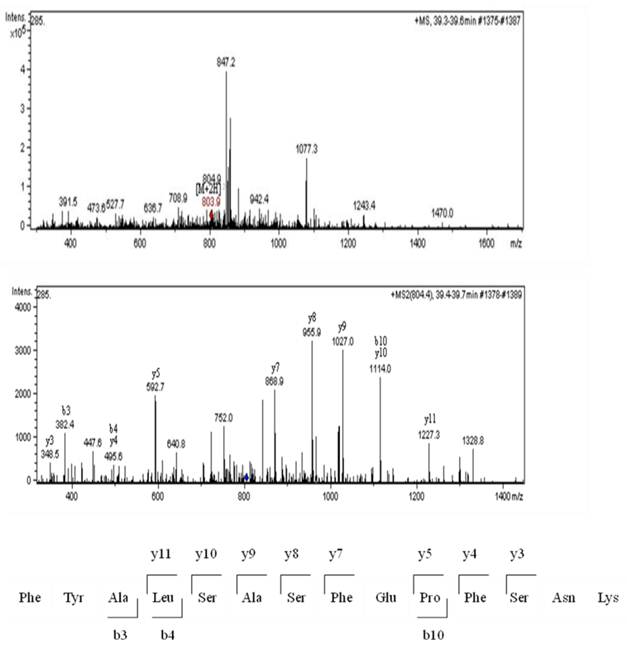
Sixty-four valid protein spots on 2D gel images of TLB extracts of breast tissues were detected. The protein spots that showed consistent differentially expressed in >65% patients were subjected to in-gel digestion, LC-MS/MS analysis and MASCOT search. Figure 1 shows the up- and down-regulated protein spots on 2D gel image of a TLB extract from breast cancerous tissue. An example of MS and MS/MS spectrum of calreticulin are shown in Figure 2. The identities and characteristics of the significant up- and down-regulated proteins are shown in Table 2.
2D gel images of TLB extracts: (i) breast normal tissue, (ii) breast cancerous tissue of the same patient. The white arrow denoted the landmark used in gel image analysis. Brown circles denoted the up-regulated proteins. Blue circled denoted the down-regulated protein. The spot number was labeled accordingly to protein list in Table 2.
MS analysis for calreticulin; MS spectrum, MS/MS spectrum and the amino acid sequence for peptide derived from the MS/MS spectrum.
List of up and down-regulated proteins detected in TLB extract.
| No | Protein Name | Swiss-prot No | Score | MW | pI | Seq Cov | GRAVY | Function* |
|---|---|---|---|---|---|---|---|---|
| Up-regulated proteins | ||||||||
| 1 | Calrecticulin | P27797 | 175 | 46890 | 4.3 | 18% | -1.104 | Molecular calcium-binding chaperone |
| 2 | 80 k protein H precursor | P14314 | 134 | 60245 | 4.34 | 17% | -0.910 | Protein kinase C binding |
| 3 | Tropomyosin alpha-3 chain | P06753 | 55 | 32857 | 4.68 | 4% | -1.051 | Regulates muscle contraction, stabilizes cytoskeleton actin filaments |
| 4 | Tropomyosin isoform | P09493 | 104 | 28519 | 4.89 | 14% | -1.044 | Regulates muscle contraction, stabilizes cytoskeleton actin filaments |
| 5 | Protein disulfide isomerase (PDI) | P07237 | 45 | 57487 | 4.76 | 19% | -0.431 | Catalyzes the formation, breakage and rearrangement of disulfide bonds |
| 6 | Heat shock protein 90 (HSP 90) | Q4R250 | 48 | 92572 | 4.77 | 10% | -0.719 | Molecular chaperone that functions in the processing and transport of secreted proteins |
| 7 | Tubulin, beta polypeptide | Q91575 | 161 | 48142 | 4.7 | 15% | -0.355 | Major constituent of microtubules |
| 8 | 78 kDa glucose-regulated protein | P11021 | 505 | 72404 | 5.07 | 37% | -0.487 | Anti-apoptosis, cellular response to glucose starvation |
| 9 | Heat shock protein 60 (HSP 60) | P10809 | 50 | 61348 | 5.7 | 17% | -0.076 | Implicated in mitochondrial protein import and macromolecular assembly |
| 10 | Heat shock 70 kDa protein 8 isoform 1 (HSP 70) | P11142 | 220 | 71087 | 5.28 | 17% | -0.456 | Molecular chaperone |
| 11 | Heat shock 70 kDa protein 1 | Q5R7D3 | 257 | 69982 | 5.48 | 14% | -0.383 | Stabilize preexistent proteins against aggregation and mediate the folding of newly translated polypeptides in the cytosol and within organelles |
| 12 | Protein disulfide isomerase A3 (PDI A3) | P30101 | 581 | 57167 | 5.98 | 21% | -0.506 | Catalyzes the rearrangement of disulfide bonds in proteins |
| Down-regulated protein | ||||||||
| 13 | Tubulin alpha-1 chain | Q6P9V9 | 235 | 50816 | 4.94 | 28% | -0.23 | Major constituent of microtubules |
*Functions were obtained from www.uniprot.org.
Twelve proteins were identified as up-regulated proteins and one protein as down-regulated protein in our study (Table 2). The protein name, score, molecular weight (MW), isoelectric point (pI), sequence coverage (seq. cov) and function were indicated in the table. Table 3 shows protein expression profiles and average fold change of these proteins in patients suffered from N0, N1 and N2 stages breast cancer, respectively. There were three up-regulated proteins in N0 stage, namely calreticulin (77%), tropomyosin alpha-3 chain (69%) and HSP 70 (69%). Tubulin alpha-1 chain was down-regulated in N0 stage. A total of ten proteins were up-regulated in N1 stage, these proteins were calreticulin (92%), 80 k protein H precursor (85%), tropomyosin alpha-3 chain (77%), tropomyosin isoform (69%), PDI (77%), HSP 90 (69.23%), tubulin, beta polypeptide (69%), HSP 60 (85%), heat shock 70 kDa protein 1 (69%) and PDI A3 (69%). Five proteins were up-regulated while one protein was down-regulated in N2 stage. The up-regulated proteins were calreticulin (83%), tropomyosin alpha-3 chain (75%), 78 kDa glucose-regulated protein (75%), HSP 60 (67%) and PDI A3 (92%). Tubulin alpha-1 chain (67%) was down-regulated in N2 stage. The change in protein expression of all these proteins were statistically significant at a 95% confidence level (p<0.05) as analyzed using Wilcoxon paired-sample test.
Protein expression percentage and fold change in N0, N1 and N2 stages of breast cancer.
| Protein Name | N stage | Up-regulated (%) | Down-regulated (%) | Same expression (%) | Not detected (%) | Fold change |
|---|---|---|---|---|---|---|
| Calrecticulin | N0 | 77 | 8 | 15 | 0 | + 4.33 |
| N1 | 92 | 0 | 8 | 0 | + 8.74 | |
| N2 | 83 | 17 | 0 | 0 | + 3.04 | |
| 80 k protein H precursor | N0 | 62 | 8 | 30 | 0 | + 3.80 |
| N1 | 84 | 8 | 8 | 0 | + 5.48 | |
| N2 | 50 | 17 | 0 | 33 | + 2.20 | |
| Tropomyosin alpha-3 chain | N0 | 69 | 0 | 8 | 23 | + 6.01 |
| N1 | 77 | 0 | 15 | 8 | + 11.36 | |
| N2 | 75 | 8 | 9 | 8 | + 5.75 | |
| Tropomyosin isoform | N0 | 62 | 0 | 31 | 7 | + 3.67 |
| N1 | 69 | 8 | 15 | 8 | + 3.69 | |
| N2 | 50 | 8 | 25 | 17 | + 1.58 | |
| PDI | N0 | 54 | 0 | 46 | 0 | + 3.31 |
| N1 | 77 | 0 | 15 | 8 | + 5.19 | |
| N2 | 50 | 17 | 25 | 8 | + 1.63 | |
| HSP 90 | N0 | 46 | 8 | 46 | 0 | + 1.66 |
| N1 | 69 | 8 | 15 | 0 | + 4.20 | |
| N2 | 58 | 25 | 17 | 0 | + 2.13 | |
| Tubulin, beta polypeptide | N0 | 54 | 8 | 38 | 0 | + 2.20 |
| N1 | 69 | 0 | 31 | 0 | + 3.21 | |
| N2 | 50 | 8 | 34 | 8 | + 1.38 | |
| Tubulin alpha chain | N0 | 0 | 23 | 69 | 8 | - 1.39 |
| N1 | 8 | 39 | 46 | 7 | -1.65 | |
| N2 | 8 | 67 | 25 | 0 | -2.57 | |
| 78 kDa glucose-regulated protein | N0 | 54 | 15 | 31 | 0 | + 1.34 |
| N1 | 54 | 0 | 46 | 0 | + 2.69 | |
| N2 | 75 | 17 | 8 | 0 | + 2.28 | |
| HSP 60 | N0 | 54 | 8 | 38 | 0 | + 3.27 |
| N1 | 85 | 0 | 15 | 0 | + 4.85 | |
| N2 | 67 | 17 | 17 | 0 | + 3.50 | |
| HSP 70 | N0 | 69 | 0 | 31 | 0 | + 2.25 |
| N1 | 54 | 0 | 46 | 0 | + 1.93 | |
| N2 | 42 | 0 | 58 | 0 | + 1.39 | |
| Heat shock 70 kDa protein 1 | N0 | 46 | 23 | 31 | 0 | + 1.25 |
| N1 | 69 | 8 | 23 | 0 | + 2.18 | |
| N2 | 42 | 33 | 25 | 0 | + 1.38 | |
| PDI A3 | N0 | 54 | 15 | 31 | 0 | + 2.24 |
| N1 | 69 | 15 | 15 | 0 | + 3.44 | |
| N2 | 92 | 8 | 0 | 0 | + 2.80 |
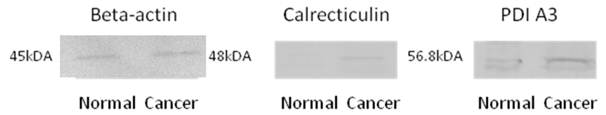
The protein identity as identified by LC-MS/MS and MASCOT database search engine was validated using Western blot experiments. All the potential biomarker with commercially available antibodies were subjected to this analysis, these biomarkers included calreticulin, PDI A3, HSP 60 and HSP 70, where the identify of all of these proteins were confirmed by Western blotting. Figure 3 shows the Western blot images for calreticulin and PDI A3 in breast normal and cancerous extracts from the same patient while beta-actin was used as an internal control. The higher intensity of antigen- antibody interaction for calreticulin and PDI A3 was observed in cancerous tissue compared to normal tissue, which may indicate the higher expression of these proteins in cancerous tissue.
Western Blot images of beta-actin (45kDa), calreticulin (48kDa) and PDI A3 (56.8kDa) from breast normal and cancerous tissues.
Discussion
TNM staging is determined according to the outcomes of physical examination, biopsy, and imaging tests [7]. It is useful to guide physicians in treatment option and prognosis of patients [9]. In this study, we focused on the protein expression changes in N0, N1 and N2 stages of breast cancer. Due to limitation in sample size, N3 stage was not included in our study.
TLB buffer made up of thiourea, urea and other reagents that favor the extraction of membrane associated or membrane proteins was used to extract proteins from the tissue pellet that was subjected to prewashing with TRIS buffer for removal of hydrophilic proteins. Thirty percent of human proteome is consisted of membrane proteins [9], these proteins involve in various biological processes of cell, which include signal transduction, immune regulation and transportation [10]. In addition, the nature of these proteins of being membrane associated making them good target for recognition in drug-targeted therapy for treatment of cancers.
In general, the differentially expressed proteins identified in this study can be grouped as either common proteins in all stages or predominant protein for each stage. The common proteins can be potentially used as biomarkers for diagnosis or treatment for all N stages. On the other hand, the predominant protein in each stage may be collectively used with other diagnoses for classification of N staging. Two common proteins that were up-regulated in all stages were calreticulin and tropomyosin alpha 3 chain. Calrecticulin was a very promising biomarker in view of its high expression consistency in most of the patients, where it was up-regulated significantly at 77%, 92% and 83% in N0, N1 and N2 stages, respectively.
Calreticulin was first introduced by Ostwald and MacLennan in 1974 [11]. It is a Ca2+ binding protein that localizes in the peripheral membrane of lumen of ER and nuclear envelope. It is important for Ca2+ storage, signaling and regulation in ER [12]. As reviewed by Michalak et al., (1999), calreticulin is also a lectin-like chaperone that involves in the synthesis of a variety of molecules, such as ion channels, surface receptors, intergrins and transporters. It helps to increase the yield of correctly folded proteins and prevents the aggregation and assembly of partially folded proteins. It had been reported as potential biomarker for breast cancer correlated with postoperative metastasis [13, 14].
Tropomyosin alpha 3 chain was up-regulated significantly at 69%, 69% and 75% in N0, N1 and N2 stages, respectively. Tropomyosins (Tms) are family of microfilament-associated structural proteins [15-17]. The expression change of Tms was induced by variety of carcinogens including chemical carcinogens, UV radiation, DNA and RNA tumor viruses during cancer cell transformation. Tropomyosin alpha 3 chain (Tm-3) is HMW (high molecular weight with 284 amino acids) Tms. In contrary to our finding, HMW Tms was reported down-regulated in breast cancer and bladder cancer although it was up-regulated in CNS tumors [15].
The protein that predominantly up-regulated (69%) in N0 stage was HSP 70, HSP 70 is a member of heat shock family that was induced under stress environment. It is function as ATP-dependent molecular chaperone [18, 19] that interacts with unfolded polypeptide sequences during mRNA translation to prevent premature self-association in nascent protein. It also assists in transportation of proteins across cellular membranes and targeting protein for lysosomal degradation [19]. HSP 70 was reported up-regulated in breast cancer [20].
When comparing to other stages, N1 stage has the highest number of predominantly up-regulated proteins, namely 80 k protein H precursor, tropomyosin isoform, PDI, HSP 90 (or also known as tumor rejection antigen), tubulin, beta polypeptide and heat shock 70 kDa protein 1. Amongst these, 80 k protein H precursor was the most consistent up-regulated protein in N1 stage, where it was found up-regulated at 85%. This is followed by PDI at 76.9% while the rest of the proteins were up-regulated at 69%. Therefore, we foresee the usefulness of 80 k protein H precursor and PDI as promising markers that can be collectively used to indicate N1 stage of breast cancer. 80 k protein H precursor or also known as glucosidase 2 subunit beta, is a substrate for protein kinase C [21]. It involves in the mechanism of elevated fibroblast growth factor-1 (FGF-1) in breast cancer [22], where FGF-1 is one of the key factors in angiogenesis and lymphangiogenesis in cancer [23]. On the other hand, PD1 is an enzyme that catalyzes the formation, reduction and isomerization of protein disulfide bond in ER [24, 25], where it functions as molecular chaperone by assisting in protein folding. Hence, it plays a critical role in the maintenance of protein structural stability and functional integrity [26]. In addition, PDI is also known as intracellular estrogen-binding protein, which accumulates estrogen in cells and augment the activities of estrogen receptor-mediated transcription [24]. PDI was reported as a differentially expressed protein in IDC breast cancer [27].
The predominantly up-regulated protein for N2 stage was 78 kDa glucose-regulated protein, it was significantly up-regulated at 75%. Its alternate name is immunoglobulin heavy chain binding protein or “BIP”. Similar with heat shock family members, it functions as molecular chaperone that assists in folding and assembly of newly synthesized proteins. Its expression is induced under glucose starvation [28]. It was reported up-regulated in breast cancer [29] and colorectal cancer [30].
It is interesting to note the significant up-regulation of PDI A3 was only found in N1 and N2 stages, which represent the breast cancer that had metastasized. In addition, its extent of up-regulation expression in N2 stage is worth mentioning, where it was up-regulated significantly at 91% in N2 stage while only at 69% in N1 stage. The up-regulation of PDI seems to be paralleled with the advancing of N stages (51% at N0 stage). We believe that PDI A3 may be used in the prognosis of breast cancer, where the presence of this protein may indicate the metastasize potential of breast cancer. PDI A3 is one of the members of PDI family. The thiol-disulfide exidoreductase activity of PDI A3 catalyzes oxidation, reduction and isomerization of protein disulfide bond. PDI A3 non-covalently interacts with two lectin molecular chaperones known as calnexin and calreticulin. PDI A3 involves in the oxidation folding of newly synthesized glycoproteins [25, 31, 32]. It was also reported up-regulated in gastric cancer [33] and pancreatic cancer [34].
Conclusion
In this study, we detected two proteins, namely calreticulin and tropomysin alpha 3 chains as common up-regulated proteins in N0, N1 and N2 stages of breast cancer, while HSP 70, 80 k protein H precursor, PDI, and 78 kDa glucose-regulated protein were predominantly up-regulated proteins in N0, N1 and N2, respectively. On the other hand, the increase up-regulation pattern of PDI A3 was parallel with the advancing N stages of breast cancer. By virtue of cellular location of membrane proteins in cells, their up-regulation expression in cancerous tissues can potentially use as indicators for diagnosis or drug-targeted therapy of breast cancer, nevertheless, before all these potential biomarkers turn to be used in clinical applications, more retrospective and prospective clinical trials are needed to evaluate the overall clinical utility of these indicators. Furthermore, the significance of each biomarker for breast cancer can be evaluated by using a greater number of tissue specimens.
Abbreviation
N: lymph nodes; TNM: tumor, node, metastasis; 2D-PAGE: two-dimensional polyacrylamide gel electrophoresis; LC-MS/MS: tandem mass spectrometry; IDC: Infiltrating ductal carcinoma; USM: Universiti Sains Malaysia; MoH: Ministry of Health; GH: Penang General Hospital; TRIS: Tris Buffer; TLB: Thiourea Lysis Buffer; CHAPS: 3-[(3-Cholamidopropyl)dimethylammonio]-1-propanesulfonate; IPG: immobilized pH gradient; IEF: isoelectric focusing; ACN: acetonitrile; AJCC: American Joint Committee on Cancer; UICC: International Union against Cancer; PDI: protein disulfide isomerase; HSP 90: heat shock protein 90; HSP 60: heat shock protein 60; HSP 70: Heat shock 70 kDa protein 8 isoform 1; PDI A3: protein disulfide isomerase A3.
Acknowledgements
We thank Ministry of Science, Technology and Innovation Malaysia for providing a grant (Project number: 02-01-05-SF0353) to fund this project, the Ministry of Heath, Malaysia for providing the human ethical clearance for conducting this research. Special thanks to Malaysian Institute of Pharmaceuticals and Nutraceuticals for providing LC-MS/MS analysis instruments throughout the study.
Conflict of Interests
The authors have declared that no conflict of interest exists.
References
1. Kumar V, Contran RS, Robbins SL. Basic Pathology. Philadelphia: WB Saunders. 1997
2. http://www.who.int/mediacentre/factsheets/fs297/en/
3. Kabbage M, Chahed K, Hamrita B, Guilier CL, Trimeche M, Remadi S, Hoebeke J, Chouchane L. Protein Alteration in Infiltrating Ductal Carcinomas of the Breast as Detected by Nonequilibrium pH Gradient Electrophoresis and Mass Spectrometry. Journal of Biomedicine and Biotechnology. 2008;2008:10
4. National Breast Cancer Foundation I. Types of Breast Cancer. US: National Breast Cancer Foundation. 2010
5. Stafford LJ, Vaidya KS, Welch DR. Metastasis suppressors genes in cancer. Int J of Biochem & Cell biol. 2008;40:874-891
6. Schoppmann SF, Horvat R, Birner P. Lymphatic vessels and lymphagiogenesis in female cancer: Mechanisms, clinical impact and possible implications for anti-lymphangiogenic therapies (Review). Oncology reports. 2002:455-460
7. Society AC. AJCC Cancer Staging Manual-Fifth Edition. Lippincott-Raven. 1997
8. Kyte J, Doolittle RF. A simple method for displaying the hydropathic character of a protein. Journal of Molecular Biology. 1982;157:105-132
9. Wallin E, Heijne GV. Genome-wide analysis of integral membrane proteins from eubacterial, archaean, and eukaryotic organisms. Protein Science. 1998;7:1029-1038
10. Tan S, Tan HT, Chung MCM. Membrane proteins and membrane proteomics. PROTEOMICS. 2008;8:3924-3932
11. Michalak M, Corbett EF, Mesaeli N, NAkamura K, Opas M. Calreticulin: one protein, one gene, many functions. Biochem J. 1999;344:281-292
12. Burns K, Michalak M. Interactions of calreticulin with proteins of the endoplasmic and sarcoplasmic reticulum membranes. FEBS Letters. 1993;318:181-185
13. Erić A, Juranić Z, Milovanović Z, Marković I, Inić M, Stanojević-Bakić N, Vojinović-Golubović V. Effects of Humoral Immunity and Calreticulin Overexpression on Postoperative Course in Breast Cancer. Pathology and Oncology Research. 2009;15:89-90
14. Lwin Z-M, Guo C, Salim A, Yip GW-C, Chew F-T, Nan J, Thike AA, Tan P-H, Bay B-H. Clinicopathological significance of calreticulin in breast invasive ductal carcinoma. Mod Pathol. 2010;23:1559-1566
15. Gunning P, Helfman DM, Flynn P, Khan P, Saeed A. Tropomyosin as a Regulator of Cancer Cell Transformation. In Tropomyosin. New York: Springer. 2008:124-131
16. Lin JLC, Geng X, Bhattacharya SD, Yu J-R, Reiter RS, Sastri B, Glazier KD, Mirza ZK, Wang KK, Amenta PS. et al. Isolation and sequencing of a novel tropomyosin isoform preferentially associated with colon cancer. Gastroenterology. 2002;123:152-162
17. Pieples K, Arteaga G, Solaro RJ, Grupp I, Lorenz JN, Boivin GP, Jagatheesan G, Labitzke E, deTombe PP, Konhilas JP. et al. Tropomyosin 3 expression leads to hypercontractility and attenuates myofilament length-dependent Ca2+activation. American Journal of Physiology - Heart and Circulatory Physiology. 2002;283:H1344-H1353
18. Calderwood SK, Khaleque MA, Sawyer DB, Ciocca DR. Heat shock proteins in cancer: chaperones of tumorigenesis. Trends in biochemical sciences. 2006;31:164-172
19. Rohde M, Daugaard M, Jensen MH, Helin K, Nylandsted J, Jäättelä M. Members of the heat-shock protein 70 family promote cancer cell growth by distinct mechanisms. Genes & Development. 2005;19:570-582
20. Barnes JA, Dix DJ, Collins BW, Luft C, Allen JW. Expression of inducible Hsp70 enhances the proliferation of MCF-7 breast cancer cells and protects against the cytotoxic effects of hyperthermia. Cell Stress & Chaperones. 2001;6:316-325
21. Hodgkinson CP, Mander A, Sale GJ. Identification of 80K-H as a protein involved in GLUT4 vesicle trafficking. Biochem J. 2005;388:785-793
22. Forough R, Lindner L, Partridge C, Jones B, Guy G, Clark D. Elevated 80K-H protein in breast cancer: a role for FGF-1 stimulation of 80K-H. Int J Biol Markers. 2003;18:89-98
23. Boneberg EM, Legler DF, Hoefer MM, Ohlschlegel C, Steininger H, Fuzesi L, Beer GM, Dupont-Lampert V, Otto F, Senn HJ, Furstenberger G. Angiogenesis and lymphangiogenesis are downregulated in primary breast cancer. Br J Cancer. 2009;101:605-614
24. Fu X-M, Dai X, Ding J, Zhu B. Pancreas-specific protein disulfide isomerase has a cell type-specific expression in various mouse tissues and is absent in human pancreatic adenocarcinoma cells: implications for its functions. Journal of Molecular Histology. 2009;40:189-199
25. Kimura T, Hosoda Y, Kitamura Y, Nakamura H, Horibe T, Kikuchi M. Functional differences between human and yeast protein disulfide isomerase family proteins. Biochemical and Biophysical Research Communications. 2004;320:359-365
26. Lumb RA, Bulleid NJ. Is protein disulfide isomerase a redox-dependent molecular chaperone? EMBO J. 2002;21:6763-6770
27. Somiari RI, Somiari S, Russell S, Shriver CD. Proteomics of breast carcinoma. Journal of Chromatography B. 2005;815:215-225
28. Delpino A, Castelli M. The 78 kDa Glucose-Regulated Protein (GRP78/BIP) Is Expressed on the Cell Membrane, Is Released into Cell Culture Medium and Is Also Present in Human Peripheral Circulation. Bioscience Reports. 2002;22:407-420
29. Lee E, Nichols P, Groshen S, Spicer D, Lee AS. GRP78 as potential predictor for breast cancer response to adjuvant taxane therapy. International Journal of Cancer. 2011;128:726-731
30. Xing X, Lai M, Wang Y, Xu E, Huang Q. Overexpression of glucose-regulated protein 78 in colon cancer. Clinica Chimica Acta. 2006;364:308-315
31. Frickel E-M, Frei P, Bouvier M, Stafford WF, Helenius A, Glockshuber R, Ellgaard L. ERp57 Is a Multifunctional Thiol-Disulfide Oxidoreductase. Journal of Biological Chemistry. 2004;279:18277-18287
32. Zhang Y, Baig E, Williams DB. Functions of ERp57 in the Folding and Assembly of Major Histocompatibility Complex Class I Molecules. Journal of Biological Chemistry. 2006;281:14622-14631
33. Ryu JW, Kim HJ, Lee YS, Myong NH, Hwang CH, Lee GS, Yom HC. The Proteomics Approach to Find Biomarkers in Gastric Cancer. J Korean Med Sci. 2003;18:505-509
34. Innocenti F, Kuramitsu Y, Nakamura K. Proteomic Analysis in Cancer Patients. In Genomics and Pharmacogenomics in Anticancer Drug Development and Clinical Response. Humana Press. 2009:33-45
Author contact
![]() Corresponding author: Lay-Harn Gam, School of Pharmaceutical Sciences, Universiti Sains Malaysia, 11800 USM, Penang, Malaysia. Telephone: 604-6532208 Fax no: 604-6570017 E-mail: layharnmy.
Corresponding author: Lay-Harn Gam, School of Pharmaceutical Sciences, Universiti Sains Malaysia, 11800 USM, Penang, Malaysia. Telephone: 604-6532208 Fax no: 604-6570017 E-mail: layharnmy.