International Journal of Biological Sciences
ISSN: 1449-2288
10
Impact Factor
ISSN: 1449-2288

 Global reach, higher impact
Int J Biol Sci 2013; 9(2):156-163. doi:10.7150/ijbs.5225 This issue Cite
Research Paper
Adaptive Bayesian Approach to Clinical Trial Renal Impairment Biomarker Signal from Urea and Creatinine
Pierre-Edouard Sottas1 ![]() , Gordon F. Kapke2, Jean-Marc Leroux1
, Gordon F. Kapke2, Jean-Marc Leroux1
1. Covance Central Laboratory, 1217 Geneva, Switzerland.
2. Covance Central Laboratory, 8211 SciCor Drive, Indianapolis, Indiana, USA.
Received 2012-9-15; Accepted 2012-12-19; Published 2013-1-26
Citation:
Sottas PE, Kapke GF, Leroux JM. Adaptive Bayesian Approach to Clinical Trial Renal Impairment Biomarker Signal from Urea and Creatinine. Int J Biol Sci 2013; 9(2):156-163. doi:10.7150/ijbs.5225. https://www.ijbs.com/v09p0156.htm
Other stylesAbstract
A major concern with the identification of renal toxicity using the traditional biomarkers, urea and creatinine, is that toxicity signal definitions are not sensitive to medically important changes in these biomarkers. Traditional renal signal definitions for urea and creatinine have not adequately identified drugs that have generated important medical issues later in development. Here, two clinical trial databases with a posteriori known drug induced renal impairment were analyzed for the presence of a renal impairment biomarker signal from urea (590 patients; age 26-92, median 65) and creatinine (532 patients; age 26-97, median 65). Data was analyzed retrospectively using multiple definitions for the biomarker signal to include values outside stratified reference intervals, values exceeding twofold increases from baseline, values classified by the 2009 NIAID renal toxicity table, change from baseline represented as a Z-score based on intra-individual biological variations, and an adaptive Bayesian methodology that generalizes population- with individual-based methods for evaluating a biomarker signal. The data demonstrated that the adaptive Bayesian methodology generated a prominent drug induced signal for renal impairment at the first visit after drug administration. The signal was directly related to dose and time of drug administration. All other data analysis methods produced none or significantly weaker signals than the adaptive Bayesian approach. Interestingly, serum creatinine and urea are able to detect early kidney dysfunction when the biomarker signal is personalized.
Keywords: renal toxicity, biomarker signal, biologic variation, adaptive design, individual reference ranges, Bayesian inference.
Introduction
Drug induced safety issues, to include renal impairment, continue to be a significant reason that drugs fail the development process [1]. New markers of nephrotoxiciy have been proposed and validated [2]. However, the ability to identify drug induced renal function changes during the development process continues to be a challenge. The traditional renal biomarkers of urea and creatinine are frequently obtained in all phases of clinical trials as these markers are accessible, analytically stable [3], and cost effective, but viewed as insensitive and non-specific monitors of renal function [4]. The non-specific nature of urea and creatinine as renal markers may be advantageous in clinical trials if the ability to identify drug induce renal impairment can be improved. Therefore, a sensitive statistical tool to identify drug induced changes in renal function, using these traditional biomarkers, will be valuable in the drug development process.
The key element to identify a drug induced change in renal function from serum urea and creatinine is understanding that small changes are significant for these biomarkers. Multiple definitions of a toxicity signal exist such as published toxicity tables, identifying values outside the reference interval, using multiples of the reference interval, evaluating multiples of the baseline value (2 fold increase, 3 fold increase), and % change from baseline. These definitions of a drug induced signal often fail because important drug induced changes for serum urea or creatinine will be small relative to the reference interval. Alternatively stated, the Index of Individuality (IOI = CVi/CVg where CVi is the intra-individual biological variability and CVg is the inter-individual biological variability) is 0.67 for urea and 0.56 for creatinine [5]. These IOIs demonstrate that there is marked individuality in a subject's baseline value.
A Z-score can be defined as the number of standard deviations between a visit value and a baseline mean:
(1)
where CVa is the coefficient of analytical variation and n is the number of baseline readings [5]. Assuming a CVa of 5%, the 99% confidence interval (Z=±2.58) for a change from two baseline values, and given CVi's of 5%, 10%, and 20%, the important change for an analyte value is approximately 22%, 35%, and 65% increases from the baseline mean respectively. These % changes could easily be masked by the definition of the renal impairment signal.
The CVi for Creatinine is typically about 5% while urea's CVi is typically in the range of 10% [5]. Consequently looking at Z=2.58 shift in the patient's values, a 22% change in a serum creatinine value or a 35% change in a urea value, should be identified as a potential drug effect in a subject in a clinical trial. In comparison, if the mean value of the reference interval is used, 75 µmol/L for creatinine and 5.0 mmol/L for urea, the absolute changes would be 16.5 µmol/L (final value 91.5 µmol/L) for creatinine and 1.8 mmol/L for urea (final value of 6.8 mmol/L). These changes are well within the reference intervals (see Methods for reference intervals) and all traditional definitions of renal impairment for urea and creatinine would be negative for more than half of the trial population if all subjects had a significant increase in biomarker value based on the estimated % CVi.
The solution for improving the sensitivity of urea and creatinine as renal toxicity markers is to move from a traditional fixed limit definition of a toxic signal to a statistical evaluation of the signal. A Z-score approach of defining an important change from the biological and analytical variation is partial solution to this issue [5]. Recently, it has been shown that both traditional reference intervals and Z-score formulas are two particular cases of a more general adaptive Bayesian model [6]. Population CVi and CVg can be used as prior information in a Bayesian network (BN) to move from population- to individual-based intervals as the number of individual readings increases. Heterogeneous factors leading to stratified reference intervals (such as age and gender) can be integrated in the BN to further remove between-subject variation. An assumption in the Z-score formula is that the population %CVi is constant across the population. By moving to an adaptive Bayesian approach, the detection algorithm is customized for biomarker and subject thereby minimizing assumptions and maximizing the sensitivity of signal identification. The adaptive Bayesian approach has been successfully applied for the evaluation of biomarkers as formalized in the so-called biological passport [7-8].
Biomarker signal defined statistically and detected through a very sensitive statistical technique may find an unimportant signal. However, in Phase I and Phase II trials where populations are small, identifying a signal permits one to watch the signal in the development process to see if the signal becomes medically important [9]. The lack of a toxicity signal viewed through a very sensitive statistical tool early in the development process minimizes the risk of a toxicity being found later in development. Two Phase III clinical trial datasets, with known drug induced renal impairment, are analyzed for a renal impairment signal by traditional methods and an adaptive Bayesian approach in this report. Interestingly, the knowledge of renal impairment makes it possible to estimate the specificity (control group) and sensitivity (treated group) of the applied methods for the first visits post-administration when the signal is most probably weak.
Methods
Two Phase III clinical trial datasets, one for urea, one for creatinine, were analyzed retrospectively. These datasets were chosen due to a weak drug induced renal impairment. The clinical trial database for urea was composed of 590 patients (aged 26-92, median 65) distributed among the placebo (200 patients) and two drug concentrations (group 1: 194 patients, group 2: 196 patients). The creatinine clinical trial database had 532 patients (aged 26-97, median 65) distributed among the placebo (178 patients) and two drug concentrations (group 1: 174 patients, group 2: 180 patients). The patients had between 1 and 3 pre-treatment visits and data was analyzed for the first 3 visits after drug administration. Group 2 had twice the drug dose of group 1.
The blood for the urea and creatinine measurements was collected in BD vacutainers (Becton Dickinson, Franklin Lakes, NJ), serum separated by the site, and transported to a central laboratory (Covance Central Laboratory). All samples were electronically reviewed for receipt within stability. Samples were analyzed on Roche chemistry analyzers (Roche, Basel, Switzerland) using Roche urea and rate blanked compensated alkaline picrate creatinine reagents.
All statistical simulations were performed on Matlab version 7.7.0 with Statistics Toolbox version 7.0 (Mathworks, Natick, MA). One-sided Kolmogorov-Smirnov tests were used for hypothesis testing. The following stratified reference intervals were used for creatinine: males 18-50 years, 40-110 µmol/L; females 18-70 years, 31-101 µmol/L; males 50-70 years, 40-119 µmol/L; males 70-80 years, 40-137 µmol/L; females 70-80 years, 31-110 µmol/L; males >80 years, 40-145 µmol/L; females >80 years, 31-128 µmol/L (Covance Central Laboratory) and for urea: males and females 18-70 years , 1.4-8.6 mmol/L; males and females 70-80 years, 1.4-10.4 mmol/L; males and females >80 years, 1.4-12.1 mmol/L (Covance Central Laboratory).
Toxicity of grade 1 were computed for all data following the 2009 toxicity table of the National Institute of Allergy and Infectious Disease (NIAID). This table lists a grade 1 creatinine toxic value as 1.1 to 1.5 times the upper limit of normal (ULN) and a urea toxic value as 1.25 to 2.5 ULN.
The adaptive Bayesian approach was implemented in a hierarchical BN (see Figure 1) with biomarker signal decomposed into within-subject and between-subject components. The construction of the BN has been described in detail elsewhere [6;10]. It is assumed that a series of urea or creatinine values is normally distributed with mean and variance specific to each subject. Prior distributions of within-subject variation (denoted in Figure 1 by the variable CVi) and of the mean have been modeled as follows. The CVi is assumed to be log-normally distributed with geometric mean (GM) equal to -1.97 and -2.6 and geometric standard deviation (GSD) equal to 0.14 and 0.095, for urea and creatinine respectively. With these parameters, the 99%-interval of prior distribution of CVi is [8-22]% for urea and [5.6-9.2]% for creatinine. The mean is assumed to be log-normally distributed with GM=0.89 and GSD of 0.15 for urea, GM=3.92 and GSD=0.13 for creatinine. The latter GSD gives the amplitude of the between-subject variations post-stratification. The stratification according to gender and age was modeled so that to obtain the stratified reference intervals given above (assuming 99%-intervals). A BN was associated to each subject, with age and gender integrated as evidence in the BN before the start of the trial. Then, Bayesian inference techniques were used to iteratively and adaptively integrate pre-treatment visit values. Posterior distributions of expected values were generated by the BN to analyze the values obtained in treatment. Finally, 99%-intervals were computed as the 0.5 and 99.5 percentiles of the posterior distributions. These intervals can be viewed as biomarker and subject and pre-treatment data specific reference intervals.
Figure 1
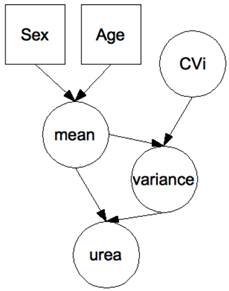
Hierarchical Bayesian network for the evaluation of urea data. Each node represents a variable (circle: continuous; square: discrete), each arrow a causal relationship between the variables. Differences in the biomarker according to gender and age were modeled so that to obtain stratified population-based reference ranges when no prior measurement is available on a patient. There is one network per patient with the patient's age and gender entered as hard evidence before the start of the trial. Urea measurements are then entered as hard evidence in the course of the trial, with Bayesian inference used to move adaptively from population-based to patient-specific distributions of the hidden variables “mean” and “variance”. Although not undertaken here, the effect of the drug can be modeled by the addition of a variable “drug”, typically a discrete variable with a number of classes equal to the number of arms in the trial. Similarly, a known (or potential) genetic polymorphism affecting either the marker or the effect of the drug on the marker can be introduced for still improved personalization [8].
In addition to testing single visit values, the BN was also used to test sequences of visit values obtained after treatment [6]. For example, if the first two visit values fall both at the 95th percentile of the distribution of expected values, the sequence composed of these two values falls approximately at the 99.75 percentile of the distribution of expected sequences of length 2. It has been shown that the latter approach has a significantly better sensitivity in the analysis of longitudinal biomarker data in the presence of a weak, but consistent over time, signal [9-11].
On pre-treatment data, an analysis of variance returned a CVi of 14% for urea and 6% for creatinine. These CVi were used in the Z-score formula of Equation (1). The magnitude of the Z-score is a measure in standard deviations of how far the value has moved from the baseline values. It has been shown that the Z-score formula of Equation (1) is a particular case of the BN described above [10]. The BN gives the same results as the Z-score formula when (1) between-subject variations are assumed to be infinite, (2) the CVi is assumed to be universal (i.e. no subject-based CVi) and (3) no heterogeneous factors are taken into account [10]. Similarly, by design, the reference intervals returned by the BN before the integration of any individual biomarker data correspond to the traditional reference intervals stratified according to age and gender [11].
Results
Table 1 is a tabulation of the results from the two clinical trial databases. The greatest false-positive signal for both urea and creatinine was % values above the reference intervals. The adaptive Bayesian approach applied to single visit values or to sequences returned false-positive signals between 0.5 and 3.2%. These results are in agreement with a theoretical rate of 1% induced by the use of 99%-intervals. The mean and SD baseline values for urea and creatinine values across the cohorts are very similar (control, group 1, group 2 respectively, urea mean, 5.7, 5.8, 5.6 mmol/L, SD, 1.8, 1.9, 1.6 mmol/L ; creatinine, 75.6, 76.6, 76.4 µmol/L, SD 20.5, 17.9, 22.7 µmol/L) prior to the administration of the drug indicating a well-executed randomization of the patients. The number of subjects per visit ranged from 187 to 173 for the urea data and ranged from 178 to 77 for the creatinine data. The number of patients for the creatinine measurement decreased by approximately 50%, by design, in moving across the visits. The creatinine mean values increased with time and drug dose while the urea mean values increased most directly with drug dose.
Table 1
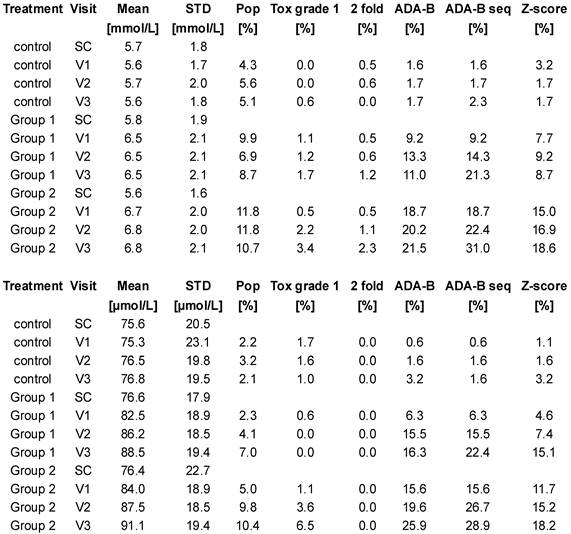
Results from the clinical trial databases for urea (top) and creatinine (bottom). SC: screening visits, V1: visit 1, V2: visit 2, V3: visit 3. Pop: % of values out of the population-based reference intervals. Tox grade 1: % of values with a toxicity grade 1 according to NIAID 2009 list. 2 fold: % of values with more than 200% increase from baseline mean. ADA-B: % of values outside the reference intervals computed by the adaptive Bayesian model. ADA-B seq: % of sequences outside the reference intervals computed by the adaptive Bayesian model. Z-score: % of values with Z-score higher than 2.58.
Table 1 compares the different signal definitions over time after drug administration. The data demonstrated a dose and time dependence on signal generation. A small signal was found with the traditional signal definitions of % high flags, NIAID toxicity grade 1, and 2 fold increases from baseline values. The Z-score approach generated a substantial signal. The adaptive Bayesian approach was the most sensitive at defining a signal. The adaptive Bayesian analysis of sequences was still more sensitive than the Bayesian approach based on a single visit value. No values were observed with a toxicity grade greater than 1, no values exceeded twice the upper limit of the reference interval, and no values were observed with a 3 fold increase or greater.
At the population level, the mean values by group and visit show that the mean values increased after drug administration. Although the increases in mean values are small relative to the reference intervals, all increases were significant since the first visit in-treatment (p<0.01).
In Figure 2, the graphs of % change from baseline to the adaptive Bayesian Z-value demonstrate the same % change can have different Z values and that the placebo distributions are different from the drug treated patient distributions. Treated patients have a greater % change and higher Z values. Placebo patients have only one Z greater than 3 for urea and 2 Z greater than three for creatinine.
Discussion
The adaptive Bayesian methodology generated a prominent drug induced signal for renal impairment on both analytes at the first visit after drug administration. The signal was directly related to dose and time of drug administration. All traditional definition of renal toxicity produced none or significantly weaker signals than the adaptive Bayesian approach.
A dose dependent increase in the adaptive Bayesian sequential signal indicates a drug effect is present and is increasing over time. The data shows that a drug effect can be identified at the first time point after drug administration. The population values for urea increase from a mean of 5.6 mmol/L in the control group to 6.8 mmol/L in the treated group. This urea change, although significant from a statistical point of view, is difficult to interpret from a biological perspective as this change remains in the reference interval and the renal handling of urea is complex and dependent on patient hydration. Subsequently, these urea values are not remarkable. The increase in the population's mean creatinine value of 75 µmol/L to 91 µmol/L is more easily interpreted relative to the Modification of Diet in Renal Disease (MDRD) equation [12]. The MDRD equation shows that GFR is inversely related to serum creatinine values. Subsequently, an increase in the group 2 creatinine results of 21% by Visit 3 results in a decrease in the population GFR by 16%. The signal definition for renal toxicity needs to reliably identify this magnitude of population serum creatinine increase.
The out-of-reference range high values and toxicity grade 1 values do provide an indication of a drug effect and as the results are different between the placebo and treated groups. The observed differences are small and difficult to define as an actionable signal. The weak signal could be due to noise in the system, due to expected disease related changes, or a function of the patient's baseline value being close to the upper limit of the reference interval. The comparison of the out of range high results to the toxicity grade 1 results would imply that the high flagged results were false-positives as the % high results are 2 to 3 times greater that the Tox grade 1 results.
The use of multiples of the reference interval (2 or 3 ULN) to define renal toxicity is less sensitive that the toxicity grade 1 limits. For instance calculating a Z-value using literature CVi values, at the boundary of 2 ULN from the low and high ends of the reference interval, the patient Z-values are very different. The Z-value change in moving from the lower limit of normal for urea and a male creatinine results to 2 times the ULN is Z=278 and Z=27 respectively. The Z-value change in moving from the upper limit of normal to 2 times the upper limit of normal is Z=152 for a urea result and Z=17 for a male creatinine result. This calculation demonstrates that the probability of generating a toxicity signal varies greatly with the baseline value and reference interval using traditional definitions of the biomarker signal. Also multiples of the reference interval require a substantial drug effect on the kidney to define a toxic signal as the Z-values are very high.
The drug effect is concentration and time dependent using the adaptive Bayesian methodology to calculate the signal. The false-positive reference interval high results were significantly greater for both biomarkers than the % mean false-positive adaptive Bayesian results. The false-positive adaptive Bayesian signal is in the range of one tenth of the true signal. On the contrary, the false-positive rate for the % above the reference interval signal was approximately 50% of the treated group's signal. The toxicity grading had a low false-positive rate equal to the adaptive Bayesian approach. However, the toxicity grading had a very low rate of true positive signal identification also. The adaptive sequential Bayesian analysis rapidly produced a signal that exceeded the signal from the traditional definitions.
Figure 2
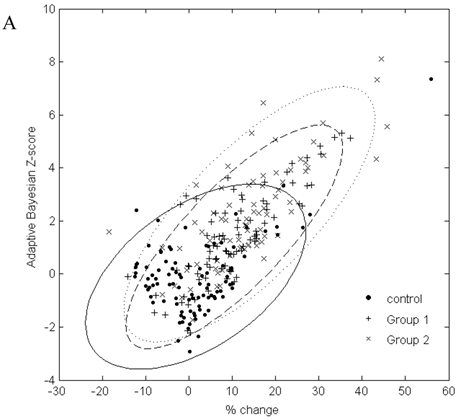
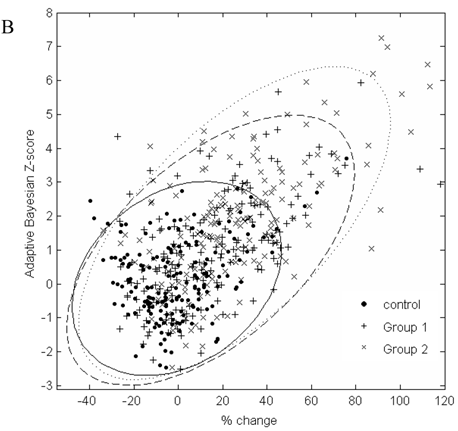
A. Scatterplot of % change in visit 3 creatinine data from baseline to the result of the adaptive Bayesian approach (represented here as a Z-score). Ellipse fit: solid line for control; dashed line for Group 1; dotted line for Group 2. B. Scatterplot of % change in visit 3 urea data from baseline to the result of the adaptive Bayesian approach (represented here as a Z-score). Ellipse fit: solid line for control; dashed line for Group 1; dotted line for Group 2.
The adaptive Bayesian approach identified a drug effect on both analytes at the first visit after drug was administered on a significant number of patients. The rapid identification of a drug induced effect on renal function permits the rapid medical evaluation of this observed effect and, if appropriate, generate requests for additional renal biomarker data to define the mechanism and magnitude of the effect on key kidney function parameters. The same approach has been successfully applied for the evaluation of creatinine data in early phase clinical trials [9].
The data in Figure 2 shows a marginal correlation of the % change from baseline to the adaptive sequential Bayesian Z-value results. The uncertain part of looking at % change from baseline is that the significance of the same % change from baseline will be different for different biomarkers and subjects. The % change from baseline methodology creates difficulties in scoring individual patients as having moved significantly from the baseline value. The challenge of a development protocol is to move from population data to individual patient data and be able to identify the individual patient who needs to be medically evaluated. The adaptive Bayesian approach precisely identifies the individual patients that need medical evaluation. This dataset provides insight as to the magnitude of an adaptive Bayesian signal with a change in the population mean value. An approximate 20% change in the urea mean biomarker value generated an adaptive Bayesian signal for 31% of the treated subjects while the toxicity grade 1 signal was 3.4%. An approximate 20% change in the creatinine mean value generated an adaptive Bayesian signal for 29% of the treated subjects while the tox grade 1 signal was 6.5%.
Change from baseline analysis makes defining the point of significant change more difficult than the adaptive Bayesian Z value approach as the same % change has a different statistical meaning across biomarkers and across subjects. The adaptive Bayesian approach will identify the specific patients that have changed from the baseline value and minimize the dilution of true positives with false-positive observations.
Both the creatinine and urea concentrations were rapidly effected by the drug even though the mechanism of clearance of creatinine and urea are significantly different. If renal impairment using non-specific markers such as creatinine and urea can reliably identify important changes from baseline with the adaptive Bayesian approach, the non-specific nature of these biomarkers may be very appropriate for first line screening of renal effects in clinical trial populations. Although much has been done by the Predictive Safety Testing Consortium (PTSC) to find new clinically relevant biomarkers of renal function [13], our study suggests that conventional biomarkers like creatinine and urea are able to detect early kidney dysfunction when using individual reference ranges. Also, the personalization of a biomarker signal makes possible the evaluation of drug efficacy and safety on an individual basis and in turn to tailor drug therapy at a dosage that is most appropriate for an individual patient. Correlations with genotyping data on metabolic pathways in drug metabolism may be searched for still improved personalization [14].
A further advantage of the adaptive Bayesian approach is that as one looks at historical biomarker data, the approach is independent of the analytical method and the reference interval and therefore is very appropriate for data-mining historical data sets. Data mining using the adaptive Bayesian approach should permit one to take clinical issues identified in large datasets and follow the biomarker data back through the phases of development. If a signal is found in early small populations, the long-term implications of small signals in early phases of development can be more thoroughly understood.
Conclusions
Two Phase III clinical trial datasets were used to evaluate traditional methods of renal impairment and an adaptive Bayesian approach. These two datasets were appropriate for this analysis because they present a weak increase in mean urea and creatinine values after drug administration as well as a known drug induced renal impairment. Traditional definition of toxicity limits such as greater than the upper limit of normal, toxicity table ranges, multiples of the reference interval, and greater than 2 or 3 fold changes from the baseline value all suffer from low sensitivity of signal generation and varying probabilities that the threshold will be exceed dependent on the baseline value. The % change from baseline is better than the fixed limit methods however there is not a single % change from baseline to define a significant signal for all biomarkers and for the same biomarker across subjects. The significance of a fixed value for the % change from baseline varies depending on the subjects CVi of the biomarker. The adaptive Bayesian approach using all known factors provided superior sensitivity and specificity in these two large clinical trials for drug dependent renal impairment signal generation.
Competing Interests
Stock ownership: G.F. Kapke, Covance; J.-M. Leroux, Covance.
References
1. Kola I, Landis J. Can the pharmaceutical industry reduce attrition rates? Nat Rev Drug Disc. 2004;3:711-8
2. Dieterle F, Sistare F, Goodsaid F. et al. Renal biomarker qualification submission: a dialog between the FDA-EMEA and Predictive Safety Testing Consortium. Nat Biotechnol. 2010;28:455-62
3. Wilson SS, Guillan RA, Hocker EV. Studies of the stability of 18 chemical constituents of human serum. Clin Chem. 1972;18:1498-1503
4. Vaidya V, Ferguson MA, Bonventre JV. Biomarkers of acute kidney injury. Annu Rev Pharmocol Toxicol. 2008;48:463-93
5. Fraser CG. Biologic Variation: Principles and Practice. Washington DC, USA: AACC Press. 2001
6. Sottas PE, Baume N, Saudan C. et al. Bayesian detection of abnormal values in longitudinal biomarkers with an application to T/E ratio. Biostatistics. 2007;2:285-96
7. Sottas PE, Robinson N, Saugy M. The athlete's biological passport and indirect markers of blood doping. Thieme D and Hemmershach P (eds) Doping in Sports. Handbook of Experimental Pharmacology, vol 195. Berlin: Springer. 2010
8. Sottas PE, Robinson N, Rabin O. et al. The athlete biological passport. Clin Chem. 2011;57:969-76
9. Sottas PE, Kapke GF, Leroux JM. Adaptive bayesian analysis of serum creatinine as a marker for drug-induced renal impairment in an early-phase clinical trial. Clin Chem. 2012;58:1592-6
10. Sottas PE, Robinson N, Saugy M. et al. A Forensic Approach to the Interpretation of Blood Doping Markers. Law Prob Risk. 2008;7:191-210
11. Sottas PE, Kapke GF, Vesterqvist O. et al. Patient-specific measures of a biomarker for the generation of individual reference intervals: hemoglobin as example. Transl Res. 2011;158:360-8
12. National Kidney Foundation. K/DOQI clinical practice guidelines for chronic kidney disease: evaluation, classification, and stratification. Am J Kidney Dis. 2002;39:1-266
13. Dieterle F, Sistare F, Goodsaid F. et al. Renal biomarker qualification submission: a dialog between the FDA-EMEA and Predictive Safety Testing Consortium. Nat Biotechnol. 2010;28:455-62
14. Suhre K, Shin SY, Petersen AK. et al. Human metabolic individuality in biomedical and pharmaceutical research. Nature. 2011;477:54-60
Author contact
![]() Corresponding author: Pierre-Edouard Sottas, Covance Central Laboratory, 1217 Geneva, Switzerland.
Corresponding author: Pierre-Edouard Sottas, Covance Central Laboratory, 1217 Geneva, Switzerland.
Citation styles
APA
Sottas, P.E., Kapke, G.F., Leroux, J.M. (2013). Adaptive Bayesian Approach to Clinical Trial Renal Impairment Biomarker Signal from Urea and Creatinine. International Journal of Biological Sciences, 9(2), 156-163. https://doi.org/10.7150/ijbs.5225.
ACS
Sottas, P.E.; Kapke, G.F.; Leroux, J.M. Adaptive Bayesian Approach to Clinical Trial Renal Impairment Biomarker Signal from Urea and Creatinine. Int. J. Biol. Sci. 2013, 9 (2), 156-163. DOI: 10.7150/ijbs.5225.
NLM
Sottas PE, Kapke GF, Leroux JM. Adaptive Bayesian Approach to Clinical Trial Renal Impairment Biomarker Signal from Urea and Creatinine. Int J Biol Sci 2013; 9(2):156-163. doi:10.7150/ijbs.5225. https://www.ijbs.com/v09p0156.htm
CSE
Sottas PE, Kapke GF, Leroux JM. 2013. Adaptive Bayesian Approach to Clinical Trial Renal Impairment Biomarker Signal from Urea and Creatinine. Int J Biol Sci. 9(2):156-163.
This is an open access article distributed under the terms of the Creative Commons Attribution (CC BY-NC) License. See http://ivyspring.com/terms for full terms and conditions.