Impact Factor ISSN: 1449-2288

 Global reach, higher impact
Int J Biol Sci 2013; 9(6):613-623. doi:10.7150/ijbs.6162 This issue Cite
Research Paper
Effects of Cigarette Smoke Extracts on the Growth and Senescence of Skin Fibroblasts In Vitro
Gao-yun Yang1 ![]() , Chun-lei Zhang2, Xiang-chen Liu1, Ge Qian3
, Chun-lei Zhang2, Xiang-chen Liu1, Ge Qian3 ![]() , Dan-qi Deng3
, Dan-qi Deng3
1. Department of Dermatology, Beijing Friendship Hospital, Capital Medical University, Beijing, China.
2. Department of Dermatology, Peking University Third Hospital. Haidian District, Beijing, China.
3. Department of Dermatology and Rheumatology, The 2nd Affiliated Hospital of Kunming Medical University, Kunming, China.
Received 2013-2-27; Accepted 2013-5-27; Published 2013-6-28
Abstract
Epidemiological studies have shown that cigarette smoke (CS), a very common environmental factor, plays an important role in skin aging. Although some in vivo studies have suggested that CS affects skin aging, the detailed effects of CS on skin cells in vitro remain largely unknown. In this study, we investigated the effects of cigarette smoke extract (CSE) on the growth, proliferation, and senescene of skin fibroblasts and the possible mechanism underlying these effects. Primary cultured human fibroblasts were exposed to a range of concentrations of CSE. Cell viability and cell proliferation after CSE exposure were analyzed with the methyl thiazolyl tetrazolium (MTT) assay and bromodeoxyuridine incorporation assay, respectively. Growth curves of fibroblasts exposed to different concentrations of CSE were developed and prolonged CSE-exposed cells were observed. Morphological and ultrastructural changes in fibroblasts were assessed by inverted light microscopy and transmission electron microscopy (TEM). Dying cells were stained with senescence-associated β-galactosidase (SA β-gal). Intracellular reactive oxygen species (ROS) levels, superoxide dismutase (SOD) activity, and glutathione peroxidase (GSH-Px) activity were determined by a colorimetric method. We found that proliferative capacity and growth were inhibited by CSE exposure in a dose- and time-dependent manner. Fibroblasts exposed to even low concentrations of CSE for a long period of time (5 passages) showed significantly increased SA β-gal activity and typical features of aging cells. Meanwhile, CSE inhibited superoxide dismutase (SOD) and glutathione peroxidase (GSH-Px) activities and augmented ROS levels. Our observations suggest that CSE exposure impairs fibroblast growth and proliferation and leads to features similar to those seen in senescent cells. Oxidative stress injury and inhibition of antioxidant defense activity may be involved in CSE-induced fibroblast senescence.
Keywords: skin fibroblasts, senescence, growth, cigarette smoke extract, senescence-associated β-galactosidase.
Introduction
The skin provides the first barrier against environmental factors that can physically and/or chemically alter the body's functions. Numerous environmental pollutants affect skin health and play a role in skin pathogenesis. A convergence of evidence has shown that cigarette smoke (CS) and ultraviolet radiation are key environmental factors in the development of many chronic and malignant diseases [1-4].
Smoking has manifold effects on the skin and is associated with significant morbidity. The pro-aging effect of CS on skin was first reported about 40 years ago[5]. A set of facial features associated with smoking were defined in 1985 as “smoker's face”; these features are characterized by an accelerated appearance of aging, including wrinkling and sallow coloration of the face [5]. The effects of CS on skin aging were subsequently demonstrated in epidemiological studies and clinical reports [6,7]. Smoking is now considered an independent risk factor for the development of premature facial wrinkling and skin aging [6].
CS is a highly complex aerosol composed of several thousand chemical substances distributed between the gas and the particulate phase [8]. It affects the skin by two main pathways, namely direct exposure and absorption via the bloodstream. In fact, the skin of unexposed body parts in smokers and non-smokers alike may be affected by CS constituents when they are absorbed through the blood stream. Although in vivo studies have partly revealed the mechanism by which CS accelerates the aging of skin tissue[9], studies investigating the effects of CS on skin cells in vitro are lacking. In particular, unlike UV exposure effects on cells, which have been thoroughly examined, cellular senescence of skin cells and the mechanisms by which CS induces cell senescence have not been investigated thoroughly in vitro [6,9]. This lack of in vitro work is partly due to the fact that CS is a very complicated mixture, the components of which could play a synergistic role in skin damage. In this study, we investigated the mechanisms by which CS induces cellular senescence were investigated in primary cultured skin fibroblasts.
Because fibroblasts play a fundamental role in maintaining skin integrity [10], it is not surprising that inhibiting their growth with CS exposure would impair the skin's ability repair itself. However, the underlying mechanisms of CS-induced fibroblast growth inhibition are unclear. We hypothesized that CS not only reduces primary skin fibroblast proliferation but also leads to fibroblast senescence, a biological state associated with slowed cellular turnover. Here we sought to examine whether synergistic effects of CS on skin cell growth, proliferation, and senescence can be observed in vitro. We also examined the possible mechanisms by which CS may affect cellular longevity in skin fibroblasts with intracellular reactive oxygen species (ROS), superoxide dismutase (SOD) activity, and glutathione peroxidase (GSH-Px) activity assays.
Materials and methods
Culture of skin fibroblasts
This research, which was performed in accordance with the Declaration of Helsinki, was approved by the ethics committee of Beijing Friendship Hospital of Capital Medical University. Primary human skin fibroblasts were derived from the foreskins of 9 to 12 year-old boys after circumcision, since such samples are easily accessed for research purposes. Written informed consent was obtained from the parents of all of the specimen donors.
Skin fibroblasts were isolated and cultured as previously described [10]. Briefly, the samples were collected aseptically and washed several times with 75% alcohol and phosphate buffered saline (PBS) containing 1% antibiotic (100 U/ml penicillin/streptomycin) and antimycotic (100 U/ml amphotericin) solution. Full-thickness skin was treated with 4 mg/ml of dispase (Gibco, USA) for 1 h at 37 °C. Next, the epidermis was peeled from the dermis, which was then cut into small pieces and transferred into a falcon tube containing 0.03% collagenase type I solution (Gibco, USA). Pure dermis was digested in the incubator shaker at 37 °C for 6 h.
The digested cells were cultured in Dulbecco's modified Eagle medium (DMEM) supplemented with 10% fetal bovine serum, penicillin 100 U/ml and streptomycin 100 μg/m1, in 5% CO2, with saturated humidity at 37 °C. After 5-6 d, the cultured fibroblasts were harvested by trypsinization and the cultures were passaged into T25 culture flasks at 1:4. When the subcultures reached 80-90% confluence, serial passaging was performed by trypsinization. Cells from passage 5-8 were used in subsequent experiments when the cells reached the logarithmic growth phase.
Cigarette smoke extract (CSE) preparation
CSE solutions were prepared using Toru Nyunoya's method with modifications [11]. Briefly, one side of the pump was connected to the flask, the other to a cigarette. One cigarette (with paper and filter) was drawn in by a pump for 2 s at 1-min intervals and then cigarette smoke was pushed into 10 ml supplement-free DMEM through a multipore porcelain plate in the flask. The solution containing CSE was adjusted to a final pH of 7.4 with sodium bicarbonate water and filtered through a 0.22-µm filter. The concentrations of water-soluble ingredients in the stock CSE solution were equivalent and stable across experiments; the final CSE concentrations were always at saturation, which meant that each ingredient could not be absorbed anymore. The CSE solution was prepared immediately before being applied. The resultant solution was designated as a 100% CSE solution. The experimental concentrations of CSE were created by combining the CSE solution with DMEM.
Cell viability assays
Cells in the logarithmic growth phase were seeded on 96-well culture plates, with 1 × 10⁴ cells in each well. After 24 h in culture, the cells were evenly attached to the bottom of the plate. After 48 h, the medium was removed, and various concentrations of CSE supplemented with 10% fetal bovine serum, penicillin 100 U/ml and streptomycin 100 μg/ml were added. After 2 h, 12 h, 24 h, and 72 h, cell viability was dertermined by MTT assay using Fan-Ji Meng's method [12]. Absorbance in each well was determined at 490 nm with an enzyme-linked immunoassay detector. Cell viability was determined according to the follow equation: Cell survival rate = (absorbance in the CSE test group/absorbance in control group) × 100%.
Cell proliferation assay by bromodeoxyuridine (BrdU) incorporation
Cell proliferation was measured using a BrdU colorimetric kit (Roche Diagnostics). Briefly, cells were seeded in 96-well plates at a density of 1 × 10⁴/well and treated exactly as described above. After 12 h, cell proliferation was detected by BrdU assay as described by Gaofeng Wu [13]. Finally, absorbance was measured using a microplate reader at 450 nm with a reference wavelength of 690 nm.
Cell growth curve
Cells in the logarithmic growth phase were seeded on 24-well culture plates with 5 × 10⁴ cells in 1 ml of growth media in each well. After 24 h of culture with complete DMEM, the cells were evenly attached to the bottom of the plate. After removing the medium, various concentrations of CSE supplemented with 10% fetal bovine serum, penicillin (100 U/ml) and streptomycin (100 μg/ml) were added. The cells were cultured with complete CSE for 7 d, and the media was changed every other day. Cell concentration was recorded from three wells every 24 h using a hemocytometer. For each well, cells were harvested and counted three times.
Passage-5 cells were divided into two groups: one group was cultured with complete DMEM; the other group was cultured with 0.5% complete CSE. Both groups were continuously cultured for another 5 passages with complete DMEM and 0.5% complete CSE. Cells of passage 10 were used to generate growth curves using a 48-well plate with 3 × 10⁴ cells in each well. Deviating from the protocol described above, passage 11 cells from the two groups were maintained in the same complete DMEM.
Light microscopy and transmission electron microscopy (TEM)
Using an inverted light microscope, morphological changes were observed and photographed in passage 6 cells cultured with and without complete CSE at a concentration of 1.25% in 6-well culture plates for 24 h. For TEM analysis, cells were washed with PBS and centrifuged at 2000 × g for 5 min. The cell pellet specimen was prefixed with 1 mL 2.5% glutaraldehyde in 0.1 M phosphate buffer (pH 7.0) at 4 °C overnight, washed three times with 0.1 M phosphate buffer, fixed in 1% OsO4 for 2 h, and washed three times with 0.1 M phosphate buffer. The fixed cell specimen was dehydrated in an ethanol gradient (50%, 70%, 80%, 90%, 95%, and 100%) for 15 min at each step. The dehydrated specimen was drenched sequentially in acetone for 20 min and embedded in Epon-812. Sections of 70- to 90-nm thickness were cut using an ultramicrotome (OM U2; Reichert-Jung Co., Heidelberg, Germany) and were stained using uranyl acetate and alkaline lead citrate for 15 min. The sections were examined and photographed with a transmission electron microscope [14]
Galactosidase activity
Senescence-associated β-galactosidase (SA β-gal) staining was performed using histochemical methods [15]. SA β-gal is widely used as a biomarker for cellular senescence [16]. Cell samples from the two groups of cells at passage 10 were used, which were in turn derived from the same cells at passage 5. Cells in the control group were cultured with complete DMEM for 5 passages. Cells in the experimental group were cultured with 0.5% complete CSE for 5 passages. Cell samplesin 6-well chamber slides were fixed with 2% formaldehyde and 0.2% glutaraldehyde in PBS for 5 min at room temperature. The slides were rinsed with PBS and incubated with an SA β-gal staining solution containing 40 mM sodium citrate (pH 6.0), 150 mMNaCl, 5 mM potassium ferricyanide, 5 mM potassium ferrocyanide, 2 mM MgCl2, and 1 mg/ml of 5-bromo-4-chloro-3-indoyl β-D galactoside for 4 h. For long-term experiments, both groups were analyzed at the same time.
SOD and GSH-Px activity assays
Cells from passage 6 in the logarithmic growth phase were seeded in T75 culture flasks and maintained in complete DMEM for 48 h. The supernatant was then discarded and various concentrations of CSE were added to the flasks for 4 h. At the end of CSE exposure, the fibroblasts were washed with cold PBS three times, harvested with a 0.25% trypsin solution, and centrifuged at 1000 × g for 10 min. The supernatant was then discarded, and the cell bolus was sonicated in cold PBS. After centrifugation (800× g, 5 min), the supernatants were immediately evaluated for SOD and GSH-Px activity.
Measurement of intracellular ROS
The level of intracellular ROS was detected using the 2',7' dichlorfluorescein-diacetate (DCFH-DA) method [17], wherein the DCFH-DA dye is cleaved by cellular esterases into nonfluorescent 2′,7′-dichlorofluorescein (DCFH) and oxidized by ROS to yield the fluorescent dichlorofluorescein (DCF) product. After exposure to CSE for 2 h, cells were loaded with 10 μM DCFH-DA for 10 min at 34 °C. The fluorescence intensity of the cells was detected using a multi-detection micro plate reader (Bio-TEK, Vermont, USA) at 488 nm.
Statistical analysis
Data are expressed as mean ± SEM of n independent experiments. Comparisons of three or more groups were performed by ANOVA, followed by Bonferroni's test. Comparisons between two groups were performed by Student's t-test. P values < 0.05 were considered statistically significant. All analyses were performed using the Statistical Package for the Social Sciences (SPSS, Chicago, IL, USA) program.
Results
Cell population viability and proliferation
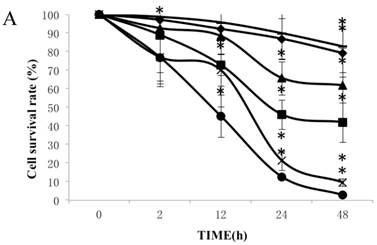
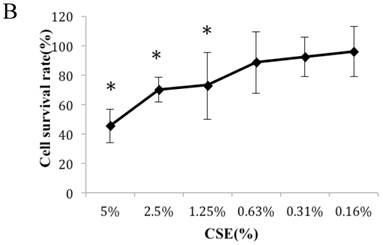
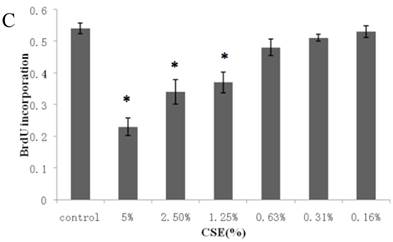
Figure 1A summarizes the kinetics of inhibition observed for skin dermal fibroblast populations grown in various concentrations of CSE. MTT assay experiments demonstrated a dose- and time-dependent reduction in the number of viable cells (Fig. 1B). Specifically, we observed a dose-dependent reduction in the number of viable cells at 12 h, which reached statistical significance at 1.25% CSE. At the 1.25% concentration of CSE, we observed a 27.2% inhibition of cell viability. As shown in figure 1C, 1.25% CSE also caused significant inhibition of cell proliferation as evidenced by reduced BrdU incorporation in CSE-exposed cells.
CSE effects on fibroblast growth and proliferation. (A) Growth kinetics, as assessed by MTT reduction assay, of cells treated with CSE at 5% (●), 2.5% (×), 1.25% (■), 0.625% (▲), 0.3125%(◆) and 0.15625 %(-) for 2 h, 12 h, 48 h, and 72 h. Data are expressed as means ± SEM. *P < 0.05 for CSE-exposed vs. untreated cells, ANOVA. (B) Dose-response analysis of cells treated with CSE at the indicated concentrations for 12 h. Data are expressed as means ± SEM of three independent experiments, each experiment was performed in quadruplicate. *P < 0.05 vs. untreated cells, ANOVA. (C) BrdU incorporation proliferation assay of fibroblasts exposed to CSE at the indicated concentrations for 12 h. Data are representative of three independent experiments, each performed in quadruplicate. *P < 0.05 vs. unexposed cells, ANOVA.
Cell growth
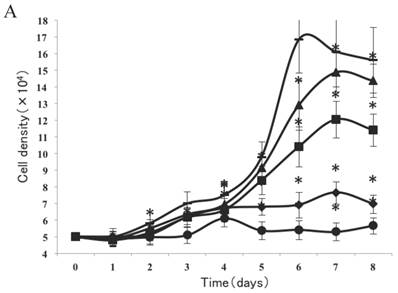
As shown in Figure 2A, a lag of around 24 h was apparent after the cells were seeded, which is an accepted recovery period after possible damage by the protease. Subsequently, cells without exposure to CSE proliferated rapidly and entered the exponential growth phase until they reached a stationary phase at ~6 d. As cell density increased, proliferation was reduced by contact inhibition [18] and the cells began to enter a plateau phase. Cells exposed to CSE at concentrations of 1% and 0.75% did not enter an obvious exponential growth phase (Fig. 2A). The peaks of the exponential growth phase were lowered and prolonged in cells exposed to lower CSE concentrations (0.5%, 0.25%), with a postponed plateau phase.
Analysis of CSE exposure on fibroblast growth over time. (A) Growth curves of skin fibroblasts exposed to 10% (●), 7.5% (◆), 5% (■), and 2.5% (▲) CSE and of CSE-unexposed cells(-). Data are expressed as means ± SEM, *P < 0.05 vs. untreated cells, ANOVA). (B) Growth curves of skin fibroblasts exposed to 0.5% CSE for 5 passages (■) and CSE-unexposed cells (◆). Each value represents a mean ± SEM (*P < 0.05 vs. unexposed cells; Student's t-test).
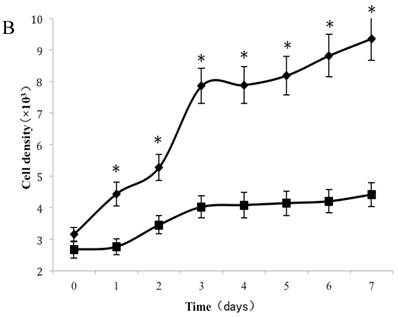
To test whether long-term and chronic exposures to low concentrations of CSE could induce cellular senescence, fibroblasts were cultured with either CSE-free complete medium or 0.5% CSE solution for up to 5 passages. As shown in Figure 2B, passage 11 cells cultured without CSE retained a normal growth curve with a normal exponential growth phase and plateau phase. On the other hand, although the cell culture medium was changed to normal DMEM, the passage-11 cells derived from cells exposed to 0.5% CSE for the first 5 passages did not grow normally, and lacked an obvious exponential growth phase.
Galactosidase activity
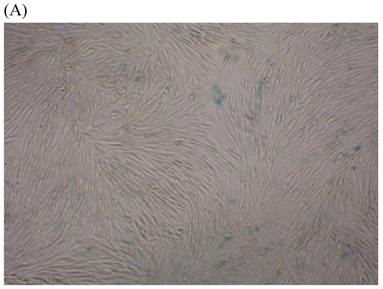
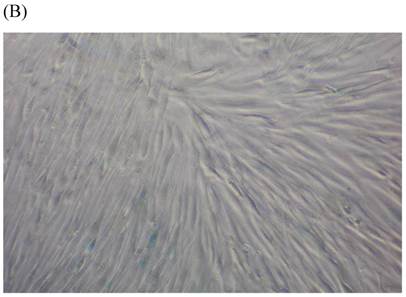
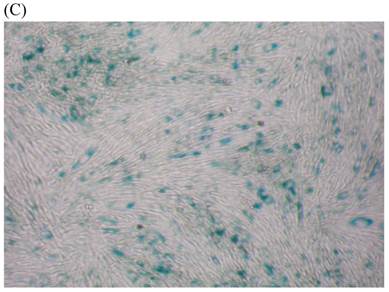
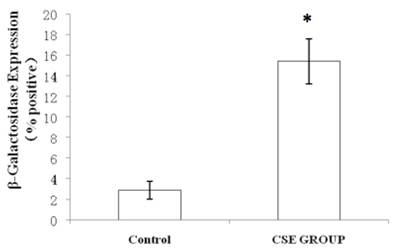
We measured SA β-gal activity in cells that were exposed to CSE for 5 passages, a treatment protocol that we observed to cause abnormally slow growth rates. As shown in Figure 3, the number of cells positive for SA β-gal activity, visualized as green or blue stained cells, was increased in CSE-exposed cells. When these results were quantified, we found that the percentage of SA β-gal positive cells/total cell number in the CSE-exposed group was significantly higher than that of the CSE-free group (Fig. 4).
SA β-gal staining of skin fibroblasts at passage 10 after exposure to 0.5% CSE for the first 5 passages. Representative examples are shown for control cells not exposed to CSE (A, B) and for the CSE-exposure group (C, D) (A and C 40×, B and D 100×).
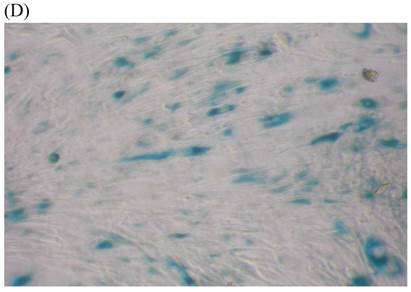
Percentage of SA β-gal stained fibroblasts exposed to 0.5% CSE for 5 passages and fibroblasts not exposed to CSE. Data are expressed as means ± SEM of SAβ gal-positive cells/total cell number for three independent experiments (*P < 0.05 vs. unexposed control group, Student's t-test).
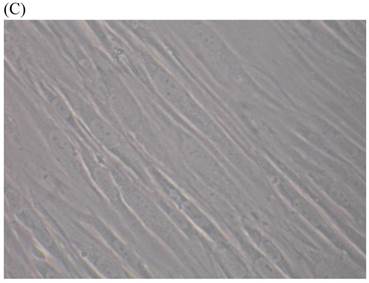
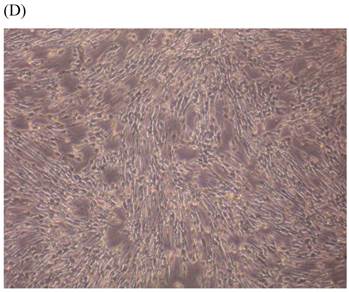
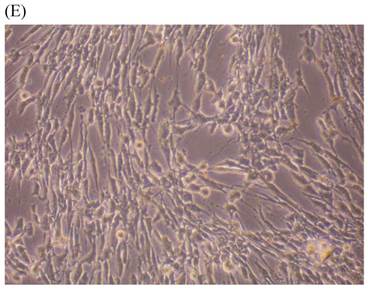
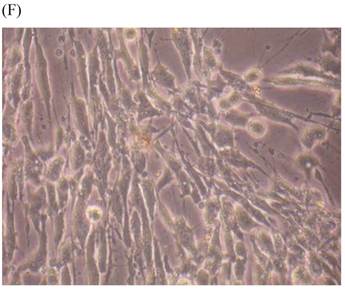
Morphological and ultrastructural changes
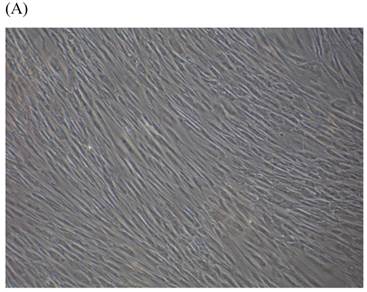
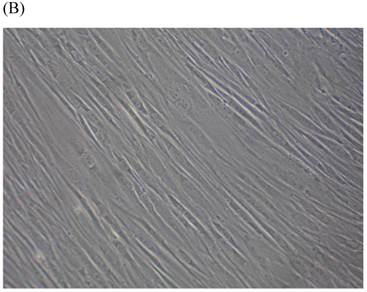
Cells were kept in culture for 24 h with complete 1.25% CSE or without CSE to assay morphological and ultrastructural changes. In the absence of CSE, growing fibroblasts showed a typical fibrous and long spindle morphology, with centered oval-shaped nuclei and radiating, flame-like, or whirlpool migrating shapes (Fig. 5A-C), typical of normal fibroblasts [18]. However, cells exposed to CSE did not have the normal radiating, flame-like, or whirlpool-like migrating shapes. The intracellular connections appeared to be loosened and the cell intervals were widened. The somata were flattened and rounded, with membrane blebbing and blunt nuclei (Fig. 5D-F).
Morphological changes in skin fibroblasts at passage 6 after 1.25% CSE exposure for 24 h. (A-C) Control cells had centrally located, oval shaped nuclei with a radiating and flame-like or whirlpool migrating shape (40×, 100×, 200×). (D-F) The normal radiating, flame-like, and whirlpool migrating shapes were not apparent in the CSE-exposed group. Instead, the exposed cells had flattened and rounded somata with cell blebbing, blunt nuclei, and widened and loosened intracelluar connections (40×, 100×, 200×).
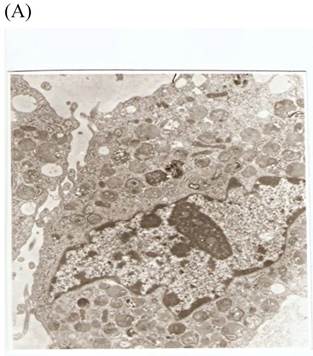
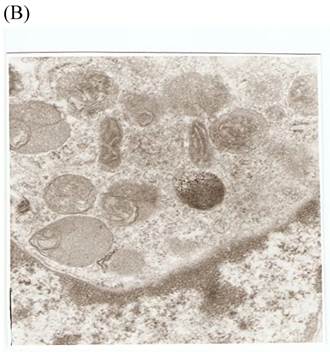
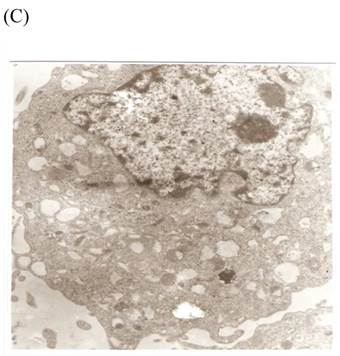
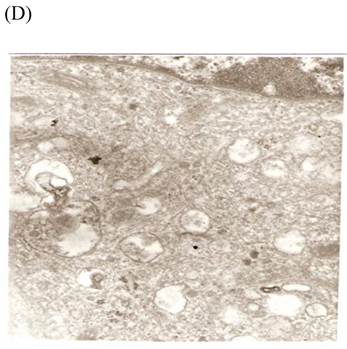
TEM revealed significant abnormalities in fibroblast ultrastructure after CSE exposure, such as microvilli shedding, nucleolus degeneration, mitochondrial deformity, and formation of vesicular structures in the cytoplasm. Before exposure, the fibroblasts had an evenly distributed and intact cytoplasm, with the nucleolus located in the center of the cell and microvilli on the outer cell membrane (Fig. 6A,B control, whole cell structure). After CSE exposure, we observed ultrastructural features demonstrative of cell damage, such as shrunken nucleoli and microvilli shedding, as well as deformed mitochondria and numerous vesicular structures (Fig. 6C,D).
Ulrastructural changes of skin fibroblasts exposed to 1.25% CSE for 24 h. (A, B) The normal ulrastructural features of CES-unexposed skin fibroblasts (5000×, 20000×). (C, D) Ulrastructural changes in CSE-exposed cells characterized by microvilli shedding, nucleolus degeneration, mitochondrial deformity, and the formation of vesicular structures in the cytoplasm.
ROS and antioxidase activity
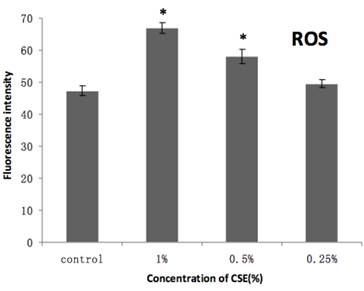
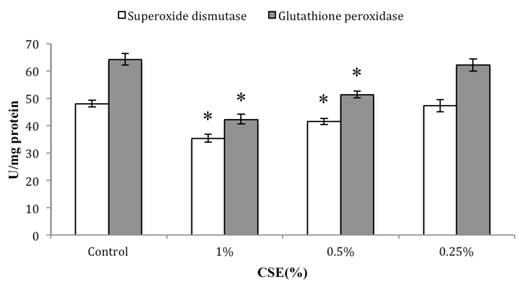
As shown in Figure 7, our H2DCFDA assays of overall oxidative stress demonstrated an increase in ROS in cells exposed to 0.5% or 1% CSE (both with p < 0.05), but not 0.25% CSE. Furthermore, SOD and GSH-Px activities were also decreased significantly in the 0.5% or 1% CSE-exposed groups (p < 0.05), whereas as 0.25% CSE only resulted in a non-significant trend toward a decrease in these values (Fig. 8). Thus, parallel dose-dependent effects of CSE exposure were observed in ROS production, SOD activity, and GSH-Px activity assays.
Effects of CSE on ROS production in mitochondria. CSE dose-dependent increase in ROS-mediated conversion of DCFH to fluorescent DCF in H2DCF-DA-loaded isolated mitochondria incubated with the indicated concentrations of CSE. DCF fluorescence intensity is a relative index of ROS levels. The excitation and emission wave lengths were 499 nm and 525 nm, respectively. Data are means + SEM, n = 4. *p < 0.05 vs. control group, ANOVA.
Dose-dependent effects of CSE (at indicated concentrations) on SOD and GSH-Px activities in skin fibroblasts. Data are expressed as means ± SEM for three independent experiments; n = 4.* p< 0.05 vs. control group.
Discussion
In this study, we analyzed the acute and chronic effects of different concentrations of CSE on the growth and proliferation of primary skin fibroblasts in vitro, and we investigated the mechanisms by which CS induces cellular senescence in cultured primary skin fibroblasts. Our experiments showed that exposure to CSE inhibited proliferation in a dose-dependent and time-dependent manner. Likewise, the growth curves of cell groups exposed to different concentrations of CSE indicated that the growth of fibroblasts was inhibited in a dose-dependent manner. Moreover, even a very low concentration of CSE inhibited growth with chronic exposure. We observed obvious morphological changes indicative of acute cell injury, including loosened intracellular connections, widened cell intervals, flattened and rounded cell bodies, membrane blebbing, and blunt nuclei. These results showed that acute damage from CSE exposure can inhibit the proliferation and growth of primary skin fibroblasts.
Cellular senescence is defined as a complete and irreversible loss of replicative capacity in primary somatic cells [19]. The other major features of a senescent cell are (1) a distinct, flat, and enlarged cell morphology; (2) resistance to apoptosis; (3) altered production of inflammatory and growth mediators; and (4) an increase in SA β-gal activity [20-22]. In our study, prolonged and continuous exposure to CSE for 5 passages resulted in a loss of the characteristic growth of normal fibroblasts. CSE-exposed cells did not enter an exponential growth phase, even though the cell culture conditions were returned to normal after 5 passages. Moreover, cells derived from prolonged CSE-exposure conditions exhibited an increase in SA β-gal activity, an important marker of cell senescence. These data suggest that prolonged exposure to CSE induces cellular senescence. Such senescence may contribute to the clinical manifestations of “smoker's face”, such as periorbital wrinkles, sallow coloration, and degraded connective tissue. Importantly, reduced skin fibroblast proliferation may lead to impaired wound healing [23]. If these effects on skin fibroblasts also occur in other cell types, the pathogenesis of many diseases associated with cigarette smoking could be clarified, at least in part.
Primary fibroblasts are an ideal model for studying aging in vitro. Generally, normal human primary fibroblasts can grow in culture well for 40-50 passages, whereas immortal cell lines and tumor cells grow infinitely and proliferate without the aging characteristics of primary cells [24,25], and primary keratinocytes can only grow for about 7 passages [26], which is not conducive to aging studies, especially prolonged senescent researches. The present results should be interpreted keeping in mind that passage 5-10 cells were studied here, which is in the juvenile stage of growth.
It remains to be determined whether the effects of CSE on cellular senescence are specific to cell type. It is not known which cell types are more sensitive to CSE-induced cellular senescence. The effects of CSE on the cellular proliferation of lung fibroblasts and alveolar epithelial cells have been examined previously in vitro. For example, Tsuji and colleagues showed that exposure to CSE induced cellular senescence in alveolar epithelial cells both in vitro and in animal models [27].
SA β-gal is a hydrolase located in the lysosomes [28,29]. Lysosomal β-gal splits β-linked terminal galactosyl residues from some substrates, such as gangliosides. However, the mechanisms of action and precise role of an increase in SAβ-gal activity in senescence are not yet clear [30]. Although a lack of specificity to senescent cells restricts the utility of SA β-gal in some conditions, such as serum deprivation [31] and confluence [32], SA β-gal is still widely used as a biomarker for cellular senescence [33]. In our study, SA β-gal activity was upregulated after prolonged exposure to CSE that results in abnormal proliferation and growth. Furthermore, the proliferation and growth of SA β-gal positive cells exposed to CSE for prolonged periods of time did not recover the general biological traits of normal fibroblasts of the same passage, even if the cells were returned to and maintained under normal culture conditions for 5 passages following the initial exposure. This result suggests that normal culture conditions could not reverse the aging observed in these cells, an effect which warrants further study. However, it is unclear whether there are additional factors that could counteract the cellular senescence observed after CSE exposure. Further investigation will be needed to clarify this issue.
Karbowski and Youle's findings [34] indicate that mitochondrial cristae play an important role in apoptosis, in addition to their well-known cellular energy supply function. In our study, fibroblast ultrastructural changes, such as microvilli shedding, nucleolus degeneration, mitochondrial deformity, and the formation of vesicular structures in the cytoplasm, were observed after exposure to CSE. Deformed mitochondria and many vesicular structures indicate that CSE-induced damage may occur through a ROS-dependent mitochondrial signaling pathway, since CSE is one of greatest sources of ROS among all environmental factors [35]. All aerobic cells generate ROS (i.e. superoxide, hydrogen peroxide [H2O2], and hydroxyl radicals), both enzymatically and non-enzymatically. The mitochondrial electron transport chain is the principal site of cellular production of ROS. ROS production rises when electron transport activity is reduced, as occurs in pathological situations [36-38]. Our study demonstrated that the mitochondria of CSE-treated cells generated ROS in a significant and dose-dependent manner, which explains the correlation between ROS formation and mitochondrial dysfunction.
As an important anti-oxidative enzyme, SOD can effectively eliminate oxidative damage induced by oxidative stress under normal physiological conditions. Once the intensity of oxidative stress exceeds the threshold of an organism's antioxidant defenses, a series of oxidative damage events can be induced, resulting in pathological changes [39]. GSH-Px catalyzes the reduction of H2O2 to H2O and O2 at the expense of glutathione (GSH)[40]. Reduced SOD and GSH-Px activities weaken the cell's ability to eliminate oxidative molecules in mitochondria. The reduced SOD and GSH-Px activities observed after exposure to CSE, as demonstrated in this study, may lead to an increase in ROS, which could further aggravate mitochondrial dysfunction.
In conclusion, our study demonstrates that, in human skin fibroblasts, exposure to CSE inhibits cell growth and proliferation and results in morphological and ultrastructural changes. Furthermore, cells with prolonged CSE exposure adopted a senescent phenotype with a marked increase in SA β-gal activity. Our findings are consistent with the notion that CSE may induce cellular senescence by augmenting ROS levels. These data may provide clues regarding the skin changes that occur in vivo after CS exposure, and point to a plausible mechanism for the pathogenesis of skin diseases and inhibition of wound healing that occurs as a result of cigarette smoking.
Acknowledgements
This research was supported by the Chinese Medical Association (L'OREAL CHINA SKIN GRANT).
Competing Interests
We declare that we have no conflict of interest, in relation to publication of this article.
References
1. Pattison DI, Davies MJ. Actions of ultraviolet light on cellular structures. EXS. 2006;96:131-157
2. Huang XX, Bernerd F, Halliday GM. Ultraviolet A within sunlight induces mutations in the epidermal basal layer of engineered human skin. Am. J. Pathol. 2009;174:1534-1543
3. Rass K, Reichrath J. UV damage and DNA repair in malignant melanoma and nonmelanoma skin cancer. Adv Exp Med Biol. 2008;624:162-178
4. Freiman A, Bird G, Metelitsa AI. et al. Cutaneous effects of smoking. J Cutan Med Surg. 2004;8(6):415-423
5. Model D. Smokers' faces: who are the smokers? Br. Med. J. 1985;291:1760-62
6. Chung JH, Lee SH, Youn CS. et al. Cutaneous photodamage in Koreans: influence of sex, sun exposure, smoking, and skin color. Arch Dermatol. 2001;137:1043-1051
7. Yin L, Morita A, Tsuji T. Skin aging induced by ultraviolet exposure and tobacco smoking: evidence from epidemiological and molecular studies. Photodermatol Photoimmunol Photomed. 2001;17:178-183
8. Valacchi G, Sticozzi C, Pecorelli A. et al. Cutaneous responses to environmental stressors. Ann N Y Acad Sci. 2012;1271:75-81
9. Gottipati KR, Poulsen H, Starcher B. Passive cigarette smoke exposure inhibits ultraviolet light B-induced skin tumors in SKH-1 hairless mice by blocking the nuclear factor kappa B signaling pathway. Exp Dermatol. 2008;17(9):780-787
10. Makpol S, Jam FA, Anum Y. et al. Modulation of collagen synthesis and its gene expression in human skin fibroblasts by tocotrienol-rich fraction. Arch Med Sci. 2011;7(5):889-895
11. Nyunoya T, Monick MM, Klingelhutz A. et al. Cigarette smoke induces cellular senescence. Am J Respir Cell Mol Biol. 2006;35(6):681-688
12. Meng FJ, Hou ZW, Li Y. et al. The protective effect of picroside II against hypoxia/reoxygenation injury in neonatal rat cardiomyocytes. Pharm Biol. 2012;50(10):1226-1232
13. Wu G, Matsuwaki T, Tanaka Y. et al. Taurine counteracts the suppressive effect of lipopolysaccharide on neurogenesis in the hippocampus of rats. Adv Exp Med Biol. 2013;775:111-119
14. Du YY, Shin S, Wang KR. et al. Effect of temperature on the expression of genes related to the accumulation of chlorophylls and carotenoids in albino tea. J HortSci Biotech. 2009;84:365-369
15. Dimri GP, Lee X, Basile G. et al. A biomarker that identifies senescent human cells in culture and in aging skin in vivo. ProcNatlAcadSci. 1995;92:9363-9367
16. Herbig U, Jobling WA, Chen BP. et al. Telomere shortening triggers senescence of human cells through a pathway involving ATM, p53, and p21(CIP1), but not p16(INK4a). Mol Cell. 2004;14:501-513
17. Wang H, Yang X, Zhang Z. et al. Both calcium and ROS as common signals mediate Na(2)SeO(3)-induced apoptosis in SW480 human colonic carcinoma cells. J Inorg Biochem. 2003;97(2):221-230
18. Sun X, Wang S, Zhang Y. et al. Cell-cycle synchronization of fibroblasts derived from transgenic cloned cattle ear skin: effects of serum starvation, roscovitine and contact inhibition. Zygote. 2008;16:111-116
19. Hayflick L, Moorhead PS. The serial cultivation of human diploid cell strains. Exp Cell Res. 1961;25:585-621
20. Dimri GP, Lee X, Basile G. et al. A biomarker that identifies senescent human cells in culture and in aging skin in vivo. Proc Natl Acad Sci USA. 1995;92:9363-9367
21. M arcotte R, Lacelle C, Wang E. Senescent fibroblasts resist apoptosis by downregulating caspase-3. Mech Ageing Dev. 2004;125:777-783
22. Wang E. Senescent human fibroblasts resist programmed cell death, and failure to suppress bcl2 is involved. Cancer Res. 1995;55:2284-2292
23. Johnen C, Hartmann B, Steffen I. et al. Skin cell isolation and expansion for cell transplantation is limited in patients using tobacco, alcohol, or are exhibiting diabetes mellitus. Burns. 2006;32(2):194-200
24. Cree IA. Principles of cancer cell culture. MethodsMol Biol. 2011;731:1-11
25. Tominaga K, Olgun A, Smith JR. et al. Genetics of cellular senescence. Mech Ageing Dev. 2002;123(8):927-936
26. Fusenig NE, Boukamp P. Multiple stages and genetic alterations in immortalization, malignant transformation, and tumor progression of human skin keratinocytes. Mol Carcinog. 1998;23(3):144-158
27. Nakamura Y, Romberger DJ, Tate L. et al. Cigarette smoke inhibits lung fibroblast proliferation and chemotaxis. Am J Respir Crit Care Med. 1995;151:1497-1503
28. Kurz DJ, Decary S, Hong Y. et al. Senescence-associated (beta)-galactosidase reflects an increase in lysosomal mass during replicative ageing of human endothelial cells. J Cell Sci. 2000;113:3613-3622
29. Lee BY, Han JA, Im JS. et al. Senescence-associated beta-galactosidase is lysosomal beta-galactosidase. Aging Cell. 2006;5:187-195
30. Cristofalo VJ. SA beta Gal staining: biomarker or delusion. Exp Gerontol. 2005;40:836-838
31. Yegorov YE, Akimov SS, Hass R. et al. Endogenous beta-galactosidase activity in continuously nonproliferating cells. Exp Cell Res. 1998;243:207-211
32. Severino J, Allen RG, Balin S. et al. Is beta-galactosidase staining a marker of senescence in vitro and in vivo? Exp Cell Res. 2000;257:162-171
33. Satyanarayana A, Rudolph KL. p16 and ARF: activation of teenage proteins in old age. J Clin Invest. 2004;114:1237-1240
34. Karbowski M, Youle RJ. Dynamics of mitochondrial morphology in healthy cells and during apoptosis. Cell Death Differ. 2003;10:870-880
35. Ortiz A, Grando SA. Smoking and the skin. Int J Dermatol. 2012;51(3):250-262
36. Erfurt C, Roussa E, Thevenod F. Apoptosis by Cd2+ or CdMT in proximal tubule cells: different uptake routes and permissive role of endo/lysosomal CdMT uptake. Am J Physiol Cell Physiol. 2003;285:C1367-1376
37. Li M, Kondo T, Zhao QL. et al. Apoptosis induced by cadmium in human lymphoma U937 cells through Ca2+-calpain and caspase-mitochondria- dependent pathways. J BiolChem. 2000;275:39702-39709
38. Aon MA, Cortassa S, Maack C. et al. Sequential opening of mitochondrial ion channels as a function of glutathione redox thiol status. J Biol Chem. 2007;282:21889-21900
39. Wu JH, Xu C, Shan CY. et al. Antioxidant properties and PC12 cell protective effects of APS-1, a polysaccharide from Aloe vera var. chinensis. Life Sci. 2006;78:622-630
40. Devi SA, Kiran TR. Regional responses in antioxidant system to exercise training and dietary vitamin E in aging rat brain. Neurobiol Aging. 2004;25:501-508
Author contact
![]() Corresponding author: Ge Qian, M.D., Department of Dermatology and Rheumatology, the 2nd Affiliated Hospital of Kunming Medical University, No. 374 Dianmian Road, Kunming, China, 650101. Tel: 86-871-65357115; Fax: 86-871-65352087; Email: drqiangecom or Gaoyun Yang, M.D., Ph.D., Department of Dermatology, Beijing Friendship Hospital, Capital Medical University, No. 95 of Yongan Road, Xicheng District, Beijing, China, 100050.Tel: 86-10-58621988; Fax: 86-10-63139209; Email: gaoyunedu.cn.
Corresponding author: Ge Qian, M.D., Department of Dermatology and Rheumatology, the 2nd Affiliated Hospital of Kunming Medical University, No. 374 Dianmian Road, Kunming, China, 650101. Tel: 86-871-65357115; Fax: 86-871-65352087; Email: drqiangecom or Gaoyun Yang, M.D., Ph.D., Department of Dermatology, Beijing Friendship Hospital, Capital Medical University, No. 95 of Yongan Road, Xicheng District, Beijing, China, 100050.Tel: 86-10-58621988; Fax: 86-10-63139209; Email: gaoyunedu.cn.