Impact Factor ISSN: 1449-2288
- Issue 12; 2026
- Issue 11; 2026
- Issue 10; 2026
- Issue 9; 2026
- Issue 8; 2026
- Volume 22; 2026
- Past Issues
- Advance Articles
- Editorial Board
- Cover Images
- Index & Coverage
- Cover Suggestion
- Special Issues
Introduction
Material and methods
Results
Discussion
Conclusions
Supplemental Material
Acknowledgements
References

 Global reach, higher impact
Int J Biol Sci 2013; 9(9):907-916. doi:10.7150/ijbs.6769 This issue Cite
Research Paper
PBMC Transcription Profiles of Pigs with Divergent Humoral Immune Responses and Lean Growth Performance
Marcel Adler1, Eduard Murani1, Siriluck Ponsuksili2, Klaus Wimmers1 ![]()
1. Leibniz Institute for Farm Animal Biology (FBN), Institute for Genome Biology, Wilhelm-Stahl-Allee 2, 18196 Dummerstorf, Germany
2. Leibniz Institute for Farm Animal Biology (FBN), Research Group Functional Genome Analysis, Dummerstorf, Germany
Received 2013-5-27; Accepted 2013-8-20; Published 2013-9-20
Abstract
Background: The identification of key genes and regulatory networks in the transcriptomic responses of blood cells to antigen stimulation could facilitate the understanding of host defence and disease resistance. Moreover, genetic relationships between immunocompetence and the expression of other phenotypes, such as those of metabolic interest, are debated but incompletely understood in farm animals. Both positive and negative associations between immune responsiveness and performance traits such as weight gain or lean growth have been reported.
We designed an in vivo microarray study of transcriptional changes in porcine peripheral blood mononuclear cells (PBMCs) during the immune response to tetanus toxoid (TT) as a model antigen for combined cellular (Th1) and humoral (Th2) responses. The aim of the study was to investigate the responsiveness of PBMCs against the background of divergent lean growth (LG) performance and anti-TT antibody (AB) titers and to compare lean growth and humoral immune performance phenotypes.
Results: In general, high LG phenotypes had increased cellular immune response transcripts, while low AB phenotypes had increased transcripts for canonical pathways that represented processes of intracellular and second messenger signaling and immune responses. Comparison of lean growth phenotypes in the context of high AB titers revealed higher cellular immune response transcripts in high LG phenotypes. Similar comparisons in the context of low AB titers failed to identify any corresponding pathways. When high and low AB titer phenotypes were differentially compared, low AB phenotypes had higher cellular immune response transcripts on a low LG background and higher cell signaling, growth, and proliferation transcripts on a high LG background.
Conclusions: Divergent phenotypes of both lean growth performance and humoral immune response are affected by significant and functional transcript abundance changes throughout the immune response. The selected high-performance phenotypes demonstrated both high AB titers and increased transcript abundance of cellular immune response genes, which were possibly offset by lower expression of other cellular functions. Further, indications of compensatory effects were observed between cellular and humoral immune responses that became visible only in low-performance phenotypes.
Keywords: leukocyte, porcine, microarray, pathway analysis, tetanus vaccination
Introduction
Animal health and welfare dictates livestock quality and the practice of economically efficient farming; in turn, animal health relies on the prevention of infectious diseases. Therefore, the genetic fundamentals of immunocompetence, or immunogenetics, have become a central research subject in farm animals. Moreover, strong selection for production traits is presumed to have led to impairments concerning behavior, physiology and immune function [1,2]. Hence, comprehensive selection approaches for traits of disease resistance and immunocompetence are proposed [3-6]. However, the relationship between performance traits and immunocompetence, genetic fundamentals, and impacts on breeding are not well understood. Concerning the direct relationship between immune responsiveness and performance, earlier porcine studies report a negative correlation between post-vaccination antibody titers and weight gain [7]. Conversely, other studies report that selection for high immune response associates with enhanced weight gain [8,9]. Clapperton and colleagues [10] show that selection for lean growth associates with higher numbers of several types of lymphocytes and monocytes in Large White pigs.
Transcriptome profiling of peripheral blood mononuclear cells (PBMCs) throughout immune responses is widely used to identify the extent and kinetics of differential gene expression [11-16]. Identification of affected signaling and metabolic pathways and their key genes allows better understanding of host defence and disease resistance. Moreover, the PBMC transcriptome represents not only the primary immune function of leukocytes, but also displays transcriptomic shifts of other tissues and organs due to physiological and environmental alterations [17-19]. Immune-stimulated physiological and metabolic changes in other tissues may also manifest through PBMC gene expression, however, this remains to be confirmed.
Previously, we evaluated a microarray study of in vivo transcriptional changes in porcine PBMCs during the immune response to tetanus toxoid (TT) as a model antigen for a combined immune response [16]. TT vaccines trigger both the cellular (Th1) and humoral (Th2) branches of the immune system [20,21] and represent a non-ubiquitous antigen for which weaning piglets are antigen-naïve [11]. To gain further insight into the relationship between immunocompetence and performance, here we compared the responsiveness of PBMCs to TT vaccination against the background of divergent lean growth performance and anti-TT antibody (AB) titers, respectively. Analyses of affected canonical pathways and downstream effects were compared between divergent phenotypes for lean growth performance and humoral immune response.
Material and methods
Animals, vaccination, sampling and phenotype recording
The Leibniz-Institute for Farm Animal Biology provided animals and permission for this study. Animal care, vaccination, and blood collection were performed according to the guidelines of the German Law of Animal Protection. The experimental protocol was approved by the Animal Care Committee of the Leibniz Institute of Farm Animal Biology and the State Mecklenburg-Vorpommern (Landesamt für Landwirtschaft, Lebensmittelsicherheit und Fischerei; LALLF M-V/TSD/7221.3-2.1-020/09).
The experimental design is outlined in Fig. 1. One week after weaning, 160 five-week-old German Landrace piglets of a commercial herdbook herd were initially vaccinated (day 0) subcutaneously with one dose (1 mL) of tetanus vaccine, composed of TT and aluminium hydroxide as adjuvant (Equilis Tetanus-Vaccine, Intervet, Unterschleißheim, Germany). After two weeks, a booster vaccination was given (day 14). EDTA blood samples were collected directly before the first (day 0) and second vaccination (day 14), as well as two weeks after the booster (day 28). Plasma samples were prepared and stored at -80°C until further analysis. Plasma anti-TT AB titers were determined in triplicate using a commercially available ELISA (RE57441, IBL International, Hamburg, Germany) according to manufacturer's protocol.
Experimental design. Five-week-old piglets were vaccinated twice with TT. Directly before the first (day 0) and the second (day 14) vaccination as well at day 28 blood samples were collected and PBMCs were isolated. Anti-TT antibody titers were quantified by ELISA from day 28 plasma samples. Animals were then performance-tested. Performance data and AB titers were interpreted as a basis for the identification of divergent phenotypes of lean growth performance and humoral immune response, respectively. Finally, expression profiles of divergent phenotypes for lean growth and humoral immune performance were compared.
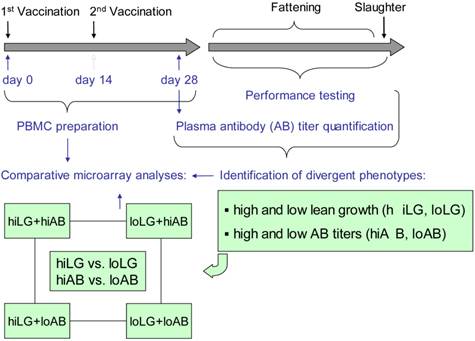
Juvenile animals (average age of 10 weeks) were performance tested and evaluated during fattening and at slaughter (final average weight of 110 kg). Performance test data were subjected to a principal component analysis, which identified the first component (factor 1) explaining 39% of the total variance (Supplementary Table 1). Among the animals there was no evidence for association between performance and immune traits. In fact, coefficients of correlation between performance traits and plasma anti-TT AB titers were low (r ≤ 0.1), thus facilitating the selection of animals that represent divergent groups for both traits. Key parameters (loads) of factor 1 (Table 1) were taken as a basis for the identification of lean growth performance phenotypes. For final phenotype rating, animals from the respective terciles of highest and lowest factor 1 values were categorized as high (hiLG) and low (loLG) lean growth performance, respectively. Accordingly, animals assigned to the first and the third terciles of TT-AB titers were rated as high (hiAB) and low humoral immune response (loAB) phenotypes, respectively.
Key traits used for phenotype rating of high lean growth and low lean growth performance.
| Trait | High lean growth | Low lean growth | High vs. low | ||||
|---|---|---|---|---|---|---|---|
| Mean | SD | Mean | SD | p-value | |||
| Average backfat (cm) | 1.86 | 0.21 | 2.44 | 0.35 | 5.93 x E-07 | ||
| Fat area (cm2) | 14.9 | 2.8 | 21.5 | 3.8 | 3.66E-07 | ||
| Loin eye area (cm2) | 53.0 | 4.4 | 48.0 | 6.2 | 6.34E-03 | ||
| Meat to fat ratio | 3.7 | 0.9 | 2.3 | 0.6 | 1.55E-06 | ||
| Lean mean content (%) | 59.9 | 1.9 | 54.6 | 3.7 | 4.75E-06 | ||
Finally, ten animals each were selected being representatives of one of the two terciles for lean growth performance and of one of the two terciles for antibody response, respectively. The four groups that were set up for subsequent analyses were balanced for sex and litter.
RNA preparation and microarray hybridization
PBMCs were isolated from 4-mL blood samples by centrifugation on a Histopaque density gradient (Sigma-Aldrich, Taufkirchen, Germany). PBMC preparations were stored at -80°C. Total RNA was isolated using Qiazol reagent (Qiagen, Hilden, Germany), then treated with DNase and column-purified using the RNeasy Mini Kit (Qiagen). RNA integrity was visualized by separation on a 1% agarose gel containing ethidium bromide and the concentration was quantified by a NanoDrop ND-1000 spectrometer (PEQLAB, Erlangen, Germany). DNA contamination was assessed by PCR amplification of the porcine GAPDH gene (forward primer: 5'-AAGCAGGGATGATGTTCTGG-3'; reverse primer: 5'-ATGCCTCCTGTACCACCAAC-3'). All RNA was stored at -80°C.
Each RNA sample was transcribed to DNA using the Ambion WT Expression Kit (Ambion, Austin, TX, USA). DNA preparations were fragmented and labelled with the WT Terminal Labeling Kit (Affymetrix, Santa Clara, CA, USA). Labelled DNA was hybridized on snowball arrays, a recently developed and annotated whole genome array [22,23]. Further information about this platform is also available in the 'ArrayExpress' database (accession number A-AFFY-189, http://www.ebi.ac.uk/arrayexpress/arrays/A-AFFY-189/). Following staining and washing, arrays were scanned and raw data generated using Affymetrix GCOS 1.1.1 software. Microarray data is MIAME-compliant and was deposited in the database of the National Center for Biotechnology Information Gene Expression Omnibus http://www.ncbi.nlm.nih.gov/geo [GEO: GSE47845].
Microarray data processing and functional analyses
Quality-controlled raw data were normalized by the PLIER algorithm using Affymetrix Expression Console 1.1 software (Affymetrix) and filtered by standard deviation (s ≤ 0.2). According to the experimental design aiming at showing contrasts of the PBMC transcription due to antibody responsiveness and lean growth performance of the test subjects the factor of immune response group (`IR´) and lean growth performance group (`P´) were used as fixed effects in the analysis of variance. Since the genetic background and the age at sampling and expression profiling affect the gene activity `sire´ (`S´) and `time´ (`T´) were also fitted as fixed effects in a mixed model. So essentially, relative transcript abundance changes were determined using these fixed effects and the interactions between `IR´ and `P´ and between `T´, `IR´, and `P´ [v = μ + S + T + IR + P + (IR x P) + (T x IR x P) + ε]. The mixed model was combined with a repeated statement for the time component in order to take into account correlations among measurements made on the same subject by specifying heterogeneous covariance structure.
Thus sampling time points were weighted equally while comparing lean growth and humoral immune response phenotypes. Mixed model analyses were performed with JMP Genomics 5.0 software (SAS Institute, Cary, NC, USA).
Annotation data for the snowball arrays were obtained from the developers [22,23]. Transcripts showing different abundance at nominal p-values < 0.5 were assigned to annotated genes and bioinformatically analysed with Ingenuity Pathways Analysis (IPA) Software [24]. At the levels of IPA's functional analyses for canonical pathways and biofunctions a correction for multiple testing was applied by use of IPA's B-H p-value correction procedure. Cut-off criteria were set to corrected p-values < 0.05 for canonical pathways and for biofunctions, respectively, and absolute values of activation z-scores > 2.0 for biofunctions.
Results
Antibody titer and performance characterization
In order to analyse different transcript abundance of PBMC due to immune responsiveness and lean growth performance five-week-old German Landrace piglets were initially vaccinated (day 0) with TT, and a booster vaccination was given on day 14. Animals were then performance-tested until a final average weight of 110 kg at slaughter. Animals of the tails of the distribution for the trait AB titer against TT and lean growth performance were selected. Plasma anti-TT AB titers, determined by enzyme-linked immunosorbent assay (ELISA) at two weeks after booster vaccination, ranged from <0.1 IU/mL to >1.0 IU/mL (mean = 0.33 IU/mL; standard deviation = 0.23 IU/mL). AB titers were interpreted as a basis for the identification of divergent phenotypes of high humoral immune response (hiAB) and low humoral immune response (loAB) and differed significantly among both groups (hiAB: mean = 0.57 IU/mL; standard deviation = 0.13 IU/mL; loAB: mean = 0.23 IU/mL; standard deviation = 0.04 IU/mL; p < 0.001). Lean growth performance phenotypes were obtained by the first component of a principal component analysis of extensive performance data. Highly significant differences for key parameters of this first component were used for phenotype rating of high lean growth (hiLG) and low lean growth (loLG) performance (Table 1).
Differentially-expressed genes and assigned functions for divergent lean growth performance phenotypes
Using Ingenuity Pathways Analysis (IPA) software [24], genes with significantly different transcript abundances (hereafter referred to as DE-genes) were assigned to affected canonical pathways and altered downstream effects (hereafter referred to as biofunctions).
Comparison of hiLG and loLG revealed 574 DE-genes (Table 2) that were assigned to pathways predominated by the cellular immune response (Table 4a). The most significant pathways, including T-cell receptor, PKCθ, and CD28 signaling, are responsible for co-stimulation during lymphocyte activation and showed higher transcript abundances in the hiLG group. Functional analysis predicted decreased organismal death and increased development, differentiation, and homeostasis of lymphocytes for the hiLG phenotype (Table 5a).
Numbers of differentially-expressed (DE-) genes from comparison of lean growth performance and antibody titers
| Main phenotype comparisons | ||
|---|---|---|
| Lean growth performance: high vs. low | Antibody titer: high vs. low | |
| Number of DE-genes | 574 | 522 |
| Transcript Abundance > | 366 | 133 |
| Transcript Abundance < | 208 | 389 |
Top 10 canonical pathways for lean growth performance (a) and antibody titer (b) phenotype comparisons
| Canonical Pathway | Pathway category | -log p-value | Genes involved | Transcript abundance | |
|---|---|---|---|---|---|
| > | < | ||||
| (a) Lean growth performance: high vs. low | |||||
| T Cell Receptor Signaling | 1 | 3.84 | 13 | 12 | 1 |
| PKCθ Signaling in T Lymphocytes | 1 | 3.84 | 14 | 11 | 3 |
| CD28 Signaling in T Helper Cells | 1 | 3.84 | 14 | 10 | 4 |
| CTLA4 Signaling in Cytotoxic T Lymphocytes | 1 | 3.75 | 12 | 10 | 2 |
| Role of NFAT in Regulation of the IR | 1,2,3 | 3.42 | 16 | 11 | 5 |
| Phospholipase C Signaling | 3 | 3.42 | 19 | 13 | 6 |
| iCOS-iCOSL Signaling in T Helper Cells | 1 | 3.16 | 12 | 8 | 4 |
| Protein Kinase A Signaling | 3 | 3.16 | 25 | 14 | 11 |
| Calcium-induced T Lymphocyte Apoptosis | 4,1 | 2.99 | 9 | 7 | 2 |
| CCR5 Signaling in Macrophages | 1,5 | 2.63 | 9 | 7 | 2 |
| (b) Antibody titer: high vs. low | |||||
| Integrin Signaling | 3,6,7 | 8.08 | 24 | 1 | 23 |
| Phospholipase C Signaling | 3 | 4.86 | 21 | 4 | 17 |
| Clathrin-mediated Endocytosis Signaling | 1,8,9 | 4.70 | 18 | 1 | 17 |
| IL-8 Signaling | 1,5 | 4.70 | 18 | 3 | 15 |
| Thrombin Signaling | 10 | 4.56 | 18 | 2 | 16 |
| Role of NFAT in Regulation of the IR | 1,2,3 | 4.56 | 17 | 3 | 14 |
| PTEN Signaling | 4 | 4.56 | 14 | 0 | 14 |
| P2Y Purigenic Receptor Signaling Pathway | 10 | 4.26 | 14 | 2 | 12 |
| Ephrin Receptor Signaling | 9 | 4.01 | 16 | 2 | 14 |
| CXCR4 Signaling | 1,5 | 3.94 | 15 | 1 | 14 |
Pathway categories:
1 Cellular immune response; 2 Humoral immune response;
3 Intracellular and second messenger signalling; 4 Apoptosis;
5 Cytokine signalling; 6 Cellular growth, proliferation and development;
7 Cell cycle regulation; 8 Pathogen-influenced signaling;
9 Organismal growth and development; 10 Cardiovascular signaling;
Abbreviation: IR Immune response
Top 15 biofunctions for lean growth performance (a) and antibody titer (b) phenotype comparisons
| Activation | # Genes | Predicted | ||
|---|---|---|---|---|
| Annotated functions | z-score | -log p-value | involved | activation state |
| (a) Lean growth performance: high vs. low | ||||
| organismal death | -4.39 | 2.90 | 77 | < |
| development of leukocytes | 3.51 | 4.29 | 39 | > |
| differentiation of lymphocytes | 3.38 | 6.46 | 40 | > |
| cellular homeostasis | 3.35 | 5.15 | 74 | > |
| lymphocyte homeostasis | 3.31 | 4.14 | 36 | > |
| T cell development | 3.28 | 4.04 | 34 | > |
| development of blood cells | 3.25 | 3.94 | 41 | > |
| development of lymphocytes | 3.23 | 4.18 | 37 | > |
| T cell homeostasis | 3.18 | 4.19 | 35 | > |
| development of cardiovascular system | 3.04 | 3.79 | 56 | > |
| differentiation of mononuclear leucocytes | 2.97 | 6.46 | 42 | > |
| development of blood vessel | 2.94 | 2.59 | 42 | > |
| differentiation of B lymphocytes | 2.78 | 3.48 | 19 | > |
| differentiation of leucocytes | 2.70 | 6.25 | 47 | > |
| quantity of helper T lymphocytes | 2.59 | 2.54 | 15 | > |
| (b) Antibody titer: high vs. low | ||||
| adhesion of blood cells | -4.01 | 1.75 | 22 | < |
| aggregation of cells | -3.92 | 3.68 | 24 | < |
| aggregation of blood cells | -3.58 | 3.97 | 21 | < |
| aggregation of blood platelets | -3.32 | 4.60 | 142 | < |
| proliferation of cells | -2.99 | 5.52 | 83 | < |
| differentiation of cells | -2.96 | 3.03 | 25 | < |
| cell transformation | -2.79 | 1.89 | 34 | < |
| differentiation of blood cells | -2.78 | 1.49 | 43 | < |
| activation of cells | -2.61 | 1.64 | 98 | < |
| cell movement | -2.48 | 7.32 | 23 | < |
| hemostasis | -2.47 | 5.77 | 39 | < |
| activation of blood cells | -2.38 | 2.37 | 89 | < |
| migration of cells | -2.37 | 6.50 | 34 | < |
| proliferation of T lymphocytes | -2.36 | 2.52 | 55 | < |
| cellular homeostasis | -2.31 | 1.56 | 35 | < |
DE-genes and assigned functions for divergent humoral immune response phenotypes
Comparison of hiAB and loAB revealed 522 DE-genes (Table 2). The loAB group showed higher transcript abundances for canonical pathways (Table 4b) that represented processes of intracellular and second messenger signaling (integrin signaling, phospholipase C signaling) and immune responses (clathrin-mediated endocytosis signaling, IL-8 signaling). Functional analyses predicted decreased cell adhesion, aggregation, proliferation, and differentiation in hiAB phenotypes (Table 5b).
Differentiated comparisons between divergent lean growth performance and humoral immune response phenotypes
The identification of hiLG, loLG, hiAB, and loAB phenotypes enabled differentiated comparisons between hiLG and loLG against backgrounds of hiAB and loAB, respectively, and vice versa: hiLG+hiAB vs. loLG+hiAB; hiLG+loAB vs. loLG+loAB; hiLG+hiAB vs. hiLG+loAB; and loLG+hiAB vs. loLG+loAB (Fig. 1). Each comparison revealed more than 400 DE-genes (Table 3).
Numbers of DE-genes from differentiated comparisons between lean growth performance and antibody titers
| Differentiated comparisons for high (hi) and low (lo) lean growth (LG) and antibody (AB) phenotypes | ||||
|---|---|---|---|---|
| hiLG+hiAB vs. loLG+hiAB | hiLG+hiAB vs. hiLG+loAB | loLG+hiAB vs. loLG+loAB | hiLG+loAB vs. loLG+loAB | |
| Number of DE-genes | 432 | 407 | 489 | 441 |
| Transcript Abundance > | 311 | 111 | 129 | 293 |
| Transcript Abundance < | 121 | 296 | 360 | 148 |
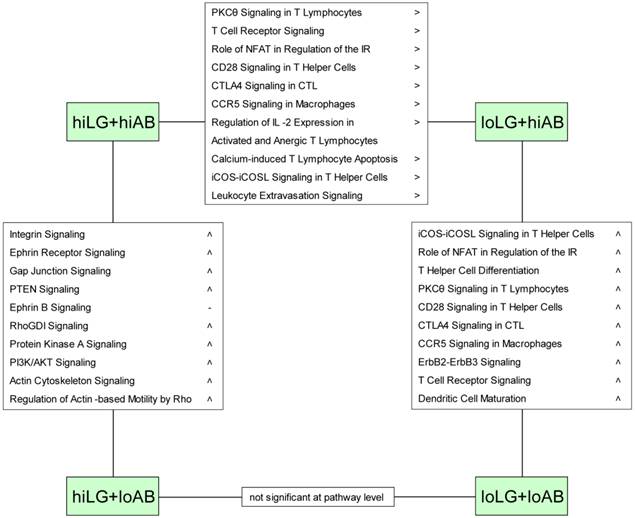
Similar to the comparison between hiLG and loLG, the hiLG+hiAB vs. loLG+hiAB comparison revealed higher transcript abundances in the hiLG+hiAB phenotype that affected pathways assigned exclusively to cellular immune responses (Fig. 2). Correspondingly, downstream effects analysis predicted activation of lymphocyte development, differentiation, and homeostasis and decreased leukocyte apoptosis in hiLG+hiAB (Fig. 3). Although the hiLG+loAB vs. loLG+loAB comparison represented 441 DE-genes, no corresponding pathway or biofunction was identified.
Affected canonical pathways revealed by differentiated comparisons of four phenotypic groups. Symbols > and < refer to overall transcript abundance and were set if more than 75 % of involved DE-genes showed positive or negative fold change, respectively.
Altered biofunctions revealed by differentiated comparison between four phenotypic groups. Symbols > and < refer to IPA prediction of increased (>) or decreased (<) activation state of the respective biofunction.
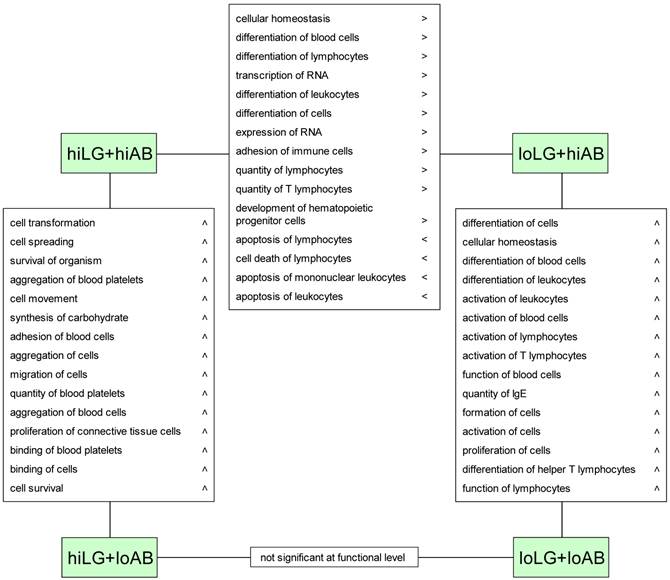
When high and low AB titer phenotypes were differentially compared, higher trancript abundances were found for loLG+loAB compared to the loLG+hiAB phenotype. These DE-genes were assigned to canonical pathways of the cellular immune response (Fig. 2) and to an increase of biofunctions such as activation and differentiation of lymphocytes, particularly T lymphocytes, and differentiation of helper T cells (Fig. 3).
The comparison of divergent AB titer phenotypes with high lean growth, hiLG+hiAB vs. hiLG+loAB, revealed pathways with cell signaling, growth, and proliferation functions, rather than distinct immune responses (Fig. 2). Transcript abundances were higher in the hiLG+loAB group and predicted activation of cell transformation and spreading, survival, aggregation, adhesion, and binding (Fig. 3).
Discussion
In animal farming, the relationship between performance traits and immunocompetence, its genetic foundation, and the consequences for animal breeding are debated but poorly understood. Previous work addressed the physiological costs of immune responses leading to disease resistance [25]. In addition, there are numerous reports about how certain factors like pathogen infection, poor hygiene conditions or physical and psychological stressors led to a metabolic impairment and thus to lower performance [25]. The resource allocation theory postulates the existence of metabolic constraints between immune function and growth performance [26,27]. However, immune activation and resulting metabolic impairments should be differentiated from genetically determined differences in immune responsiveness and performance potential in terms of weight gain, lean growth, and other production traits. Knap and Bishop [28] review evidence of genetic variation and discuss several breeding approaches to improve the genetic potential for immunocompetence.
Porcine selection for high immune response was found associated with enhanced weight gain [8,9], whereas selection for lean growth was observed associated with higher numbers of several leukocyte subtypes [10]. In addition, Galina-Pantoja et al. [29] provide evidence for the association of several leukocyte subsets with growth traits. However, inverse correlations between antibody titers after vaccination and weight gain [7] and between PBMC subsets and daily weight gain have also been reported [30,31]. These results suggest an incomplete understanding of the correlation between immunocompetence and performance traits.
In pigs undifferentiated by phenotype, we observed a broad transcriptomic response to TT that comprises changes to the abundance of immune response, cellular growth, proliferation, development, intracellular messenger, and second messenger signaling transcripts [16]; therefore, we asked whether phenotype differentiation would affect these responses. The results presented here reveal differentially-modulated transcriptomic responses of immune pathways and broad processes of cellular reorganization with respect to the phenotypic differences in lean growth performance and antibody response.
hiLG transcripts were increased for canonical pathways related to cellular immune response and biofunctions predicted to increase lymphocyte differentiation, development, and homeostasis, but to decrease leukocyte apoptosis, compared to loLG transcripts. These findings are concurrent with the more differentiated comparison of hiLG+hiAB vs. loLG+hiAB.
Although the comparison of hiLG+loAB vs. loLG+loAB revealed 441 DE-genes, similar to the other differentiated comparisons, no significant pathway or affected biofunction was identified. Hence, the background of low humoral immune responsiveness provided no clear functional differences for divergent lean growth.
Among the most significant canonical pathways, several were related to T-cell activities. For example, T cell receptor (TCR) signaling is initiated after major histocompatibility complex-associated antigens are recognized and bound by the TCR-CD3 complex. Transcript abundances of CD3 and the co-stimulatory receptor CD8 increased in hiLG and hiLG+hiAB compared to loLG groups. In TCR signaling, antigen binding to TCR leads to an initial sequence of tyrosinase activity followed by further downstream signaling, which leads to transcriptional activation of several genes including IL-2, a key-cytokine of Th1 response. Moreover, we found elevated transcript abundance of c-FOS encoding a component of the transcription factor AP1 that activates cytokine and other immune effector genes. Higher abundance of CD8 transcripts in hiLG may indicate higher numbers of cytotoxic T lymphocytes (CTLs) or a higher rate of differentiation into CTLs. In addition to TCR signaling, the following pathways are closely related: PKCθ signaling in T lymphocytes; CD28 signaling in T helper cells; CTLA4 signaling in cytotoxic T lymphocytes; and NFAT regulation of the immune response. These signal transduction mechanisms are initiated by antigen recognition by TCR-CD3 and co-stimulation of CD28 to activate and differentiate T cells, which involve cell survival, proliferation, and the production of IL-2. The enrichment of these pathway genes indicates the predominance of cell-mediated immune responses. Thus, the high lean growth phenotype in our study was characterized by several favourable performance traits and a transcriptomic response indicative for high cellular immunocompetence, partly combined with a strong humoral defense.
hiAB and loAB comparison revealed the hiAB group had a lower abundance of transcripts related to canonical cellular biology pathways (integrin and phospholipase C signaling) and immune responses (clathrin-mediated endocytosis and IL-8 signaling). Functional analysis demonstrated cell adhesion, aggregation, proliferation, and differentiation among the predominant processes. However, depending on backgrounds of hiLG and loLG, respectively, the differentiated comparisons show differently affected functions (Fig. 3). This indicates that affected pathways with primary immune functions did not necessarily reflect TT AB titers. Similar observations that immune assays may not reflect immunocompetence were reported [32]. However, it should be taken into account that the lymphocyte fraction of peripheral blood is composed of a smaller fraction of B lymphocytes compared to T cells, which may impair to some extent the detection of shifted transcript abundances in B cells. The comparison of loLG+hiAB vs. loLG+loAB presented pathways responsible for cell-mediated immune responses and biofunctions predominated by differentiation and activation of lymphocytes. Since loAB phenotypes showed exclusively higher transcript abundances for cellular immune responses, compensatory effects between humoral and cellular immune responses visible only for low performance phenotypes may be present.
Against the background of hiLG (hiLG+hiAB vs. hiLG+loAB), no transcript abundance alterations were found for primary immune pathways. However, cellular and organismal growth, proliferation and development (integrin, ephrin receptor, and gap junction signaling), and intracellular and second messenger signaling (integrin, rhoGDI signaling) pathways were affected. Decreased transcript abundances in hiLG+hiAB compared to hiLG+loAB had predicted biofunctions in cell transformation, aggregation, binding, and survival. Given that hiLG+hiAB phenotypes possessed both high AB titers and strong transcriptional immune responses, the increased T-cell activation transcripts were possibly offset by lower expression of several cell signaling and reorganization functions. It remains to be examined whether lower expression of other functions impair physiological or metabolic functions.
AB divergent phenotype comparisons revealed integrin signaling as the most significant pathway. Integrin DE-genes ITGA2, ITGA2B, and ITGB3 increased 1.2- to 1.4-fold in loAB compared to hiAB; transcripts increased 1.4- to 1.6-fold in hiLG+loAB compared to hiLG+hiAB (Supplementary Table 2). Integrins are transmembrane molecules that enable attachment to and communication with other cells or the extracellular matrix. Although the IPA database does not attribute integrin signaling to the immune system, integrins may play a crucial role in the leukocyte immune response. Hogg and colleagues [33] showed that integrin-mediated leukocyte migration through the body and into lymph nodes is essential for immune responses. Moreover, integrins are involved in the interaction between T cells and antigen-presenting cells by both synaptic adhesion and direct signaling [34].
Balanced immunocompetence without polarity of either cellular-mediated (Th1) or humoral (Th2) immune responses is a proposed selection goal to avoid resistance to specific infections/diseases or increased susceptibility to others [3]. Thus, a balanced Th1/Th2 phenotype, rather than extreme Th1 or Th2 responders, is desired for general disease resistance [35]. Because cytokine production and Th1/Th2 ratios are highly variable within a pig population [35-37], one can assume that the prevalence of either Th1 or Th2 responses is genetically fixed. Our observations of considerable transcriptomic differences between humoral and cellular-mediated immune responses corroborate these results. One might speculate that loAB individuals activate a higher cellular immune response to compensate for lower antibody-mediated immunity. Immune tolerance is an alternative host strategy to deal with pathogens [38] that is discussed for possible integration in selective pig breeding [39-41].
Recent research reported further insight into the relationship between obesity and adipose tissue inflammation [42]. Increased numbers of macrophages and T cells and their production of pro-inflammatory cytokines cause obesity-associated insulin resistance in several tissue types [43,44]. Association of adiposity with metabolic impairments and a low-grade inflammatory state was also shown in pig [45]. Assuming a higher susceptibility for insulin resistance in obese animals from our experimental population, the immune status of low performance animals may differ from that of lean growth animals. Further, if adipose tissue can contribute to disease resistance or host tolerance through the systemic immune system, the relationship between fat and immunocompetence becomes more complex. These factors will have to be considered for the integration of genetics and phenotype expression into breeding programs.
Conclusions
We observed significant functional transcript abundance changes during the immune response to TT for both divergent lean growth performance and humoral immune responses. High lean growth showed activated cellular immune responses related to lymphocyte differentiation, development, and homeostasis compared to low lean growth phenotypes. Increased transcript abundances for immune activation were possibly offset by decreased expression of several cell signaling and reorganization functions; however, numerous favourable performance traits suggest a lack of physiological or metabolic impairment. The majority of affected primary immune pathways did not reflect AB titer differences. Particularly, in low lean growth performers low humoral immune responders revealed higher transcriptional activation of cellular immune responses than low AB responders, suggesting compensatory effects between humoral and cellular immune responses. However, the group of the most desired animals with high lean growth and high humoral immune response (hiLG+hiAB) revealed also higher transcriptional activation of cellular immune responses compared to the low performing group. Though the above-mentioned compensatory effects may exist, this finding demonstrates the occurrence of individuals with superior performance combined with high Th1 and Th2 immune responsiveness.
Supplemental Material
Supplementary Table 1Loads of factor 1.
DE-genes of all comparisons.
Acknowledgements
This study was part of the GeneDialog project (FUGATO plus, FKZ 0315130 A), which was funded by the German Federal Ministry of Education and Research.
Competing Interests
The authors have declared that no competing interest exists.
References
1. Rauw WM, Kanis E, Noordhuizen-Stassen EN. et al. Undesirable side effects of selection for high production efficiency in farm animals: a review. Livestock Production Science. 1998;56:15-33
2. Prunier A, Heinonen M, Quesnel H. High physiological demands in intensively raised pigs: impact on health and welfare. Animal. 2010;4:886-98
3. Wilkie B, Mallard B. Selection for high immune response: an alternative approach to animal health maintenance? Vet Immunol Immunopathol. 1999;72:231-5
4. Stear MJ, Bishop SC, Mallard BA. et al. The sustainability, feasibility and desirability of breeding livestock for disease resistance. Res Vet Sci. 2001;71:1-7
5. Lewis CR, Ait-Ali T, Clapperton M. et al. Genetic perspectives on host responses to porcine reproductive and respiratory syndrome (PRRS). Viral Immunol. 2007;20:343-58
6. Reiner G. Investigations on genetic disease resistance in swine - A contribution to the reduction of pain, suffering and damage in farm animals. Appl Anim Behav. 2009;118:217-21
7. Meeker DL, Rothschild MF, Christian LL. et al. Genetic control of immune response to pseudorabies and atrophic rhinitis vaccines: I. Heterosis, general combining ability and relationship to growth and backfat. J Anim Sci. 1987;64:407-13
8. Mallard BA, Wilkie BN, Kennedy BW. et al. Immune responsiveness in swine: eight generations of selection for high and low immune response in Yorkshire pigs. Proceedings of the 6th World Congress on Genetics Applied to Livestock Production, Armidale, Australia. 1998:257-64
9. Wilkie BN, Mallard BA. Multi-trait selection for immune response; A possible alternative strategy for enhanced livestock health and productivity. Wiseman J, editor. Progress in pig science.Nottingham: Nottingham University Press. 1998:29-38
10. Clapperton M, Bishop S, Glass E. Selection for lean growth and food intake leads to correlated changes in innate immune traits in Large White pigs. Animal Science. 2006;82:867-76
11. Ponsuksili S, Murani E, Wimmers K. Porcine genome-wide gene expression in response to tetanus toxoid vaccine. Dev Biol (Basel). 2008;132:185-95
12. Ojha S, Kostrzynska M. Examination of animal and zoonotic pathogens using microarrays. Vet Res. 2008;39:4
13. Gao Y, Flori L, Lecardonnel J. et al. Transcriptome analysis of porcine PBMCs after in vitro stimulation by LPS or PMA/ionomycin using an expression array targeting the pig immune response. BMC Genomics. 2010;11:292
14. Huang TH, Uthe JJ, Bearson SM. et al. Distinct peripheral blood RNA responses to Salmonella in pigs differing in Salmonella shedding levels: intersection of IFNG, TLR and miRNA pathways. PLoS One. 2011;6:e28768
15. Wilkinson JM, Dyck MK, Dixon WT. et al. Transcriptomic Analysis Identifies Candidate Genes and Functional Networks Controlling the Response of Porcine Peripheral Blood Mononuclear Cells to Mitogenic Stimulation. J Anim Sci. 2012
16. Adler M, Murani E, Brunner R. et al. Transcriptomic Response of Porcine PBMCs to Vaccination with Tetanus Toxoid as a Model Antigen. PLoS One. 2013;8:e58306
17. Liew CC, Ma J, Tang HC. et al. The peripheral blood transcriptome dynamically reflects system wide biology: a potential diagnostic tool. J Lab Clin Med. 2006;147:126-32
18. Kohane IS, Valtchinov VI. Quantifying the white blood cell transcriptome as an accessible window to the multiorgan transcriptome. Bioinformatics. 2012;28:538-45
19. Möller-Levet CS, Archer SN, Bucca G. et al. Effects of insufficient sleep on circadian rhythmicity and expression amplitude of the human blood transcriptome. Proc Natl Acad Sci U S A. 2013
20. elGhazali GE, Paulie S, Andersson G. et al. Number of interleukin-4- and interferon-gamma-secreting human T cells reactive with tetanus toxoid and the mycobacterial antigen PPD or phytohemagglutinin: distinct response profiles depending on the type of antigen used for activation. Eur J Immunol. 1993;23:2740-5
21. Robinson K, Chamberlain LM, Lopez MC. et al. Mucosal and cellular immune responses elicited by recombinant Lactococcus lactis strains expressing tetanus toxin fragment C. Infect Immun. 2004;72:2753-61
22. Freeman TC, Ivens A, Baillie JK. et al. A gene expression atlas of the domestic pig. BMC Biol. 2012;10:90
23. Fairbairn L, Kapetanovic R, Beraldi D. et al. Comparative analysis of monocyte subsets in the pig. J Immunol. 2013;190:6389-96
24. ingenuity pathway analysis (IPA). http://www.ingenuity.com
25. Colditz IG. Effects of the immune system on metabolism: implications for production and disease resistance in livestock. Livestock Production Science. 2002;75:257-68
26. Rauw WM. Resource Allocation Theory Applied to Farm Animal Production. Wallingford, UK: CABI Publishing. 2009
27. Rauw WM. Immune response from a resource allocation perspective. Front Genet. 2012;3:267
28. Knap PW, Bishop SC. Relationships between genetic change and infectious disease in domestic livestock. Penicuik, UK: BSAS occasional publication 27. 2000:65-80
29. Galina-Pantoja L, Mellencamp MA, Bastiaansen J. et al. Relationship between immune cell phenotypes and pig growth in a commercial farm. Anim Biotechnol. 2006;17:81-98
30. Clapperton M, Glass EJ, Bishop SC. Pig peripheral blood mononuclear leucocyte subsets are heritable and genetically correlated with performance. Animal. 2008;2:1575-84
31. Clapperton M, Diack AB, Matika O. et al. Traits associated with innate and adaptive immunity in pigs: heritability and associations with performance under different health status conditions. Genet Sel Evol. 2009;41:54
32. Adamo SA. How should behavioural ecologists interpret measurements of immunity? Animal Behaviour. 2004;68:1443-9
33. Hogg N, Laschinger M, Giles K. et al. T-cell integrins: more than just sticking points. J Cell Sci. 2003;116:4695-705
34. Evans R, Patzak I, Svensson L. et al. Integrins in immunity. J Cell Sci. 2009;122:215-25
35. de Groot J, Kruijt L, Scholten JW. et al. Age, gender and litter-related variation in T-lymphocyte cytokine production in young pigs. Immunology. 2005;115:495-505
36. Edfors-Lilja I, Bergstrom M, Gustafsson U. et al. Genetic variation in Con A-induced production of interleukin 2 by porcine peripheral blood mononuclear cells. Vet Immunol Immunopathol. 1991;27:351-63
37. Edfors-Lilja I, Wattrang E, Marklund L. et al. Mapping quantitative trait loci for immune capacity in the pig. J Immunol. 1998;161:829-35
38. Råberg L, Sim D, Read AF. Disentangling genetic variation for resistance and tolerance to infectious diseases in animals. Science. 2007;318:812-4
39. Guy SZ, Thomson PC, Hermesch S. Selection of pigs for improved coping with health and environmental challenges: breeding for resistance or tolerance? Front Genet. 2012;3:281
40. Doeschl-Wilson AB, Kyriazakis I. Should we aim for genetic improvement in host resistance or tolerance to infectious pathogens? Front Genet. 2012;3:272
41. Doeschl-Wilson AB, Villanueva B, Kyriazakis I. The first step toward genetic selection for host tolerance to infectious pathogens: obtaining the tolerance phenotype through group estimates. Front Genet. 2012;3:265
42. Deng T, Lyon CJ, Minze LJ. et al. Class II major histocompatibility complex plays an essential role in obesity-induced adipose inflammation. Cell Metab. 2013;17:411-22
43. Olefsky JM, Glass CK. Macrophages, inflammation, and insulin resistance. Annu Rev Physiol. 2010;72:219-46
44. Glass CK, Olefsky JM. Inflammation and lipid signaling in the etiology of insulin resistance. Cell Metab. 2012;15:635-45
45. Vincent A, Louveau I, Gondret F. et al. Mitochondrial function, fatty acid metabolism, and immune system are relevant features of pig adipose tissue development. Physiol Genomics. 2012;44:1116-24
Author contact
![]() Corresponding author: e-mail: wimmersde
Corresponding author: e-mail: wimmersde