Impact Factor ISSN: 1449-2288
- Issue 9; 2026
- Issue 8; 2026
- Issue 7; 2026
- Issue 6; 2026
- Issue 5; 2026
- Volume 22; 2026
- Past Issues
- Advance Articles
- Editorial Board
- Cover Images
- Index & Coverage
- Cover Suggestion
- Special Issues
Introduction
Material and Methods
Results
Discussion
Supplementary Material
Acknowledgements
References

 Global reach, higher impact
Int J Biol Sci 2014; 10(3):327-337. doi:10.7150/ijbs.8134 This issue Cite
Research Paper
Discovery of Candidate Genes for Muscle Traits Based on GWAS Supported by eQTL-analysis
Siriluck Ponsuksili1, Eduard Murani2, Nares Trakooljul2, Manfred Schwerin1, Klaus Wimmers2 ![]()
1. Research Group 'Functional Genome Analyses', Leibniz Institute for Farm Animal Biology (FBN), Wilhelm-Stahl-Allee 2, D-18196 Dummerstorf, Germany;
2. Research Unit 'Molecular Biology', Leibniz Institute for Farm Animal Biology (FBN), Wilhelm-Stahl-Allee 2, D-18196 Dummerstorf, Germany.
Received 2013-11-15; Accepted 2014-1-22; Published 2014-3-10
Abstract
Biochemical and biophysical processes that take place in muscle under relaxed and stressed conditions depend on the abundance and activity of gene products of metabolic and structural pathways. In livestock at post-mortem, these muscle properties determine aspects of meat quality and are measurable. The conversion of muscle to meat mimics pathological processes associated with muscle ischemia, injury or damage in humans and it is an economic factor in pork production. Linkage, association, and expression analyses independently contributed to the identification of trait-associated molecular pathways and genes. We aim at providing multiple evidences for the role of specific genes in meat quality by integrating a genome-wide association study (GWAS) for meat quality traits and the detection of eQTL based on trait-correlated expressed genes and trait-associated markers. The GWAS revealed 51 and 200 SNPs significantly associated with meat quality in a crossbred Pietrain×(German Landrace×Large White) (Pi×(GL×LW)) and a purebred German Landrace (GL) population, respectively. Most significant SNPs in Pi×(GL×LW) were located on chromosomes (SSC) 4 and 6. The data of 47,836 eQTLs at a significance level of p<10-5 were used to scale down the number candidate genes located in these regions. These SNPs on SSC4 showed association with expression levels of ZNF704, IMPA1, and OXSR1; SSC6 SNPs were associated with expression of SIGLEC10 and PIH1D1. Most significant SNPs in GL were located on SSC6 and associated with expression levels of PIH1D1, SIGLEC10, TBCB, LOC100518735, KIF1B, LOC100514845, and two unknown genes. The abundance of transcripts of these genes in muscle, in turn, is significantly correlated with meat quality traits. We identified several genes with evidence for their candidacy for meat quality arising from the integrative approach of a genome-wide association study and eQTL analysis.
Keywords: SNP chip, microarray, eQTL, GWAS, pork quality.
Introduction
The muscle is a complex tissue representing a major energy consumer and storage organ. An imbalance of nutrient, energy, and oxygen supply and demand in the muscle cells is evident in many common complex diseases. The consequences of these imbalances are likely the termination of nutrient and energy supply and anoxia in muscle cells, which also occurs at post mortem. Physiological processes of the change from muscle to meat involve a large pattern of genes associated with both muscle structure and metabolic processes [1-3]. Systems genetics provides a systems level perspective of the role of genetic variation and facilitates elucidating molecular networks contributing to the expression of complex traits, cell functions and diseases [4-6].
To improve meat quality is one of the aims for pig breeding programs. Meat quality can be technologically measured by pH, conductivity, colour, and DVMLP. These parameters are correlated with or dependent on each other [7-8]. Selection for improved meat quality is based on estimated breeding values derived from post mortem assessments of relatives of boars and dams of breeding lines and hampered by a relatively moderate to low heritability [9-10]. There are still variations of meat quality traits among pig populations and in particular individual variation among siblings could be addressed for further improvement by means of DNA-based selection. Therefore, it is important to identify candidate genes as well as molecular mechanisms influencing meat quality that can be applied as biomarkers in early age selection. Recently, a number of genome-wide association studies (GWAS) were carried out using a high-throughput SNP-genotyping technology (PorcineSNP60 BeadChip) for different traits in pigs such as boar taint [11-12], meat quality, and growth and body composition [13-14].
In the present study, we aimed at the detection of SNPs associated with meat quality traits in commercial populations. In order to further identify candidate genes with positional and functional evidence for their impact on muscle properties and meat quality, genes were considered that showed trait-correlated expression and whose transcription levels were influenced by the trait-associated SNPs. We genotyped and assessed genome-wide association of SNPs and meat quality in a commercial crossbred herd of Pietrain×(German Large White×German Landrace) (Pi×(GL×LW)). In fact, the three-way-cross of (Pi×(DL×DE))GL×LW)) represents the foremost hybrid population used in meat production in Germany that is delivered to consumers. Thus the meat quality of this crossbred is of particular interest. Moreover, the purebred German Landrace (GL) was also investigated, which is commonly used as a dam line in crossbred breeding schemes. With the help of dense markers and improved annotation of the porcine reference genome Sscrofa 10.2, we were able to integrate our eQTL data and the GWAS results and to identify candidate genes closely linked to the traits that may be applied in genetic selection programs.
Material and Methods
Animals and sample collection
Animal care and tissue collection procedures followed the guidelines of the German Law of Animal Protection, and the experimental protocol was approved by the Animal Care Committee of the Leibniz Institute for Farm Animal Biology. Performance-tested pigs from commercial herds of Pi×(GL×LW) (n=475) and GL (n=1046) were used for GWAS. 207 out of 475 Pi×(GL×LW) samples were used for expression profile analysis. Samples were collected from pigs at an average age of 170 days at the experimental slaughter facility of the Leibniz Institute for Farm Animal Biology. Musculus longissimus dorsi tissue samples were promptly dissected, snap-frozen in liquid nitrogen, and stored at -80˚C.
SNP genotypes
Genotyping was performed using the PorcineSNP60 BeadChip (Illumina Inc., San Diego, CA, USA) per manufacturer's SNP Infinium HD assay protocol. In brief, 200 ng of DNA were amplified, fragmented, and hybridized to the PorcineSNP60 BeadChip containing 62,163 locus-specific 50-mers that are covalently linked to beads distributed on the microarray surface. Single-base extension of captured oligos incorporated labels that were detected by Illumina iScan, and images were subsequently converted to intensity data. Intensity data were normalized and assigned a cluster position, genotype, and quality score with GenomeStudio software (Illumina Inc.). Samples with call rates < 95% were removed. Markers with low minor-allele frequency (< 5%) were also excluded. Moreover, in the purebred population of GL markers that strongly deviated from Hardy-Weinberg equilibrium (p < 0.0001) were excluded. However, deviation from Hardy-Weinberg equilibrium was not considered in Pi×(GL×LW) because in a three-way crossbreed pig population deviation from Hardy-Weinberg equilibrium can be expected due to discordant allele frequencies in the parental breeds. The average call rate for all samples was 99.8% ± 0.2. The markers of the 60K chip were mapped to the porcine reference genome, Sscrofa 10.2.
Transcript abundances
Gene expression profiling of Musculus longissimus dorsi samples was conducted with 207 animals. In brief, total RNA was isolated using TRI Reagent (Sigma, Taufkirchen, Germany) and used for target preparation for microarray hybridization. Using the Affymetrix One cycle synthesis and labeling kit (Affymetrix, UK), 500 ng of total RNA were reverse-transcribed into cDNA transcribed into cRNA and labeled to prepare antisense biotinylated RNA targets according to Affymetrix protocols. Quality of hybridization was assessed following the manufacturer's recommendations, which all samples passed. Data were analyzed with the Affymetrix GCOS 1.1.1 software, using global scaling to a target signal of 500. Data were processed with MAS5.0 to generate cell intensity files (present or absent). Quantitative expression levels of the present transcripts were estimated using the PLIER algorithm (Probe Logarithmic Intensity Error;www.affymetrix.com/support/technical/technotesmain) and normalized using the Expression Console software (Affymetrix). The microarray data related to all samples were deposited in the Gene Expression Omnibus public repository [GEO accession number: GSE32112].
GWAS, eQTL detection, and trait-correlated expression
Overall, meat quality traits and muscle gene expression levels (log2-transformed) were associated with SNPs by a mixed-model analysis of variance using JMP Genomics (SAS Institute, Cary, NC, USA).
Mixed-model analyses tested association between traits and single SNPs while adjusting simultaneously for population structure and family relatedness [15] using the following general matrix representation,
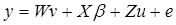
where y is the vector of one phenotypic trait analysed; β is a vector of fixed effects, i.e. SNP marker genotype, gender, and ryanodine receptor 1 (RYR1) genotype with the corresponding incidence matrix X, and u is a vector of random effects with the incidence matrix Z. Slaughter day was considered as random effect, as well as the polygenic effects to account for the family relatedness, which was computed as identity by descent of each pair for the kinship matrix. `v´ is a vector of covariates effects with the corresponding matrices W. Carcass weight and correlation-selected principal components significant at a false discovery rate (FDR) of 5% were considered as covariates; W is the matrix of covariates. `e´ is a vector of random residual effects that are normally distributed with mean zero and unknown variance  , where I is the identity matrix. A regression testing for linear trend of SNP alleles was performed. To correct for multiple testing, a FDR of 5% was used.
In order to point to candidate genes with multiple evidences for their candidacy, we asked the question which of the trait-associated SNPs is at the same time associated with the abundance of transcripts of genes that show trait-correlated expression. Therefore, we considered transcriptome and eQTL data of 207 Pi×(GL×LW) pigs representing a subset of animals used for the GWAS [GEO accession number: GSE32112; [6]. Correlation between the expression level and meat quality traits were analysed to obtain a list of candidate genes. In brief, the phenotypes and expression levels were adjusted for systematic effects by analysis of variance performed with the procedure 'Mixed' of the SAS software package (SAS version 9.1 SAS Institute, Cary, NC) before analysing their correlation. 'Sex and RYR genotype' were used as a fixed effect, 'sire' and 'slaughter day' as random effects, and 'carcass weight' as a covariate. Subsequently, Pearson correlation coefficients were calculated between the residuals of log2 transformed expression intensities and meat quality.
The sequences flanking the SNPs represented on the Illumina SNP chip, which were significantly associated with the level of transcription of any probe set of the Affymetrix expression microarrays, were assigned to the porcine genome sequences (Ensembl_Sscrofa_10.2). Annotation and localization of SNP sites and probe sets allowed discrimination of cis- and trans-regulation. We defined an eQTL as 'cis' if an associated SNP was located within an area less than 1 Mb from the probe set/gene. All other eQTL were considered as 'trans'.
Results
A total of 475 performance-tested Pi×(GL×LW) and 1046 commercial German Landrace (GL) pigs were genotyped with the Illumina PorcineSNP60 BeadChip consisting of 62,163 loci. After filtering, 47,524 SNPs for the Pi×(GL×LW) and 48,977 SNPs for the GL were passed for further analysis. Twelve meat quality traits were used for association study. Description, mean and standard deviation of the meat quality traits are listed in Table 1.
Meat quality traits recorded in Pi×(GL×LW) (n=475) and GL (n=1046).
| Trait | Definition | Mean±SD (n=475) [Pi×(GL×LW)] | Mean±SD (n=1046) GL |
|---|---|---|---|
| DVMLD | % weight loss of Mld collected 24 h post mortem, held for 48 h at 4°C | 5.38±2.1 | 3.96±1.7 |
| LF24MLD | Conductivity in Mld at 13th/14th rib 24 h post mortem | 5.19±2.1 | 3.76±1.2 |
| LF45MLD | Conductivity in Mld at 13th/14th rib 45 min post mortem | 4.87±1.6 | 4.16±0.6 |
| OPTO star (OSMLD) | meat colour in Mld at 13th/14th rib 24 h post mortem | 68.18±6.3 | 71.11±5.1 |
| Meat colour_a* | Minolta value a* for redness | 7.41±1.2 | 7.06±1.2 |
| Meat colour_b* | Minolta value b* for yellowness | 1.67±0.9 | 1.32±0.8 |
| Meat colour_L* | Minolta value L* for lightness | 48.37±2.8 | 48.47±2.3 |
| IMP24MLD | Impedance of Mld 24 h post mortem | 45.3±15.7 | 54.11±10.6 |
| PH45MLD | pH value in Mld at 13th/14th rib 45 min post mortem | 6.20±0.3 | 6.37±0.2 |
| PH24MLD | pH value in Mld at 13th/14th rib 24 h post mortem | 5.47±0.1 | 5.44±0.9 |
| PH45MSM | pH value in M. semimembranosus (Msm) 45 min post mortem | 6.25±0.3 | 6.33±0.2 |
| PH24MSM | pH value in M. semimembranosus (Msm) 24 h post mortem | 5.52±0.1 | 5.53±0.1 |
SD=standard deviation; Mld=Musculus longissimus dorsi; Msm=Muscle semimembranosus.
Phenotype of meat quality and SNP data of Pi×(GL×LW)
Genome-wide association analysis in Pi×(GL×LW)
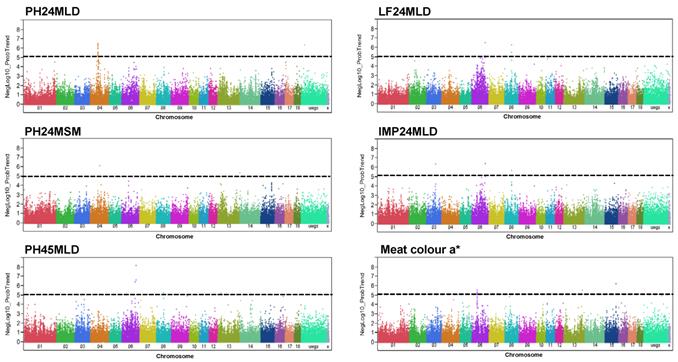
In Pi×(GL×LW) six meat quality traits (meat colour a*, LF24MLD, IMP24MLD, PH45MLD, PH24MSM, and PH24MLD) were significantly associated with 51 SNPs (p < 1 x 10⁻⁵) at FDR < 5% (Figure 1, Supplementary Material: Table S1). These markers explained for, on average, five percent of phenotypic variance (Table 2). We found that IMP24MLD and LF24MLD were significantly associated with SNPs at position 79.5 Mb of SSC8 and PH24MSM was significantly associated with one SNP on SSC4. The most prominent genome-wide association in Pi×(GL×LW) for PH24MLD was located on SSC4. 29 out of 51 significant markers were found associated with PH24MLD and located on chromosome 4 in the region close to 62 Mb. The most significant SNPs associated with meat colour a* were located at position 48-50 Mb of SSC6. While PH45MLD was significantly associated with three SNPs located at the end of SSC6.
Genome-wide association with meat quality traits in Pi×(GL×LW). Manhattan plots of genome-wide association analyses of six meat quality traits (PH24MLD, PH24MSM, PH45MLD, LF24MLD, IMP24MLD, and meat colour a*) in Pi×(GL×LW). Black lines indicate the significance threshold corresponding to negative log10 (NegLog10)>5.
Markers significantly associated with meat quality in Pi×(GL×LW).
| SNP ID | Trait | -log10 | % variance | FDR | SSC (Mb) |
|---|---|---|---|---|---|
| H3GA0045107 | a* | 6.2 | 6.1 | 2.92E-02 | 15 (136.7) |
| ASGA0089838 | a* | 5.6 | 5.4 | 3.22E-02 | 6 (49.1) |
| ASGA0104037 | a* | 5.6 | 5.4 | 3.22E-02 | 6 (48.8) |
| MARC0002500 | a* | 5.5 | 5.3 | 3.22E-02 | 13 (192.9) |
| DIAS0000492 | a* | 5.3 | 5.1 | 3.22E-02 | 6 (49.8) |
| MARC0050094 | IMP24MLD | 6.4 | 5.4 | 1.10E-02 | 6 (126.0) |
| MARC0013137 | IMP24MLD | 6.3 | 5.4 | 1.10E-02 | 3 (88.7) |
| ASGA0105614 | IMP24MLD | 5.6 | 4.7 | 3.61E-02 | 8 (79.5) |
| MARC0050094 | LF24MLD | 6.5 | 5.5 | 1.27E-02 | 6 (126.0) |
| ASGA0105614 | LF24MLD | 6.3 | 5.3 | 1.27E-02 | 8 (79.5) |
| MARC0071224 | LF24MLD | 5.5 | 4.6 | 4.86E-02 | 8 (79.5) |
| ALGA0025237 | PH24MLD | 6.5 | 5.5 | 2.83E-03 | 4 (62.2) |
| M1GA0005898 | PH24MLD | 6.5 | 5.5 | 2.83E-03 | 4 (62.2) |
| MARC0064834 | PH24MLD | 6.4 | 5.4 | 2.83E-03 | 4 (62.2) |
| MARC0004720 | PH24MLD | 6.4 | 5.4 | 2.83E-03 | 4 (62.1) |
| ALGA0025242 | PH24MLD | 6.3 | 5.3 | 2.83E-03 | 4 (62.2) |
| ASGA0020157 | PH24MSM | 6.1 | 5.1 | 3.63E-02 | 4 (78.8) |
| ASGA0029527 | PH45MLD | 8.1 | 7.0 | 3.56E-04 | 6 (126.0) |
| MARC0050094 | PH45MLD | 6.6 | 5.6 | 5.61E-03 | 6 (126.0) |
| ALGA0036716 | PH45MLD | 6.4 | 5.4 | 6.28E-03 | 6 (121.4) |
SNP ID=single nucleotide polymorphism identifier; FDR=false discovery rate per trait at maximum 5 closely neighbouring markers are listed.
Candidate genes in Pi×(GL×LW) located on SSC4 and SSC6 with functional evidence for their role in meat quality based on eQTL data
Most of the significant SNPs for meat colour a* in this study were found on SSC6 position 48-50 Mb. These significant SNPs were simultaneously associated with meat colour a* and the transcription level of TMEM160, SIGLEC10, SAE1, RASIP1, PIH1D1, GPAA1, GLTSCR2 and FTL (p < 1 x 10⁻⁵). The transcripts with the most significant correlations between their abundance and meat colour a* were SIGLEC10 (r = -0.29; p = 1.9 x 10⁻⁵) and PIH1D1 (r = 0.21; p = 1.98 x 10⁻³), which both have cis eQTL effects (p < 1 x 10-32 and p < 1 x 10-21, respectively). Both of them were also found significant for meat quality in the GL population (see also the results of the GL pigs).
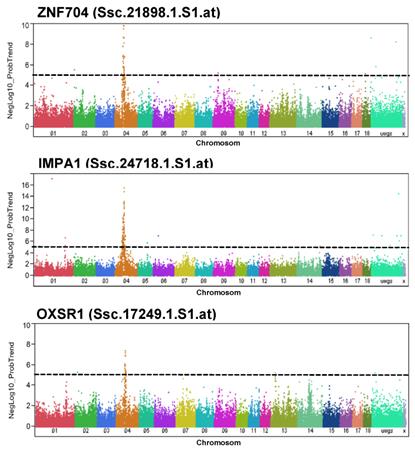
For PH24MLD, significantly trait-associated SNPs were found at position 62.1-62.2 Mb of SSC4. The transcript abundance of 4 of 24 loci located at that region (ZNF704, MRPS28, TPD52, and HEY1) correlated with PH24MLD. However, cis-eQTL configuration was only obvious for ZNF704. In fact, ZNF704 is located on SSC4 at 61.0 Mb and was negatively correlated with PH24MLD (r = -0.15; p = 0.03; FDR = 0.22). Other genes, whose transcript abundance was associated with markers located at position 62.1-62.2 Mb of SSC4, were OXSR1 and IMPA1. Manhattan plots for the abundance of the transcripts ZNF704, OXSR1, and IMPA1 demonstrated their association with the SNPs that were also associated with PH24MLD (Figure 2). Human IMPA1 is located on chromosome 8q21.13-q21.3, a region mostly syntenic to SSC4 [18]; therefore, we expected IMPA1 would also have a cis eQTL. However, no significant correlation between IMPA1 expression and PH24MLD was found. OXSR1 is located on SSC13 at 25.3 Mb, indicating trans eQTL configuration and negatively correlated with PH24MLD (r = -0.25; p = 0.0003; FDR = 0.03).
Genome-wide association with the abundance of selected transcripts in Pi×(GL×LW). Manhattan plots of genome-wide association analyses of transcript abundance of ZNF704, IMPA1, and OXSR1 in Pi×(GL×LW). Black lines indicate the significance threshold corresponding to negative log10 (NegLog10)>5.
Phenotype of meat quality and SNP data of GL
Genome-wide association analysis in GL
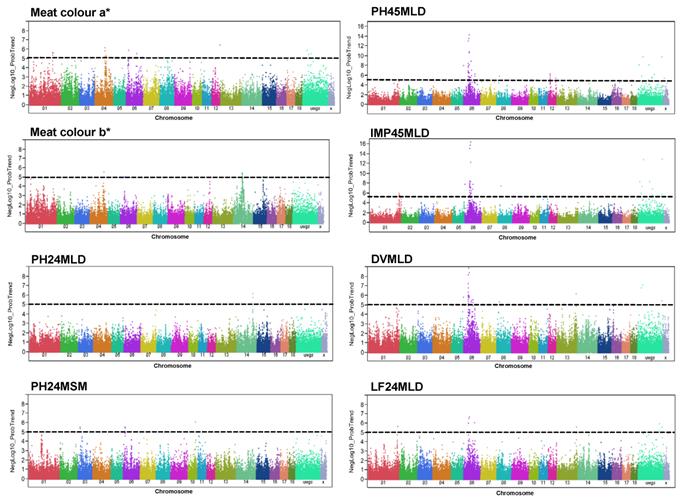
Eight GL meat quality traits were significantly associated with 200 SNPs at a threshold of p < 1 x 10⁻⁵ and FDR < 5%: meat colour a*, meat colour b*, DVMLD, IMP24MLD, LF24MLD, PH24MLD, PH24MSM, and PH45MLD (Figure 3, Supplementary Material: Table S2). These markers explained for, on average, three percent of phenotypic variance. The top ranked significant SNPs are listed in Table 3. Almost all SNPs associated with meat colour a* and b* were found on SSC4, 6, 12, and 14. Most prominent SNPs associated with meat colour a* were located on SSC4 at 84-85 Mb, while those associated with meat colour b* were on SSC14 at 66-67 Mb. SNPs on SSC14 at position 121-123 Mb significantly associated with PH24MLD.
Genome-wide association with meat quality traits in GL. Manhattan plots of genome-wide association analyses of eight meat quality traits (meat colour a*, meat colour b*, PH24MLD, PH24MSM, PH45MLD, IMP24MLD, DVMLD, and LF24MLD) in GL. Black lines indicate the significance threshold corresponding to negative log10 (NegLog10)>5.
Markers significantly associated with meat quality in GL.
| SNP ID | Trait | -log10 | % variance | FDR | SSC (Mb) |
|---|---|---|---|---|---|
| ALGA0026185 | a* | 5.9 | 2.3 | 1.35E-02 | 4 (85.5) |
| DIAS0000453 | a* | 5.9 | 2.3 | 1.35E-02 | 6 (17.9) |
| DIAS0004564 | a* | 5.9 | 2.3 | 1.35E-02 | |
| MARC0032957 | a* | 6.2 | 2.4 | 1.35E-02 | 4 (85.6) |
| MARC0110971 | a* | 6.5 | 2.5 | 1.35E-02 | 12 (63.4) |
| ALGA0078229 | b* | 5.5 | 2.1 | 2.42E-02 | 14 (66.2) |
| ALGA0078243 | b* | 5.3 | 2.0 | 2.42E-02 | 14 (66.3) |
| DRGA0013928 | b* | 5.4 | 2.1 | 2.42E-02 | 14 (66.4) |
| M1GA0006309 | b* | 5.6 | 2.1 | 2.42E-02 | 4 (114.7) |
| MARC0008126 | b* | 5.4 | 2.1 | 2.42E-02 | 14 (65.0) |
| ALGA0119163 | DVMLD | 8.9 | 3.3 | 8.11E-05 | 6 (40.9) |
| ASGA0085824 | DVMLD | 8.4 | 3.4 | 6.50E-05 | 6 (54.4) |
| H3GA0052956 | DVMLD | 8.9 | 3.6 | 3.08E-05 | 6 (44.2) |
| MARC0033885 | DVMLD | 7.2 | 2.9 | 5.67E-04 | 6 (38.7) |
| MARC0042606 | DVMLD | 8.9 | 3.6 | 3.08E-05 | 6 (44.2) |
| ALGA0119163 | IMP24MLD | 15.1 | 6.3 | 1.03E-11 | 6 (40.9) |
| ASGA0085824 | IMP24MLD | 16.6 | 6.9 | 2.17E-12 | 6 (54.4) |
| ASGA0096911 | IMP24MLD | 12.9 | 5.4 | 1.24E-09 | |
| H3GA0052956 | IMP24MLD | 15.7 | 6.6 | 3.34E-12 | 6 (44.2) |
| MARC0042606 | IMP24MLD | 15.7 | 6.6 | 3.34E-12 | 6 (44.2) |
| ALGA0119163 | LF24MLD | 6.0 | 2.4 | 9.00E-03 | 6 (40.9) |
| ASGA0085824 | LF24MLD | 6.7 | 2.6 | 5.32E-03 | 6 (54.4) |
| ASGA0092591 | LF24MLD | 6.1 | 2.4 | 9.00E-03 | 6 (101.7) |
| H3GA0052956 | LF24MLD | 6.5 | 2.6 | 5.32E-03 | 6 (44.2) |
| MARC0042606 | LF24MLD | 6.5 | 2.6 | 5.32E-03 | 6 (44.2) |
| ASGA0066131 | PH24MLD | 6.2 | 2.4 | 3.27E-02 | 14 (121.8) |
| ASGA0066204 | PH24MLD | 5.7 | 2.2 | 4.41E-02 | 14 (123.9) |
| ALGA0017926 | PH24MSM | 5.6 | 2.1 | 3.53E-02 | 3 (19.9) |
| ALGA0114559 | PH24MSM | 5.5 | 2.1 | 3.53E-02 | 6 (15.3) |
| ALGA0117065 | PH24MSM | 5.6 | 2.1 | 3.53E-02 | 6 (15.4) |
| ASGA0094879 | PH24MSM | 5.4 | 2.1 | 3.53E-02 | 6 (15.4) |
| MARC0009056 | PH24MSM | 6.0 | 2.4 | 3.53E-02 | 10 (61.6) |
| ALGA0119163 | PH45MLD | 13.0 | 5.3 | 1.31E-09 | 6 (40.9) |
| ASGA0085824 | PH45MLD | 14.3 | 5.9 | 2.44E-10 | 6 (54.4) |
| ASGA0091611 | PH45MLD | 10.8 | 4.4 | 1.55E-07 | 6 (60.1) |
| H3GA0052956 | PH45MLD | 13.5 | 5.6 | 4.69E-10 | 6 (44.2) |
| MARC0042606 | PH45MLD | 13.5 | 5.6 | 4.69E-10 | 6 (44.2) |
SNP ID=single nucleotide polymorphism identifier; FDR=false discovery rate per trait at maximum 5 closely neighbouring markers are listed
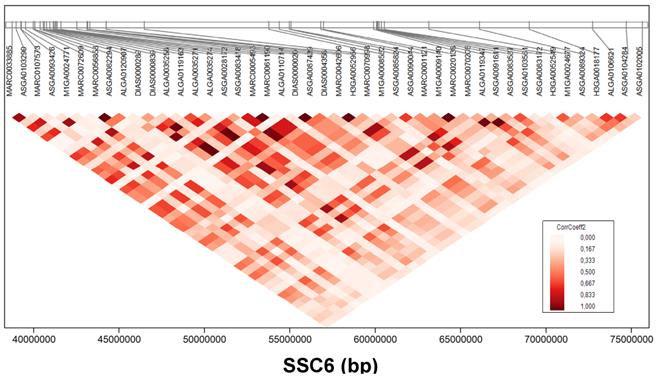
The most promising region in this study for meat quality in GL was found on SSC6 (Figure 3). Four meat quality traits, PH45MLD, DVMLD, IMP24MLD, and LF24MLD, were associated partially with the same SNPs. Fifty-four SNPs located at 38.7-75.6 Mb were significantly (FDR < 5%) associated with PH45MLD; SNPs at 38.7-87.3 Mb were associated with DVMLD; SNPs at 28.7-74.7 Mb were associated with IMP24MLD; and SNPs at 40.9-54.3 Mb were associated with LF24MLD. For example, SNP ASGA0085824 (54.4 Mb on SSC6) was highly associated with PH45MLD (FDR < 2.44x10⁻¹⁰), DVMLD (FDR < 6.50x10-05), IMP24MLD (FDR < 2.17x10⁻¹²), and LF24MLD (FDR < 5.32x10-03). The linkage disequilibrium structures of these significant SNPs associated with meat quality located on SSC6 at position 38-75 Mb is shown in figure 4.
Linkage disequilibrium of single nucleotide polymorphisms (SNPs) associated with meat quality. Linkage disequilibrium structures of SNPs located on SSC6 between 38-75 Mb that significantly associated with meat quality. Colour indicates the level of linkage disequilibrium between loci (correlation coefficient) as depicted in the key.
Candidate genes in GL breed located on SSC6 with functional evidence for their role in meat quality based on eQTL data
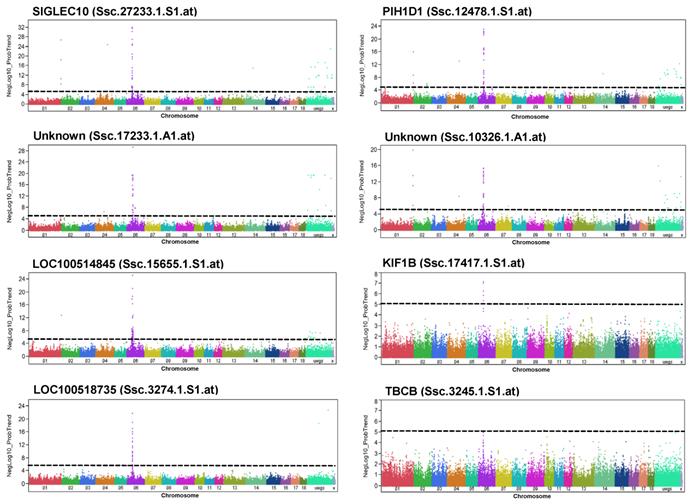
Taking advantage of available eQTL data from Pi×(GL×LW), and considering only significantly trait-associated SNPs (200 SNPs), we focused on SNPs located on SSC6 (111). Moreover, we further filtered by selecting those SNPs that were eQTL to transcripts significantly correlated with four meat quality traits, PH45MLD, DVMLD, IMP24MLD, and LF24MLD, which were eight transcripts (Table 4, Figure 5). Six of these genes (SIGLEC10, PIH1D1, PSENEN (LOC100518735), Platelet-activating factor acetylhydrolase IB subunit gamma-like (LOC100514845), KIF1B, TBCB) are located on SSC6 at 40-64 Mb, indicating the existence of cis eQTL; two were not yet annotated.
Correlation coefficients between meat quality traits and abundance of SSC6 transcripts with eQTL corresponding to SNPs that are significantly associated with meat quality.
| Gene | DVMLD | IMP24MLD | LF24MLD | PH45MLD | SSC (Mb) | |
|---|---|---|---|---|---|---|
| Ssc_10326_1_A1_at | unknown | 0.22 (1.1x10⁻³) | -0.24 (4.8x10⁻⁴) | 0.24 (4.6x10⁻⁴) | -0.23 (6.6x10⁻⁴) | - |
| Ssc_12478_1_S1_at | PIH1D1 | 0.30 (1.5x10⁻⁵) | -0.28 (4.1x10⁻⁵) | 0.25 (2.4x10⁻⁴) | -0.34 (7.1x10⁻⁷) | 6 (50.2) |
| Ssc_27233_1_S1_at | SIGLEC10 | -0.26 (1.3x10⁻⁴) | 0.29 (2.0x10⁻⁵) | -0.32 (3.4x10⁻⁶) | 0.28 (6.1x10⁻⁵) | 6 (51.7) |
| Ssc_3245_1_S1_at | TBCB | 0.22 (1.1x 10⁻³) | -0.16 (1.9x10⁻²) | 0.13 (5.4x10⁻²) | -0.16 (2.4x10⁻²) | 6 (40.8) |
| Ssc_3274_1_S1_at | LOC100518735 | 0.20 (4.0x10⁻³) | -0.14 (4.6x10⁻²) | 0.16 (2.2x10⁻²) | -0.19 (5.9x10⁻³) | 6 (40.6) |
| Ssc_17417_1_S1_at | KIF1B | -0.18 (1.0x10⁻²) | 0.18 (9.2x10⁻³) | -0.13 (6.0x10⁻²) | 0.22 (1.5x10⁻³) | 6 (64.5) |
| Ssc_15655_1_S1_at | LOC100514845 | 0.25 (2.7x10⁻⁴) | -0.22 (1.7 x10⁻³) | 0.23 (9.4x10⁻⁴) | -0.23 (1.0x10⁻³) | 6 (45.5) |
| Ssc_17233_1_A1_at | unknown | 0.15 (3.4x10⁻²) | -0.16 (2.3 x10⁻²) | 0.23 (1.1x10⁻³) | -0.17 (1.3x10⁻²) | - |
Genome-wide association with the abundance of selected transcripts in GL. Manhattan plots of genome-wide association analyses of transcript abundance of SIGLEC10, LOC100514845, LOC100518735, PIH1D1, unknown, KIF1B, TBCB and two non-annotated transcripts (unknown) in GL. Black lines indicate the significance threshold corresponding to negative log10 (NegLog10)>5.
Discussion
In Pi×(GL×LW) and GL GWAS revealed numerous SNP that were associated with meat quality traits. Most of the associated markers displayed peaks of closely linked loci that point to particular genomic regions. In fact, in Pi×(GL×LW) most of these SNPs were found on SSC4 and SSC6; in GL on SSC6. In order to promote the identification of candidate genes within these regions, we addressed the association of these markers with the abundance of transcripts of trait-correlated expressed genes. In total some 25,000 eQTL at p < 10-6 of 11,000 transcripts found in porcine skeletal muscle by microarray analysis. We demonstrate that the global microarray eQTL analysis can serve for narrowing down the candidate genes for quantitative traits related to meat quality when it is integrated with the analyses of marker trait association and probe set trait correlation. Trait-associated SNPs are more likely to be eQTLs and that application of this information can enhance discovery of trait-associated SNPs for complex phenotypes [19].
Genome-wide association analysis in Pi×(GL×LW) and eQTL data
Most previously identified QTL at 62-64 Mb of SSC4 were associated with pig carcass or production traits [20], whereas, here we found markers associated with PH24MLD at that position in Pi×(GL×LW). The most significant SNPs associated with meat colour a* and PH45MLD in this study were located on SSC6. Previous studies reported quantitative trait loci (QTL) of meat colour on SSC4 [21-22] and SSC14 [23] depending on the mapping population.
Essentially, eQTL analysis provides evidence for genomic variation that affects the abundance of transcripts. Here eQTL-data that were obtained from a subset of 207 animals of the Pi×(GL×LW), were integrated with the GWAS results to identify candidate genes whose transcription levels were correlated with meat quality traits and associated with the respective significantly trait-associated SNPs. Accordingly, ZNF704 (zinc finger protein 704) turned out as positional and functional candidate gene in the region on SSC4 because of the transcript levels were associated with the same significant SNP (cis eQTL) and correlated with meat quality. However, the knowledge of the biological function of ZNF704 is still limited. Similarly, SIGLEC10 (sialic acid binding Ig-like lectin 10) and PIH1D1 (PIH1 domain containing 1) were located in a QTL region (SSC6, 48-50 Mb) according to GWAS, showed trait-associated expression, and had a cis eQTL at their position. Interestingly, these genes were also highlighted as functional and positional candidate genes in GL. In addition OXSR1 is worth mentioning, because it is known to belong to the Ser/Thr kinase family. OXSR1 (oxidative stress responsive 1) regulates downstream kinases in response to environmental stress and plays a role in ion co-transportation in kidney [24], ROS formation, and migration of dendritic cells [25]. OXSR1 is also found in human heart, but relatively little is known about its functional pathways [26]. Since stress plays a key role in meat quality, the function and localization of OXSR1 suggest it is a candidate gene.
Genome-wide association analysis in GL and eQTL data
Our most prominent SNPs associated with meat colour a* and colour b* were on SSC4 und SSC14, respectively, where QTL were previously shown [22-23], [27-29]. Further, Duthie and colleagues [21] detected a QTL for the pH of ham 24 hours post-mortem surrounding the same region of SSC14, which was also found in our study.
Previous studies have also identified QTL for meat quality traits on SSC6 [30-32]. Markljung and colleagues [31] identified QTL affecting water content, DVMLP (drip loss), and pH decline between positions 51 and 69 cM on SSC6. RYR1 mutations, located on SSC6, frequently occur in the Pietrain breed and significantly impact meat quality, stress resistance, and carcass composition [33]. Several QTL for meat quality traits were found next to RYR1 on SSC6, although RYR1 was included in the QTL mapping model as a fixed effect [32]. The GL pigs in this study did not carry this mutation. However, also for non-carriers of the RYR1 mutation QTLs for meat quality traits in this region were identified [30].
Candidate genes in the GL breed located on SSC6 with functional evidence for their role in meat quality based on eQTL data are involved in physiological pathways that have functional implications for meat quality. SIGLEC10 (sialic acid binding Ig-like lectin 10) is located on SSC6 and encodes a protein that specifically recognizes sialic acids [34]. Genetic regulation of SIGLEC10 was identified by eQTL to be associated with post-mortem meat quality traits in this study. SIGLEC10 transcription levels were highly correlated with traits related to water holding capacity (DVMLD, IMP24MLD, LF24MLD, and PH45MLD). Sarcolemmal sialic acid levels were reduced in dystrophic muscles due to the release of trace amounts of sialidase from damaged muscle and were a sensitive detection method for muscle injury with utility for muscular dystrophy [35]. Here we found that SIGLEC10 expression levels negatively correlated with DVMLP and other post-mortem phenotypes that reflect damaged muscles. This suggests that SIGLEC10 is a marker not only for cardiac and skeletal muscle cell damage, but also for meat quality.
PIH1D1 (PIH1 domain containing 1) is also located on SSC6 and encodes a component of the apoptosis-regulating complex R2TP. Genetic regulation of PIH1D1 was identified by eQTL and associated with meat quality traits by GWA analysis. RNA interference experiments showed that knock-down of PIH1D1 enhances apoptosis in vitro [36]. Moreover, a study indicated that apoptosis of duck skeletal muscle cell was associated with the postmortem development of meat quality traits such as meat colour, water holding capacity and tenderness [37].
The probe set assigned LOC100518735 represents the presenilin enhancer gamma secretase subunit (PSENEN), which encodes a component of the gamma-secretase protein complex [38]. Presenilins are involved in signaling processes across membranes including Notch signaling that affects a broad range of developmental processes. Interestingly, presenilins also regulate Ca2+ release via ryanodine or inositol 1,4,5-trisphosphate channels [39-40]. Mutations in presenilins decrease the activity of the sarcoendoplasmic reticulum Ca2+ transport ATPase (SERCA) pump [41] and disrupt Ca2+ homeostasis [42]. Here, the expression of PSENEN was correlated with meat quality and was genetically regulated. In muscle, RYR regulates abnormalities in the Ca2+ release channel and contributes to meat quality [43]. Correspondingly, PSENEN might be related to meat quality due to its impact on Ca2+ homeostasis and thus represents a potential candidate gene for meat quality on SSC6.
Platelet-activating factor acetylhydrolase IB subunit gamma-like (LOC100514845) encodes an enzymatic subunit of the platelet-activating factor acetylhydrolase isoform 1B complex. LOC100514845 is important for brain development and is associated with mental retardation, ataxia, and brain atrophy [44-45]. Although most SNPs significantly associated with meat quality traits (PH45MLD, DVMLD, IMP24MLD, LF24MLD) correlated with expression of LOC100514845, the mechanisms of these genes in muscle remain unclear.
KIF1B (kinesin family member 1B) is involved in mitochondrial transport [46]. Mice heterozygous for Kif1b have impaired transport of synaptic vesicle precursors and muscle weakness [47]. A dominant role of mitochondria is the production of ATP by oxidative phosphorylation that depends on oxygen supply. When oxygen is limited (post mortem or during prolonged vigorous exercise) the glucose metabolism occurs by anaerobic respiration, a process that is independent of the mitochondria. A shift from aerobic to anaerobic metabolism - favouring the production of lactic acid - results in a pH decline post mortem and thereby influence the meat quality [48]. Together mitochondrial processes and glucose metabolism play a significant role in muscle and thus impact meat quality.
Tubulin folding cofactor B (TBCB) is a cytoskeleton-associated protein (CAP) that modulates cytoskeletal activity [49]. There is not information about the specific function of TBCB in muscle cells; however, cytoskeleton-associated proteins are known to mediate interactions between protein filaments of the cytoskeleton including microtubules, intermediate filaments, and actin filaments. In particular, the degradation of cytoskeletal and other structural proteins plays an important role in meat quality and correspondingly differential expression of genes related to cytoskeleton was associated with meat quality traits [1-2]. The present results also suggested TBCB as a candidate gene on SSC6 with an eQTL effect and a correlation between its transcription level and meat quality.
In summary, on SSC4 ZNF704 and on SSC6 PIH1D1, SIGLEC10, TBCB, LOC100518735, KIF1B, LOC100514845, as well as two not yet annotated genes, represent such candidate genes showing trait-correlated expression and transcript abundances associated with markers, which at the same time show significant trait-association. Remarkably, the majority of these genes were located close to the respective significant markers, indicating the existence of cis-eQTL. Thus in our study, eQTL analysis and trait-correlated expression data enhanced the nomination of genes as candidate genes that flank the trait-associated GWAS-markers.
Supplementary Material
Table S1. SNP markers associated with meat quality traits in Pietrain×(German Landrace×Large White) (Pi×(GL×LW)) at a threshold of negative log10 of p > 5 and FDR<5%. Table S2. SNP markers associated with meat quality traits in German Landrace (GL) at a threshold of negative log10 of p > 5 and FDR<5%.
Acknowledgements
The authors thank A. Jugert, J. Bittner, and H. Tychsen for excellent technical help. This research was supported by the German Research Foundation (Deutsche Forschungsgemeinschaft, DFG; PO753/7-1 and WI1754/14-1).
Authors' contributions
SP and KW conceived the study. SP analysed the data and drafted the manuscript; EM, NT, and MS helped in sampling and data collection; KW discussed and contributed to data interpretation and helped in drafting the manuscript. All authors read and approved the final manuscript.
Competing interests
The authors declare that they have no competing interests.
References
1. Ponsuksili S, Murani E, Phatsara C. et al. Porcine muscle sensory attributes associate with major changes in gene networks involving CAPZB, ANKRD1, and CTBP2. Funct Integr Genomics. 2009;9:455-471
2. Ponsuksili S, Murani E, Schwerin M. et al. Identification of expression QTL (eQTL) of genes expressed in porcine M. longissimus dorsi and associated with meat quality traits. BMC Genomics. 2010;11:572
3. Ponsuksili S, Du Y, Hadlich F. et al. Correlated mRNAs and miRNAs from co-expression and regulatory networks affect porcine muscle and finally meat properties. BMC Genomics. 2013;14:533
4. Farber CR, van Nas A, Ghazalpour A. et al. An integrative genetics approach to identify candidate genes regulating BMD: combining linkage, gene expression, and association. J Bone Miner Res. 2009;24:105-116
5. Calabrese G, Bennett BJ, Orozco L. et al. Systems genetic analysis of osteoblast-lineage cells. PLoS Genet. 2012;8:e1003150
6. Ponsuksili S, Du Y, Murani E. et al. Elucidating molecular networks that either affect or respond to plasma cortisol concentration in target tissues of liver and muscle. Genetics. 2012;192:1109-1122
7. Hodgson RR, Belk KE, Savell JW. et al. Development of a quantitative quality grading system for mature cow carcasses. J Anim Sci. 1992;70:1840-1847
8. Liu Y, Lyon BG, Windham WR. et al. Principal component analysis of physical, color, and sensory characteristics of chicken breasts deboned at two, four, six, and twenty-four hours postmortem. Poult Sci. 2004;83:101-108
9. Sellier P Genetics of meat and carcass traits. In The Genetics of the Pig. Edited by Rothschild MF, Ruvinsky A: New York: CAB Int. 1998:463-510
10. van Wijk HJ, Arts DJ, Matthews JO. et al. Genetic parameters for carcass composition and pork quality estimated in a commercial production chain. J Anim Sci. 2005;83:324-333
11. Duijvesteijn N, Knol EF, Merks JW. et al. A genome-wide association study on androstenone levels in pigs reveals a cluster of candidate genes on chromosome 6. BMC Genet. 2010;11:42
12. Grindflek E, Lien S, Hamland H. et al. Large scale genome-wide association and LDLA mapping study identifies QTLs for boar taint and related sex steroids. BMC Genomics. 2011;12:362
13. Fernández AI, Pérez-Montarelo D, Barragán C. et al. Genome-wide linkage analysis of QTL for growth and body composition employing the PorcineSNP60 BeadChip. BMC Genet. 2012;13:41
14. Becker D, Wimmers K, Luther H. et al. A genome-wide association study to detect QTL for commercially important traits in Swiss Large White boars. PLoS One. 2013;8:e55951
15. Yu J, Pressoir G, Briggs WH. et al. A unified mixed-model method for association mapping that accounts for multiple levels of relatedness. Nat Genet. 2006;38:203-208
16. Zhao H, Rebbeck TR, Mitra N. A propensity score approach to correction for bias due to population stratification using genetic and non-genetic factors. Genet Epidemiol. 2009;33:679-690
17. Lee S, Wright FA, Zou F. Control of population stratification by correlation-selected principal components. Biometrics. 2011;67:967-974
18. Kim J, Lee T, Kim TH. et al. An integrated approach of comparative genomics and heritability analysis of pig and human on obesity trait: evidence for candidate genes on human chromosome 2. BMC Genomics. 2012;13:711
19. Nicolae DL, Gamazon E, Zhang W. et al. Trait-associated SNPs are more likely to be eQTLs: annotation to enhance discovery from GWAS. PLoS Genet. 2010;6:e1000888
20. Hu ZL, Park CA, Wu XL. et al. Animal QTLdb: an improved database tool for livestock animal QTL/association data dissemination in the post-genome era. Nucleic Acids Res. 2013;41:D871-D879
21. Duthie CA, Simm G, Doeschl-Wilson A. et al. Quantitative trait loci for meat quality traits in pigs considering imprinting and epistatic effects. Meat Sci. 2011;87:394-402
22. Ovilo C, Clop A, Noguera JL. et al. Quantitative trait locus mapping for meat quality traits in an Iberian × Landrace F2 pig population. J Anim Sci. 2002;80:2801-2808
23. de Koning DJ, Harlizius B, Rattink AP. et al. Detection and characterization of quantitative trait loci for meat quality traits in pigs. J Anim Sci. 2001;79:2812-2819
24. Mercier-Zuber A, O'Shaughnessy KM. Role of SPAK and OSR1 signalling in the regulation of NaCl cotransporters. Curr Opin Nephrol Hypertens. 2011;20:534-540
25. Pasham V, Rotte A, Yang W. et al. OSR1-sensitive regulation of Na+/H+ exchanger activity in dendritic cells. Am J Physiol Cell Physiol. 2012;303:C416-426
26. Aye TT, Scholten A, Taouatas N. et al. Proteome-wide protein concentrations in the human heart. Mol Bio Syst. 2010;6:1917-1927
27. van Wijk HJ, Buschbell H, Dibbits B. et al. Variance component analysis of quantitative trait loci for pork carcass composition and meat quality on SSC4 and SSC11. J Anim Sci. 2007;85:22-30
28. Rohrer GA, Thallman RM, Shackelford S. et al. A genome scan for loci affecting pork quality in a Duroc-Landrace F2 population. Anim Genet. 2005;37:17-27
29. Harmegnies N, Davin F, De Smet S. et al. Results of a whole-genome quantitative trait locus scan for growth, carcass composition and meat quality in a porcine four-way cross. Anim Genet. 2006;37:543-553
30. Malek M, Dekkers JC, Lee HK. et al. A molecular genome scan analysis to identify chromosomal regions influencing economic traits in the pig. II. Meat and muscle composition. Mamm Genome. 2001;12:637-645
31. Markljung E, Braunschweig MH, Karlskov-Mortensen P. et al. Genome-wide identification of quantitative trait loci in a cross between Hampshire and Landrace II: meat quality traits. BMC Genet. 2008;9:22
32. Stratz P, Baes C, Rückert C. et al. A two-step approach to map quantitative trait loci for meat quality in connected porcine F(2) crosses considering main and epistatic effects. Anim Genet. 2013;44:14-23
33. Yue G, Stratil A, Kopecny M. et al. Linkage and QTL mapping for Sus scrofa chromosome 6. J Anim Breed Genet. 2003;120:45-55
34. Li N, Zhang W, Wan T. et al. Cloning and characterization of Siglec-10, a novel sialic acid binding member of the Ig superfamily, from human dendritic cells. J Biol Chem. 2001;276:28106-28112
35. Iwata Y, Suzuki O, Wakabayashi S. Decreased surface sialic acid content is a sensitive indicator of muscle damage. Muscle Nerve. 2013;47:372-378
36. Inoue M, Saeki M, Egusa H. et al. PIH1D1, a subunit of R2TP complex, inhibits doxorubicin-induced apoptosis. Biochem Biophys Res Commun. 2010;403:340-344
37. Zhang M, Wang D, Huang W. et al. Apoptosis during postmortem conditioning and its relationship to duck meat quality. Food Chem. 2013;138:96-100
38. Small DH, Klaver DW, Foa L Presenilins, the gamma-secretase. still a complex problem. Mol Brain. 2010;3:7
39. Chan SL, Mayne M, Holden CP. et al. Presenilin-1 mutations increase levels of ryanodine receptors and calcium release in PC12 cells and cortical neurons. J Biol Chem. 2000;275:18195-18200
40. Landman N, Jeong SY, Shin SY. et al. Presenilin mutations linked to familial Alzheimer's disease cause an imbalance in phosphatidylinositol 4,5-bisphosphate metabolism. Proc Natl Acad Sci USA. 2006;103:19524-19529
41. Green KN, Demuro A, Akbari Y. et al. SERCA pump activity is physiologically regulated by presenilin and regulates amyloid beta production. J Cell Biol. 2008;181:1107-1116
42. Small DH, Gasperini R, Vincent AJ. et al. The role of Abeta-induced calcium dysregulation in the pathogenesis of Alzheimer's disease. J Alzheimers Di. 2009;16:225-233
43. MacLennan DH, Phillips MS. Malignant hyperthermia. Science. 1992;256:789-794
44. Nothwang HG, Kim HG, Aoki J. et al. Functional hemizygosity of PAFAH1B3 due to a PAFAH1B3-CLK2 fusion gene in a female with mental retardation, ataxia and atrophy of the brain. Hum Mol Genet. 2001;10:797-806
45. Escamez T, Bahamonde O, Tabares-Seisdedos R. et al. Developmental dynamics of PAFAH1B subunits during mouse brain development. J Comp Neurol. 2012;520:3877-3894
46. Nangaku M, Sato-Yoshitake R, Okada Y. et al. KIF1B, a novel microtubule plus end-directed monomeric motor protein for transport of mitochondria. Cell. 1994;79:1209-1220
47. Zhao C, Takita J, Tanaka Y. et al. Charcot-Marie-Tooth disease type 2A caused by mutation in a microtubule motor KIF1Bbeta. Cell. 2001;105:587-597
48. Ponsuksili S, Jonas E, Murani E. et al. Trait correlated expression combined with expression QTL analysis reveals biological pathways and candidate genes affecting water holding capacity of muscle. BMC Genomics. 2008;9:367
49. Watanabe TK, Shimizu F, Nagata M. et al. Cloning, expression, and mapping of CKAP1, which encodes a putative cytoskeleton-associated protein containing a CAP-GLY domain. Cytogenet Cell Genet. 1996;72:208-211
Author contact
![]() Corresponding author: Klaus Wimmers, Leibniz Institute for Farm Animal Biology, Wilhelm-Stahl-Allee 2, 18196 Dummerstorf, Germany, Phone: +49 38208 68700 Fax: +49 38208 68702 Email: wimmersde.
Corresponding author: Klaus Wimmers, Leibniz Institute for Farm Animal Biology, Wilhelm-Stahl-Allee 2, 18196 Dummerstorf, Germany, Phone: +49 38208 68700 Fax: +49 38208 68702 Email: wimmersde.