10
Impact Factor
ISSN: 1449-2288
Int J Biol Sci 2014; 10(8):825-833. doi:10.7150/ijbs.8672 This issue Cite
Research Paper
Characteristic Expression of Extracellular Matrix in Subcutaneous Adipose Tissue Development and Adipogenesis; Comparison with Visceral Adipose Tissue
Biological Science Laboratories, Kao Corporation, 2606 Akabane, Ichikai-Machi, Haga-gun, Tochigi, 321-3497, Japan.
Received 2014-1-25; Accepted 2014-6-16; Published 2014-7-25
Abstract
Adipose tissue is a connective tissue specified for energy metabolism and endocrines, but functional differences between subcutaneous adipose tissue (SAT) and visceral adipose tissue (VAT) have not been fully elucidated. To reveal the physiological role of SAT, we characterized in vivo tissue development and in vitro adipocyte differentiation. In a DNA microarray analysis of SAT and VAT in Wistar rats, functional annotation clusters of extracellular matrix (ECM)-related genes were found in SAT, and major ECM molecules expressed in adipose tissues were profiled. In a histological analysis and quantitative expression analysis, ECM expression patterns could be classified into two types: (i) a histogenesis-correlated type such as type IV and XV collagen, and laminin subunits, (ii) a high-SAT expression type such as type I, III, and V collagen and minor characteristic collagens. Type (i) was related to basal membrane and up-regulated in differentiated 3T3-L1 cells and in histogenesis at depot-specific timings. In contrast, type (ii) was related to fibrous forming and highly expressed in 3T3-L1 preadipocytes. Exceptionally, fibronectin was abundant in developed adipose tissue, although it was highly expressed in 3T3-L1 preadipocytes. The present study showed that adipose tissues site-specifically regulate molecular type and timing of ECM expression, and suggests that these characteristic ECM molecules provide a critical microenvironment, which may affect bioactivity of adipocyte itself and interacts with other tissues. It must be important to consider the depot-specific property for the treatment of obesity-related disorders, dermal dysfunction and for the tissue regeneration.
Keywords: adipocyte, subcutaneous, visceral, extracellular matrix, differentiation.
Introduction
Adipose tissue is not only a storage organ of excess energy as neutral lipids in intracellular droplets but also an active endocrine organ [1, 2]. The excessive accumulation of body fat, however, causes problems with health such as metabolic syndrome [3], dermal disorders [4] and esthetics. It has been reported that lipid metabolism and secretion contributing those problems vary at different sites between subcutaneous adipose tissue (SAT) and visceral adipose tissue (VAT), suggesting a site-specific function [5-8]. Cytokines secreted mainly by obese VAT, so-called “adipokines”, affect other organs and induce insulin resistance and diabetes [3].
Utilization of SAT began to be expected in plastic surgery and tissue engineering to regeneration of organs. SAT and its stem cells have multi-potency to differentiate into various mesenchymal cells, and are able to activate the function of skin accessory organs and dermal fibroblast [9, 10]. SAT can accumulate a large amount of lipid beneath the dermis in whole body under the homeostatic regulation. The lipid accumulation in SAT leads to lower risk of metabolic syndrome than that of VAT, but various subdermal and skin disorders are observed in obese and diabetes subjects possessed with hypertrophied subcutaneous fat [4, 11]. However, the origination, functional differentiation, and physiological role of SAT have not been fully elucidated. We hypothesized that SAT possess a specificity of gene expression involved in tissue-characteristic functions and interactions with other organs. We characterized tissue development and gene expression in SAT and VAT of immature and mature rats by DNA microarray, histological analysis, and quantitative expression analysis. Furthermore, in vitro gene expression change in adipocyte differentiation (adipogenesis) was compared to them.
Materials & Methods
Chemicals
Antibodies used for Western blot analysis were anti-rat α tubulin (Cell signaling Technology Japan, Tokyo, Japan) and anti-type I collagen (abbreviated as Col 1, abcam, Cambridge, UK). Anti-β1 and γ1 subunits of laminin (Lam b1 and Lam c1), and anti-fibronectin (FN1) were purchased from Santa Cruz Biotechnology (CA, USA). HRP-conjugated anti-rabbit IgG as secondary antibody and ECL plus Western blotting detection system (GE Healthcare, UK) were used for enhancing the signals. Antibodies used for immunohistochemistry were anti-Col 1 (Gentaur Molecular Products, Brussels, Belgium), anti-Lam (Affimetry BioReagents, CO, US), anti-FN1 (Affimetry BioReagents), and Alexa Fluor 488-conjugated secondary antibody (abcam). All other chemicals were of highest grade of purity commercially available.
Animals and Tissue Sampling
Male Wistar rats aged from 3 to 12 weeks were obtained from Japan SLC, Inc. (Shizuoka, Japan) and maintained at 22 ± 1 ºC under a 12-h light-dark cycle (lights on from 7:00 AM to 7:00 PM). The rats were fed laboratory chow, CE-2 obtained from CLEA Japan, Inc. (Tokyo, Japan), and allowed ad libitum access to water for at least three days to stabilize the metabolic conditions. Adipose tissues were dissected from each animal, and weighed. Dissected portions were the abdominal-inguinal subcutaneous fat pads (SAT beneath PC in Fig. 2) as SAT, as well as epididymal, retroperitoneal and perirenal fat pads as VAT. SAT and total VAT weights were divided by each body weight as adipose tissue / body weight ratio. We were certain that all applicable institutional and governmental regulations concerning the ethical use of animals were followed during this research. All animal experiments were conducted in the Experimental Animal Facility of Kao Tochigi Institute. The Animal Care Committee of Kao Tochigi Institute approved the present study. All experiments strictly followed the guidelines of that committee. All efforts were made to minimize suffering.
Cell Culture
3T3-L1 mouse fibroblast, a preadipocyte model, was obtained from ATCC (VA, USA) and was grown in 5% CO2 at 37°C in Dulbecco's modified Eagle's medium (DMEM) with 10% fetal bovine serum (FBS) supplemented with 1% penicillin-streptomycin mixture. At 2 days post-confluence, cells were differentiated in the medium containing 10 mg/L insulin, 0.5 mmol/L isobutylmethylxanthine, and 0.25 µmol/L dexamethasone for 2 days. From this point onwards, cells were treated with DMEM containing 10% FBS for seven days, and this medium was replaced every two days. Cultured 3T3-L1 cells were collected, and total RNA was extracted as below.
RNA Preparation
Total RNA was extracted from SAT and epididymal adipose tissue as VAT with guanidine-isothiocyanate using RNeasy Lipid Tissue Mini Kit (QIAGEN, Tokyo, Japan). Similarly, total RNA was extracted from 3T3-L1 cells using RNeasy Mini Kit (QIAGEN).
DNA Microarray
Fluorescent-labeled cRNAs were generated from total RNA of SAT and VAT in same animal using four rats aged 5 weeks, and used for hybridization to eight chips of the comprehensive DNA microarray. Briefly, cDNA was synthesized from total RNA (700 ng) and used to generate Cyanine 3-labeled cRNA using One-Color Spike-Mix and Low RNA Input Linear Amplification and Labeling Kit (Agilent Technologies, CA, USA) according to the manufacturer's instructions. Cyanine 3-labeled cRNA was fragmented and used for hybridization in 100 μL of the hybridization buffer using Gene Expression Hybridization Kit (Agilent Technologies). Hybridization to the array chips, rat whole genome 4 x 44K (Agilent Technologies), was performed overnight at 65 ºC, and their fluorescent images were superimposed using Microarray Scanner at a resolution of 5 μm with Agilent Feature Extraction 10.1 (Agilent Technologies). To define the scale of signal intensities obtained from all samples, raw signal values obtained from all spots were normalized between chips by Robust Multichip Average [12], and statistical analysis was performed using GeneSpring GX (Agilent Technologies) as software. Mean values of normalized signal intensities from SAT and VAT were compared by Benjamini hochburg FDR, p-value computation for multi testing correction, and paired T-test for parametric test. Genes with statistically significance and with the fold value above 2.0 were listed as SAT-high genes or VAT-high genes. Functional annotation clustering of these gene lists was performed using an analysis tool in DAVID Bioinformatics Resources 6.7 (http://david.abcc.ncifcrf.gov/, Laboratory of Immunopathogenesis and Bioinformatics, MD, US), which has original wide-range heterogeneous data content including functional terms used in database of GO, KEGG pathways, protein domains, etc. [13, 14].
Histological Analysis
Tissue specimens obtained from SAT and VAT in three rats were fixed with phosphate-buffered 4% paraformaldehyde solution, paraffin embedded, and sectioned (5 μm thick). Three sections from each specimen were treated with 0.3% hydrogen peroxide solution for 30 min. at room temperature, dehydrated, blocked with 3% skim milk in phosphate-buffered saline for 120 min, and then exposed to primary antibodies for rat Col 1 (2 μg/mL), Lam (20 μg/mL), FN1 (20 μg/mL) or control IgG for 120 min at 4 ºC. Bound antibody was visualized by secondary antibody, described in Chemicals, followed by counterstaining with DAPI. Some sections were used for Masson's trichrome staining. Pictures of specimen were taken under ×100 or ×400 magnification randomly at five sites on each specimens using a bright field or fluorescence microscopy.
RNA Analysis
Total RNA from SAT and VAT in five animals aged 4, 8 and 12 weeks was analyzed with the reverse transcription polymerase chain reaction (RT-PCR). Same analysis of the RNA from cultured cells was performed. Briefly, cDNA was synthesized from total RNA (5-20 ng) using TaqMan Reverse Transcription Reagents, and quantified by real-time PCR with a TaqMan PCR kit using a 7500 Fast Real-Time PCR System (Applied Biosystems Japan, Tokyo, Japan) according to the manufacturer's instructions. TaqMan Gene Expression Assay (Applied Biosystems Japan) with primer sets and fluorescence-labeled probe for interested genes were listed in Supplementary Material: Table S1. The interested genes were peroxisome proliferator-activated receptor γ2 (PPARγ) and adipose fatty acid binding protein (aFABP), α1 subunit of type I collagen (Col 1a1), α1 subunit of type III collagen (Col 3a1), α1 subunit of type IV collagen (Col 4a1), α1 subunit of type V collagen (Col 5a1), α1 subunit of type VI collagen (Col 6a1), α1 subunit of type XV collagen (Col 15a1), fibronectin (FN1), β1 and γ1 subunits of laminin (Lam b1 and c1). Expression of ribosomal protein large P0 (36B4) was used for an internal standard and normalization.
Protein Analysis
The interested protein amount was determined by Western blot analysis of SAT and VAT from five animals aged 4 and 12 weeks. Briefly, adipose tissue was homogenized in lysis buffer containing 1% Triton-X100, 150 mM NaCl, 50 mM Tris-HCl, pH 7.5, within protease inhibitor cocktail (Sigma-Aldrich, MO, US). Aliquots of tissue extract were made soluble in Laemmli buffer and heated for 5 minutes at 95 ºC. The samples (20 μg protein) were subjected to SDS-PAGE (5-15% resolving gel), transferred to PVDF membranes. The membranes were incubated with antibody reactive with rat Col 1 (1 μg/mL), Lam b1 (0.2 μg/mL), Lam c1 (0.2 μg/mL), FN1 (0.2 μg/mL), or α-tubulin (1/1000). Membranes were washed and incubated with secondary antibodies described in paragraph Chemicals. ECM protein was made visible by enhanced chemiluminescence using Luminescent Image Analyzer LAS-4000 ver.2.1 (FUJIFILM, Tokyo, Japan) and quantified by densitometry using software Multi Gauge ver.3.2 (FUJIFILM).
Statistic
All determined data are presented as the mean ± S.E.M. of each condition. Comparison of gene expression profile was described in paragraph DNA microarray. In the quantitative expression analysis, averages in two conditioned experiments were compared using unpaired Student's t-test, and a value of p<0.05 was taken as an indicator of statistical significance.
Results
Major expressed genes in adipose tissue using DNA microarray
To qualitatively characterize function of abundantly expressed genes in subcutaneous and visceral adipose tissue in rats, DNA microarray was performed, and 351 and 133 genes were identified as the SAT and VAT high-genes, respectively. The genes were clustered into 68 and 27 functional groups, respectively. The VAT-high gene clusters pertaining to the cell responses to extracellular signals were found (Supplementary Material: Table S2); however, the SAT high-gene clusters were strongly related to ECM including collagens, proteases, and cell adhesion (Supplementary Material: Table S3).
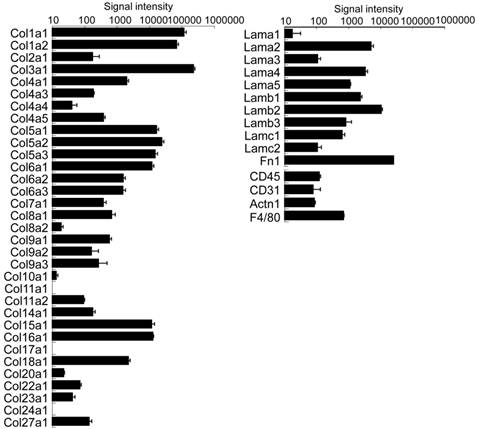
Since these features were revealed, normalized signal intensities of all collagens, laminins and FN1 were listed and expressed using log scale (Fig. 1). Expression profile showed major molecules of typical fibril-forming collagens [15] such as Col 1, 3, 5, microfibrillar Col 6, and proteoglycan-related Col 15 and 16 [16, 17] in adipose tissue. The basal membrane type ECM such as Col 4, various subunits of Lam, and FN1 were also detected [18]. Unexpectedly, unique minor signals of cartilage specific type Col 2, 9, and 27 [19] were also found.
In addition to the adipocyte related molecules, scarce expression of non-adipocyte markers, CD45 as a blood cell-derived marker, CD31 as a vascular endothelial marker, actin alpha 1 (Actn1) as a muscle marker, and F4/80 as a macrophage marker were detected, showing the heterogeneity of adipose tissue.
Histological differences of adipose tissues
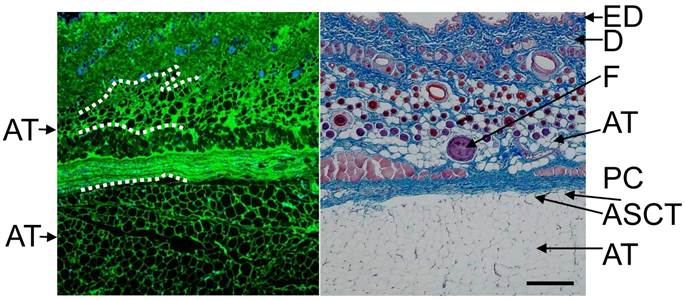
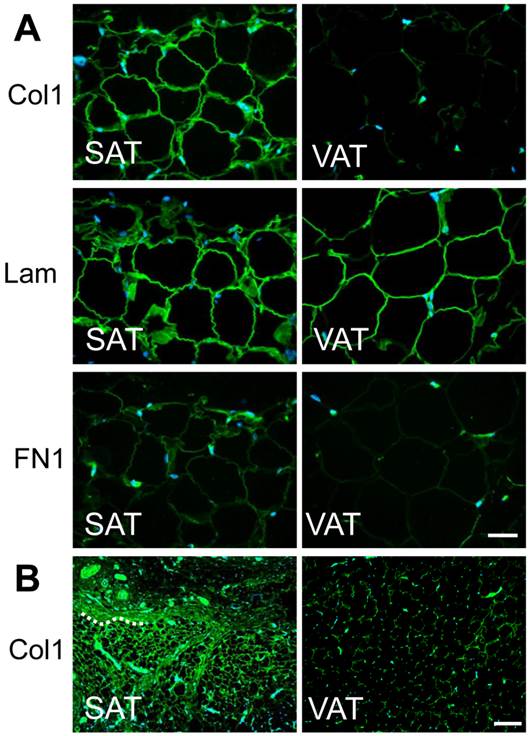
Typical histological images of a Masson's trichrome-stained and Col 1-stained section of skin are shown in Fig. 2. Adipocytes were distributed just beneath the dermis and deeper layer under the panniculus carnosus (PC). The latter layer formed subcutaneous fat pads outside of the abdominal wall. SAT as well as dermis had a developed collagenous matrix and showed markedly stronger signals of Col 1, enveloping each adipocyte (Fig. 3A). Col 1 was highly expressed and formed a fibrous structure (bundle) in SAT of adult animals (Fig. 3B). Definite signal of Lam was observed around adipocytes in SAT and VAT. FN1 signal was weak in the surrounding the adipocyte and comparatively abundant in the interstitium between cells.
Expression profiles of ECM and non-adipocyte markers in subcutaneous adipose tissue by DNA microarray. Signal strength was normalized and presented as the mean ± S.E.M. of four animals. Expression of CD45 (a stem cell marker), CD31 (an endothelial cell marker), Actn1 (a muscle marker) and F4/80 (a macrophage marker) were detected.
Typical histological image of rat skin. Skin of abdominal area was excised, fixed and immunohistochemically stained with anti-type I collagen (green) and counterstained with DAPI (blue), or stained with Masson's trichrome (right panel). A part of boundary between adipose tissue and neighboring tissue is presented by dashed line. Subcutaneous adipocytes exist just beneath the dermis and under panniculus carnosus (deep layer). ED: Epidermis, D: dermis, F: hair follicle, PC: panniculus carnosus, ASCT: areolar suprafascial connective tissue, AT: adipose tissue Scale bar: 200 μm.
Localization of major ECM in subcutaneous and visceral adipose tissue. A) Tissue specimens of abdominal skin (left panels) and epididymal fat (right panels) from 4 week-old rats were immunohistochemically stained with anti-type I collagen, anti-laminin, or anti-fibronectin antibody (green) and counterstained with DAPI (blue). Magnification: × 400 Scale bars: 50 μm. B) Images immunohistochemically stained with anti-type I collagen for 12 week-old rats. A part of boundary between adipose tissue and neighboring tissue is presented by dashed line. Magnification: × 100 Scale bars: 200 μm.
Adipose tissue development and ECM expression
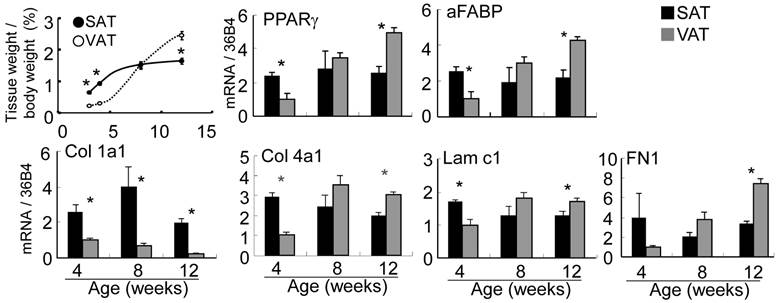
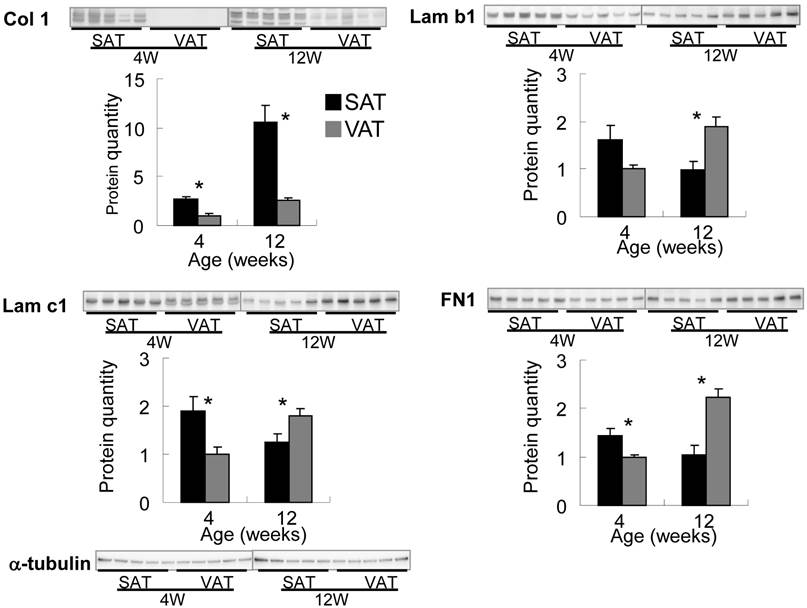
Subcutaneous fat pad of abdominal-inguinal skin was already organized at birth but of an insufficient volume to allow the quantitative expression analysis described below. Epididymal, retroperitoneal and perirenal fat as VAT were visually undetectable until 2-3 weeks after birth. The ratio of adipose tissue weight to body weight in SAT plateaued at 10-12 weeks of age, but the ratio in VAT markedly increased from 4 to 12 weeks of age (Fig. 4). The expression level of PPARγ, a master regulator of adipocyte differentiation, aFABP, an adipocyte differentiation marker, and the major ECM at 4 (immature stage), 8 and 12 (mature stage) weeks of age between SAT and VAT were quantitatively compared by real-time PCR. PPARγ expression level in SAT was maintained from 4 to 12 weeks of age; however, the level in VAT was markedly up-regulated in the latter stage and was correlated with histogenesis. Alteration of aFABP correlated with PPARγ in both tissues. Regarding major ECM-related genes (Fig. 4 and Supplementary Material: Fig. S1), higher expression level of Col 1a1, 3a1, and 5a1 in SAT than in VAT was maintained for up to mature stage. Col 1, 3, and 5 were defined “high-SAT expression type”. mRNA quantities of Col 4a1 and 15a1, Lam b1, and c1 and FN1 at 4 weeks of age in SAT were higher than or nearly equal to VAT, but these expressions in VAT became higher than in SAT depending on developmental stages. These molecules up-regulated at tissue specific timing were defined “histogenesis-correlated type”. Col 6a1 in SAT showed lower than or nearly equal level to VAT. The major ECM alteration was confirmed at the protein level by Western blot analysis (Fig. 5). The deposition of Col 1 protein was increased in matured SAT.
Adipose tissue weight ratio and gene expression of PPARγ, aFABP and major ECM molecules. Upper left panel is adipose tissue weight / body weight ratio (%) presented as the mean ± S.E.M. of five animals for each group. Other panels were quantified mRNA of interested gene normalized by 36B4. Relative values to VAT at 4 weeks of age are presented as the mean ± S.E.M. of five animals. *: p<0.05, compared with the value of the VAT
Differential expression of ECM proteins in adipose tissues by Western blotting. Quantified values were normalized by α-tubulin, and relative value to VAT in 4 week-old rats are presented as the mean ± S.E.M. of five animals. Each emphasized gel image corresponds to SAT and VAT at 4 weeks and at 12 weeks of age. *: p<0.05, compared with the value of the VAT.
ECM expression in cultured adipocytes
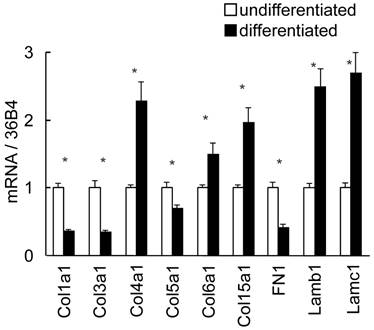
To discuss the in vivo regional differences and alteration of ECM expression, in vitro gene expression in adipocyte differentiation was investigated using 3T3-L1 cells (Fig. 6). Fibroblast-like preadipocytes could differentiate to mature adipocytes accompanied with marked up-regulation of the differentiation markers and increase of intercellular lipid accumulation (data not shown). Col 4a1 and 15a1, Lam b1 and c1 in histogenesis-correlated type ECM and Col 6a1 were significantly up-regulated in differentiated cells. Interestingly, the expression level of high-SAT expression type ECM, such as Col 1a1, 3a1 and 5a1, was high in undifferentiated cells, and decreased following cell differentiation. Differently to the in vivo expression pattern, FN1 in histogenesis-correlated type decreased following cell differentiation.
Differential expression of ECM in 3T3-L1 cells by real-time PCR. Quantified mRNA in undifferentiated and differentiated 3T3-L1 cells was normalized by 36B4. Relative values to undifferentiated level are presented as the mean ± S.E.M. of four wells for each condition. *: p<0.05, compared between undifferentiated and differentiated cells.
Discussion
Adipocyte differentiation and function have been studied using established cell lines as adipocyte models, but SAT and VAT can be anatomically distinguished. Regarding the differential character of these adipose tissues, risk of excessively accumulated intra-abdominal fat has been evidenced by many epidemiologic researches and molecular biologic studies; however, studies on specific functions and physiological role of SAT have not sufficiently advanced. In the present study, we identified that ECM expression is a SAT-characteristic fundamental function using comprehensive analysis. The functional gene clusters in VAT showed pertaining to the cell metabolism and responses to other extracellular signals, being consistent with previous reports [2]. ECM is an important multifunctional molecular group, which provides structural support to organs, modifies inter/extracellular signals, and regulates various cellular functions. In adipocytes or adipose tissues, expressions of Col 1, 4, 5, and 6, Lam, FN1, MMPs and their alteration during adipogenesis were partially reported [20-22], but their quantitative and qualitative characteristics had to be elucidated. We revealed ECM expression profiles and major molecules expressed in adipose tissues.
A main type of adipose ECM was the typical fibril-forming type collagens such as Col 1, 3, and 5, and microfibrillar Col 6. Col 1 is known to comprise a triple helix made up of subunits, being associated with other fibril-forming molecules, and is abundant in mammalian connective tissues, including dermis of the skin [15]. Furthermore, the histological and the detailed quantitative study showed the ECM expression characteristically changes in in vivo adipose tissue development and in in vitro adipogenesis. Consistent with previous studies using 3T3-L1 or 3T3-F442A preadipocytes [20-22], we confirmed in vitro remodeling from Col 1- and FN1-rich ECM in undifferentiated cells into basal membrane type-rich ECM in differentiated cells; however, our study found that in vivo SAT is generated in early developmental stage and continuously synthesizes fibril-forming collagens (“high-SAT expression type”) up to mature stage.
Importantly, our findings suggest that SAT is not just a storage site of excessive energy substrate, but actively produces ECM during tissue development, and it must play a fundamental role for maintenance of the biogenic morphology by fibrous network, which is composed of various collagens and laminin, connecting dermis and subdermal tissues (abdominal wall, skeletal muscle, bone, etc.) in a whole body.
Collagen amount is determined by the interactive balance of protein synthesis and proteolysis by proteases. As we confirmed heterogeneity of adipose tissues, Yoshimura K., et al. and Hauner H. have described the heterogeneity and estimated minor components of non-adipose cells including endothelial cells, macrophage and fibroblasts (lower than 1%) in adipose tissue [23, 24]. Since macrophage can enhance the expression of Col 1, Col 6 and MMPs in (pre)adipocytes [25], interaction of these non-adipose cells and adipocytes might affect the expression level and amount of ECM.
Regarding the collagenous ECM function in studies using collagenase knockout mice and fibrotic organs, it has been reported that rigid pericellular fibrous collagens restrict adipose tissue metabolism and adipogenesis [26-28], so the fibrous ECM is considered to be a negative effector of adipose function. We speculate that SAT in the adult stage sustains an inhibitory microenvironment for adipogenesis and adipose tissue enlargement, as shown in expression level of differentiation markers, more than VAT.
Many basal membrane-type molecules are defined “histogenesis/ adipogenesis-correlated type” ECM. Furthermore, we found the regional differences in the chronography of ECM remodeling in adipose tissue development, indicating that basal membrane-type molecules are upregulated at depot-specific timing. It has been reported that basal membrane-related ECM substrata, such as Matrigel and Myogel, are effective scaffolds or Lam-rich materials for adipose reconstruction [28-30]. The existence of remarkable basal membrane / basal laminae and their development strongly suggest the beneficial role in adipose tissue enlargement.
In addition to the major ECM molecules, minor collagens including proteoglycan-related molecules (Col 15, 16, and 18) were expressed in adipose tissue. These are “multiplexin” (multiple triple helix domains with interruptions) type or “FACIT” (fibril-associated collagen with interrupted triple helices) family collagens [15-17], and are suggested to act as a biological spring and to anchor large collagen fibrils to basal membrane. Expression of Col 15 as well as basal membrane type molecules was correlated to adipogenesis/tissue development. Furthermore, cartilage-specific collagens were expressed in SAT. Since mesenchymal stem cells and stem cells derived from SAT (ASC) can differentiate into a variety of cell types including cartilage [19], their utility for regeneration of damaged organs has received a lot of attention in recent years. Interestingly, an inconsistence of the expression pattern in vitro and in vivo was found in FN1. FN1 highly expressed in immature cells, as previously reported [20-22], but was up-regulated in adipose tissue development. The importance of these minor ECM and FN1 in adipose tissue has to be confirmed.
In obese state, adipocytes show excessive enlargement of their size (hypertrophy) and number (hyperplasia), differentially to casual tissue development in normal rats observed in the present study. Recent pathological study exhibited that obesity induces chronic inflammation in adipose tissue, secretion of inflammatory cytokines, and dysfunction of lipid and glucose metabolism in various organs including adipocytes, skeletal muscle and liver [2, 3]. In dietary-induced obese mice, Poussin C, et al. identified obesity-correlated gene groups such as metabolism and cytoskeleton [31], suggesting that these genes are highly responsive to nutritional status and hyperalimentation more than ECM-related genes. However, Adapala V, et al. reported that higher MMP2 expression in obese mice and elevated MMP9 activity in obese human may be involved in reduction of Col1 protein in adipose tissue [32]. Capability of plasminogen activation-related proteases to modulate adipogenesis of embryonic stem cells has been suggested [33], showing importance of adipose ECM alteration in tissue remodeling and physiological condition.
In conclusion, our studies offer an overview of the functional gene expression profiles in subcutaneous and visceral adipose tissues, and showed for the first time the regional specificity in adipose tissue development accompanied with qualitative and quantitative alteration of ECM. We found the early histogenesis and stable expression of fibrous ECM in SAT, and the depot specific timing of adipogenesis/histogenesis accompanied with the rapid up-regulation of basal membrane-related ECM. This result strongly suggests that these ECM molecules provide a unique and critical microenvironment around adipocyte itself and the contacted other tissues, and that they possibly be involved in the regulatory mechanism of cellular bioactivity via molecular signaling or physical-chemical factors. The next study step is to resolve the complex interaction with neighboring or remote tissues (adipose tissue-organ axis) via functional molecules including ECM receptors, MMPs and secreted factors. To elucidate the depot-specificity of functional differentiation and essential roles of adipocyte in subdermal region as well as intra-abdominal region is an important strategy to establish novel treatments for tissue regeneration and for improvement of unresolved disorders including dermal dysfunction and diabetes.
Supplementary Material
Fig.S1, Tables S1 - S3.
Conflict of interest
The authors have declared that no conflict of interest exists.
References
1. Farese RV Jr, Walther TC. Lipid droplets finally get a little R-E-S-P-E-C-T. Cell. 2009;139:855-860
2. Vázquez-Vela ME, Torres N, Tovar AR. White adipose tissue as endocrine organ and its role in obesity. Arch Med Res. 2008;39:715-728
3. Virtue S, Vidal-Puig A. Adipose tissue expandability, lipotoxicity and the Metabolic Syndrome - An allostatic perspective. Biochim Biophys Acta. 2010;1801:338-349
4. Ibuki A, Akase T, Nagase T. et al. Skin fragility in obese diabetic mice: possible involvement of elevated oxidative stress and upregulation of matrix metalloproteinases. Exp Dermatol. 2012;21:178-183
5. Vidal-Puig A. Gene expression in visceral and subcutaneous adipose tissue. Ann Med. 2001;33:547-555
6. van Harmelen V, Dicker A, Ryden M. et al. Increased lipolysis and decreased leptin production by human omental as compared with subcutaneous preadipocytes. Diabetes. 2002;51:2029-2036
7. Mori S, Nojiri H, Yoshizuka N. et al. Rapid desensitization of lipolysis in the visceral and subcutaneous adipocytes of rats. Lipids. 2007;42:307-314
8. Adams M, Montague CT, Prins JB. et al. Activators of peroxisome proliferator-activated receptor gamma have depot-specific effects on human preadipocyte differentiation. J Clin Invest. 1997;100:3149-3153
9. Kim J, Jung M, Kim H. et al. Adipose-derived stem cells as a new therapeutic modality for ageing skin. Exp Dermatol. 2011;20:383-387
10. Festa E, Fretz J, Berry R. et al. Adipocyte lineage cells contribute to the skin stem cell niche to drive hair cycling. Cell. 2011;146:761-771
11. Hidalgo L. Dermatologial complications of obesity. Am J Clin Dermatol. 2002;3:497-506
12. Irizarry A, Hobbs B, Collin F. et al. Exploration, normalization, and summaries of high density oligonucleotide array probe level data. Biostatistics. 2003;4:249-64
13. Huang D, Sherman B, Lempicki R. Systematic and integrative analysis of large gene lists using DAVID Bioinformatics Resources. Nature Protoc. 2009;4:44-57
14. Huang D, Sherman B, Lempicki R. Bioinformatics enrichment tools: paths toward the comprehensive functional analysis of large gene lists. Nucleic Acids Res. 2009;37:1-13
15. Gelse K, Pöschl E, Aigner T. Collagens-structure, function, and biosynthesis. Adv Drug Deliv Rev. 2003;55:1531-1546
16. Myers JC, Amenta PS, Dion AS. et al. The molecular structure of human tissue type XV presents a unique conformation among the collagens. Biochem J. 2007;404:535-544
17. Eble JA, Kassner A, Niland S. et al. Collagen XVI harbors an integrin alpha1 beta1 recognition site in its C-terminal domains. J Biol Chem. 2006;281:25745-25756
18. Smas CM, Sul HS. Control of adipocyte differentiation. Biochem J. 1995;309:697-710
19. Lin Y, Luo E, Chen X. et al. Molecular and cellular characterization during chondrogenic differentiation of adipose tissue-derived stromal cells in vitro and cartilage formation in vivo. J Cell Mol Med. 2005;9:929-939
20. Gregoire FM, Smas CM, Sul HS. Understanding adipocyte differentiation. Physiol Rev. 1998;78:783-809
21. 21 Divoux A, Clément K. Architecture and the extracellular matrix: the still unappreciated components of the adipose tissue. Obes Rev. 2011;12:e494-e503
22. Weiner FR, Shah A, Smith PJ. et al. Regulation of collagen gene expression in 3T3-L1 cells. Effects of adipocyte differentiation and tumor necrosis factor alpha. Biochemistry. 1989;28:4094-4099
23. Yoshimura K, Shigeura T, Matsumoto D. et al. Characterization of freshly isolated and cultured cells derived from the fatty and fluid portions of liposuction aspirates. J Cell Physiol. 2006;208:64-76
24. Hauner H. Secretory factors from human adipose tissue and their functional role. Proc Nutr Soc. 2005;64:163-169
25. Ward M, Adapala J, Adedokun S. et al. Dynamic changes in extracellular matrix gene regulation in adipose tissue and impact on preadipocyte proliferation and apoptosis. FASEB J. 2010;24:Meeting Abstract Suppl. 341.1
26. Huang G, Greenspan DS. ECM roles in the function of metabolic tissues. Trends Endocrinol Metab. 2012;23:16-22
27. Hotary KB, Allen ED, Brooks PC. et al. Membrane type I matrix metalloproteinase usurps tumor growth control imposed by the three-dimensional extracellular matrix. Cell. 2003;114:33-45
28. Chun TH, Hotary KB, Sabeh F. et al. A pericellular collagenase directs the 3-dimensional development of white adipose tissue. Cell. 2006;125:577-591
29. Abberton M, Bortolotto K, Woods AA. et al. Myogel, a novel, basement membrane-rich, extracellular matrix derived from skeletal muscle, is highly adipogenic in vivo and in vitro. Cells Tissues Organs. 2008;188:347-358
30. O'Connor C, Song H, Rosenzweig N. et al. Extracellular matrix substrata alter adipocyte yield and lipogenesis in primary cultures of stromal-vascular cells from human adipose. Biotechnol Lett. 2003;25:1967-1972
31. Poussin C, Hall D, Minehira K. et al. Different transcriptional control of metabolism and extracellular matrix in visceral and subcutaneous fat of obese and rimondant treated mice. PLos ONE. 2008;3:e3385
32. Adapala V, Adedokun S, Considine R. et al. Acute inflammation plays a limited role in the regulation of adipose tissue COL1A1 protein abundance. J Nutri Biochem. 2012;23:567-572
33. Hadadeh O, Barruet E, Peiretti F. et al. The plasminogen activation system modulates differently adipogenesis and myogenesis of embryonic stem cells. PLos ONE. 2012;7:e49065
Author contact
![]() Corresponding author: Shinobu Mori, Biological Science Laboratories, Kao Corporation, 2606 Akabane, Ichikai-Machi, Haga-gun, Tochigi, 321-3497, Japan. Tel: +81-285-68-7579 Fax: +81-285-68-7469 E-mail address: mori.shinobuco.jp.
Corresponding author: Shinobu Mori, Biological Science Laboratories, Kao Corporation, 2606 Akabane, Ichikai-Machi, Haga-gun, Tochigi, 321-3497, Japan. Tel: +81-285-68-7579 Fax: +81-285-68-7469 E-mail address: mori.shinobuco.jp.

 Global reach, higher impact