Impact Factor ISSN: 1449-2288

 Global reach, higher impact
Int J Biol Sci 2016; 12(2):144-155. doi:10.7150/ijbs.13382 This issue Cite
Research Paper
Nucleophosmin Mutants Promote Adhesion, Migration and Invasion of Human Leukemia THP-1 Cells through MMPs Up-regulation via Ras/ERK MAPK Signaling
Jingrong Xian1, Huiyuan Shao2, Xianchun Chen3, Shuaishuai Zhang1, Jing Quan1, Qin Zou1, Hongjun Jin1, Ling Zhang1, ![]()
1. Key Laboratory of Laboratory Medical Diagnostics Designated by the Ministry of Education, College of Laboratory Medicine, Chongqing Medical University, Chongqing, China
2. Department of clinical laboratory, Yantai Yuhuangding Hospital, Shandong, China
3. Department of clinical laboratory, People's hospital of Ganzhou, Jiangxi, China
Received 2015-7-29; Accepted 2015-11-26; Published 2016-1-1
Abstract

Acute myeloid leukemia (AML) with mutated nucleophosmin (NPM1) has been defined as a unique subgroup in the new classification of myeloid neoplasm, and the AML patients with mutated NPM1 frequently present extramedullary infiltration, but how NPM1 mutants regulate this process remains elusive. In this study, we found that overexpression of type A NPM1 gene mutation (NPM1-mA) enhanced the adhesive, migratory and invasive potential in THP-1 AML cells lacking mutated NPM1. NPM1-mA had up-regulated expression and gelatinolytic matrix metalloprotease-2 (MMP-2)/MMP-9 activity, as assessed by real-time PCR, western blotting and gelatin zymography. Following immunoprecipitation analysis to identify the interaction of NPM1-mA with K-Ras, we focused on the effect of NPM1-mA overexpression on the Ras/Mitogen-activated protein kinase (MAPK) signaling axis and showed that NPM1-mA increased the MEK and ERK phosphorylation levels, as evaluated by western blotting. Notably, a specific inhibitor of the ERK/MAPK pathway (PD98059), but not p38/MAPK, JNK/MAPK or PI3-K/AKT inhibitors, markedly decreased the cell invasion numbers in a transwell assay. Further experiments demonstrated that blocking the ERK/MAPK pathway by PD98059 resulted in reduced MMP-2/9 protein levels and MMP-9 activity. Additionally, NPM1-mA overexpression had down-regulated gene expression and protein production of tissue inhibitor of MMP-2 (TIMP-2) in THP-1 cells. Furthermore, evaluation of gene expression data from The Cancer Genome Atlas (TCGA) dataset revealed that MMP-2 was overexpressed in AML patient samples with NPM1 mutated and high MMP-2 expression associated with leukemic skin infiltration. Taken together, our results reveal that NPM1 mutations contribute to the invasive potential of AML cells through MMPs up-regulation via Ras/ERK MAPK signaling pathway activation and offer novel insights into the potential role of NPM1 mutations in leukemogenesis.
Keywords: acute myeloid leukemia, invasion, nucleophosmin, gene mutation, MMPs, ERK/MAPK
Introduction
Acute myeloid leukemia (AML) is the most common malignant myeloid disorder in adults, accounting for the largest number of annual deaths from leukemia [1]. One third of AMLs are characterized by nucleophosmin (NPM1) gene mutations [2]. Several evidences pointed to NPM1-mutated AML with distinctive genetic, pathological and clinical features, which led to the introduction of AML with mutated NPM1 as a new leukemia entity in the 2008 World Health Organization (WHO) classification of myeloid neoplasms [3]. AML with NPM1 mutations was significantly related with higher extramedullary involvement frequencies, which was mostly responsible for gingival hyperplasia and lymphadenopathy [4]. Leukemic infiltration contributed to disease progression, minimal residual disease, tumor cell quiescence and relapse [5]; however, the mechanism(s) responsible for the infiltration activity of AML with mutated NPM1 remains largely unknown.
The NPM1 gene is located on 5q35.1 and contains 12 exons. NPM1 is an extensively expressed phosphoprotein belonging to the nucleoplasmin family of chaperones, which is mainly localized in the nucleolus and shuttles constantly between the nucleolus and cytoplasm and regulates ribosome biogenesis and transport as well as centrosome duplication [6]. The NPM1 wild type (NPM1-wt) gene is frequently involved in chromosomal translocations or mutations and is associated with the development of leukemia or lymphoma [7]. Mutated NPM1 disrupts the C-terminal nucleolar localization signal (NLS) of nucleophosmin and generates a new nuclear export signal (NES), which alters the normal balance in nuclear-cytoplasmic NPM1 shuttling and causes the characteristic cytoplasmic localization [8]. In 2005, Falini B et al. [9] first observed cytoplasmic nucleophosmin (NPMc+) in AML and reported that the type A NPM1 mutation (NPM1-mA, 4 base TCTG insertion) was the most frequent in adults (75-80% of cases). NPMc+ AMLs show a wide FAB morphologic spectrum and frequent multilineage involvement [10]. Strikingly, NPM1 mutations are mutually exclusive with recurrent AML-associated chromosome rearrangements and frequently are associated with a normal karyotype [11]. All of the available data on NPMc+ AML point at a crucial role of the NPM1 mutated protein in leukemogenesis [12]. Mutated NPM1 causes cytoplasmic delocalization and degradation of ARF and Fbw7, which attenuates a tumor-suppressor pathway (p53-ARF) [13] and enhances an oncogenic one (MYC) [14]. Recently, Lo-Coco F et al. [15] demonstrated that NPMc+ controlled tumor suppressors protein PTEN deubiquitination and trafficking through a physical interaction with HAUSP. On the other hand, it was reported that the cytoplasmic NPM1 mutant could directly interact with caspase-6 and -8, which protected from death ligand-induced cell death and suppressed caspase-6/-8-mediated myeloid differentiation [16]. Nevertheless, the oncogenic potential of NPM1 mutants has never been established. Notably, its role in the invasive behavior of leukemic cells in AML has not yet been elucidated.
Our previous study found that a NPM1 mutant could promote the migration and invasion of NIH3T3 cells in vitro [17]. Alcalay M et al. [18] reported that AMLs bearing NPMc+ displayed a specific gene expression profile that was characterized by up-regulation of genes that are involved in stem-cell maintenance and increased expression of matrix metalloproteinase-2 (MMP-2). Matrix metalloproteinases (MMPs) play an important role in tumor metastasis, through the capacity to degrade extracellular matrix (ECM) components and to allow cells to traverse the protein fibers of the ECM to reach distant target sites [19]. It was reported that MMP-2 and MMP-9 that were secreted by leukemic cells increased blood-brain barrier permeability by disrupting tight junction proteins, which contributed to the invasion of leukemic cells to the central nervous system (CNS) [20]. MMP regulation includes at least three different levels: transcriptional regulation, activation and inhibition. Mitogen-activated protein kinases (MAPKs) and the phosphoinositide 3-kinase (PI3-K)/AKT pathways are the essential upstream signaling pathways that activate MMP expression [21]. As is known, the mammalian family of MAPKs consists of extracellular signal-regulated kinase (ERK), p38 and c-jun NH2-terminal kinase (JNK). The activated ERK/MAPK pathway can increase MMP-9 expression and enhance B-cell chronic lymphocytic leukemia cell invasion and migration [22]. In contrast, MAPK pathway inhibition by caffeine was shown to reduce MMP-2 and MMP-9 expression and attenuate invasion of human leukemia U937 cells [23]. In addition, the MMPs activity is also regulated by a group of endogenous tissue inhibitors of MMPs (TIMPs) [24]. Hence, it is necessary to elucidate the molecular mechanisms through which NPM1 mutations might regulate MMP activity and alter leukemic cells invasion.
In this study, we found that NPM1-mA could enhance the adhesive, migratory and invasive potential of THP-1 leukemia cells in vitro. Notably, NPM1-mA increased the expression and activity of MMP-2/9. At the molecular level, NPM1-mA interacted with K-Ras and activated MEK/ERK signaling. A specific inhibitor of the ERK/MAPK pathway (PD98059) reduced MMP-2/9 expression and impaired the cells invasion activity. Additionally, NPM1-mA had down-regulated the TIMP-2 gene expression and protein production. Furthermore, increased MMP-2 mRNA expression was also found in AML patient samples with NPM1 mutation in The Cancer Genome Atlas (TCGA) dataset and associated with skin infiltration. This is the first report providing evidence that NPM1 mutations are involved in the invasion phenotype of AML and explain the potential molecular mechanism in this process.
Methods
Cell cultures
Human monocytic leukemia THP-1 cells (purchased from Shanghai Institutes for Biological Sciences) were maintained in RPMI-1640 medium (Gibco, MD, USA), which was supplemented with 10% fetal bovine serum (FBS, Gibco, MD, USA) and 100 U of penicillin and streptomycin (Sangon Biotech, Shanghai, China) in a 5% CO2-humidified incubator at 37 °C.
The PCR primer sequences for each gene.
| Genes | Forward primer | Reverse primer |
|---|---|---|
| NPM1-mA | TGGAGGTGGTAGCAAGGTTC | CTTCCTCCACTGCCAGACAGA |
| MMP-2 | AGATCTTCTTCTTCAAGGACCGGTT | GGCTGGTCAGTGGCTTGGGGTA |
| MMP-9 | TCCCTGGAGACCTGAGAACC | GGCAAGTCTTCCGAGTAGTTT |
| TIMP-1 | GGGACACCAGAAGTCAACCA | GGCTTGGAACCCTTTATACATC |
| TIMP-2 | AAGCGGTCAGTGAGAAGGAA | TCTCAGGCCCTTTGAACATC |
| β-actin | TTCGAGCAAGAGATGGCCA | TACATGGTGGTGCCGCC |
Plasmids and cell transfection
pEGFPC1-NPM1-mA, pEGFPC1-NPM1-wt and empty pEGFPC1 were kindly provided by Dr. Falini B (Institute of Hematology, University of Perugia, Perugia, Italy). THP-1 cells were transfected with either pEGFPC1-NPM1-mA, pEGFPC1-NPM1-wt or pEGFPC1 vector using the xfectTM reagent (Clontech, USA) according to the manufacturer's instructions, and they were named the “NPM1-mA”, “NPM1-wt” and “pEGFPC1” groups. The “untreated” group represented THP-1 cells without transfection. Stable cell lines were selected and maintained in G418 (Invitrogen, MD, USA). Numerous independent single colonies were subcloned and analyzed for mRNA expression with RT-PCR and for protein expression with immunocytochemistry staining.
Reverse transcription PCR (RT-PCR) and quantitative real time PCR (qRT-PCR)
Reverse transcription PCR (RT-PCR) was operated as follows: the total RNA of cells was extracted with TRIzol reagent (TaKaRa, Tokyo, Japan). Then, 2 micrograms of total RNA that was treated with DNA-free DNase were reverse-transcribed for cDNA synthesis. The amplification conditions were: 5 min at 94 °C (one cycle) and 30 sec at 94 °C; 30 sec at the annealing temperature of 55 °C; and 50 sec at 70 °C (35 cycles) and 72 °C for 10 min (one cycle). The amplification productions for NPM1-mA and β-actin were confirmed by 1.5% agarose gel electrophoresis. Quantitative real-Time PCR (qRT-PCR) analysis was performed on a MJ Mini™ Gradient Thermal Cycler Real-Time PCR machine (Bio-Rad, California, USA) with the SYBR Green reaction (TaKaRa, Tokyo, Japan) kit in triplicate. PCR amplification mixtures (25 μl) contained 12.5 μl of SYBR Green reaction, 2 μl of a mixture of 2.5 mM reverse and forward primers, 8.5 μl of nuclease free water and 2 μl of cDNA template. The MMP-2/9 and TIMP-2/1 gene expression levels were analyzed relative to the β-actin gene transcript levels. The primer sequences are listed in Table 1.
Immunocytochemistry staining
Immunostaining was performed based on the alkaline phosphatase monoclonal anti-alkaline phosphatase (APAAP) technique. Approximately 1×10⁵ cells were cytocentrifuged onto a clean glass slide, then fixed with 4% paraformaldehyde for 30 min, permeabilized with 0.25% cold triton for 15 min and incubated with 1% bovine serum albumin (Sigma, MO, USA) in PBS for 1 h at room temperature for blocking. After washing with 0.01 M PBS three times, anti-NPM1 monoclonal antibody (Inc. Santa Cruz, CA, USA) was added at a concentration of 1:100. The slides were incubated overnight at 4°C. The detection steps were performed according to the manufacturer's (ZhongShan Goldenbridge Biotechnology, China) instructions. The presence of the NPM1 mutant protein was assessed by examining the cytoplasmic distribution of red precipitate particles.
Cell proliferation assay
Cells were seeded into 96-well plates (Corning, NY, USA) in triplicate at a density of 1×10³ cells per well with RPMI-1640 containing 10% FBS. The cell number was quantified at days 0 (day of seeding), 1, 2 and 3 with the Cell Counting Kit-8 (CCK-8, Dojindo, Japan) assay, and the cell growth curves were plotted with the cell number values as ordinate and time as abscissa. Each experiment was performed in triplicate.
Cell adhesion assay
The cells were harvested and washed three times with serum-free medium, re-suspended in serum-free medium and seeded at 1,000 cells/well on a 96-well plate (Corning, NY, USA) that was coated with fibronectin (Sigma, MO, USA) in triplicate. After being cultured at 37 °C for 1 h, the non-adherent cells were washed away with PBS. Then, a methyl thiazolyl tetrazolium solution (2.5 mg /ml) (MTT; Sigma, MO, USA) was added into each well and cultured for 4 h at 37°C, 5% CO2 atmosphere. After incubation, the MTT solution was replaced with 150 μl DMSO (Sigma, MO, USA), and then the conversion of MTT into DMSO-soluble formazan by the living cells was quantified by measuring the absorbance at 490 nm with a spectrophotometer. The relative ratio of cell adhesion = (the absorbance of the experiment group/the absorbance of the untreated group) ×100%. Each experiment was performed in triplicate.
Cell migration assay
Transwell chambers (0.8 μm pore size; Corning, NY, USA) that were inserted in 24-well tissue culture plates were used for detecting the cell migration and invasion. For the migration assay, the upper compartment was filled with 5×10⁴ cells in 200 μl serum-free RPMI 1640 and the lower compartment was filled with 500 μl RPMI 1640 containing 15% FBS. After they were cultured at 37 °C for 24 h, the cells that had migrated to the lower chambers were counted using an inverted microscope. The experiments were performed in triplicate.
Cell invasion assay
The invasion assay was performed in the same manner as the migration assay, but a Matrigel coating (BD systems, San Jose, CA, USA) was used. THP-1 cells with NPM1-mA were treated with different signaling pathway inhibitors for 24 h and the cells were detected for their invasive ability. The experiments were performed in triplicate.
Western blotting
The cultured cells were washed and lysed in cell extraction buffer; a total of 50 μg of protein was loaded into a sodium dodecyl sulfate polyacrylamide gel for electrophoresis and transferred onto PVDF membranes. Blocking and antibody incubation were performed in 5% low-fat dry milk, followed by washing in Tris-buffered saline (TBS) (10 mM Tris-HCl pH 8, 150 mM NaCl) containing 0.1% Tween20 (TBS-T). The obtained autoradiograms were scanned and exported for densitometry analysis. NPM1, MMP-2/9, TIMP-2/1, K-Ras, ERK, p-ERK, MEK and p-MEK monoclonal antibodies (Inc. Santa Cruz, CA, USA) were used at 1:500 dilutions. NPM1-mA monoclonal antibody (Abcam, UK) was added at a concentration of 1:1,000. Moreover, a β-actin monoclonal antibody (Inc. Santa Cruz, CA, USA) was used at 1:1,000 dilution. Protein expression quantification was normalized against the β-actin protein expression using image software.
The ERK inhibitor, PD98059, and the PI3-K/AKT inhibitor, LY294002, were purchased from Promega (Madison, USA). The p38 inhibitor, SB203580, and the c-JNK inhibitor, SP600125, were purchased from Cell Signaling Technology (Boston, USA) and Sigma (MO, USA), respectively. MAPKAPK-2, p-MAPKAPK-2, c-jun, p-c-jun, AKT and p-AKT monoclonal antibodies (Inc. Santa Cruz, CA, USA) were used at 1:500 dilutions. THP-1 cells with NPM1-mA were treated with different concentrations of pathway inhibitors for 24 h and harvested for western blotting.
Immunoprecipitation analysis
Cells were lysed with radioimmunoprecipitation assay (RIPA) lysis buffer in the presence of a protease inhibitor cocktail (Roche). Equal amounts of cell lysates were then incubated with nickel beads with the indicated antibodies for 3 h, washed and subjected to immunoblotting analysis. Specific protein bands were detected using primary antibodies and HRP-conjugated secondary antibodies and then followed by the ECL system.
Gelatin zymography assay
The cell supernatants were collected and were mixed with sample buffer without a reducing agent or heating. The sample was loaded into a gelatin-containing (1 mg/mL) SDS-PAGE gel and electrophoresed with constant voltage. Next, the gel was washed with 2.5% Triton X-100 to remove the SDS and then incubated overnight at 37 °C in the incubation buffer (50 mM Tris-HCl [pH 7.5], 5 mM CaCl2, 1 μM ZnCl2 and 0.05% NaN3). The gel was stained with 0.25% Coomassie blue and photographed on a light box. Proteolysis was detected as a white zone in a dark blue field.
Analysis of gene expression data in TCGA AML dataset
The RNA-seq data were publicly available from the TCGA website (https://tcga-data.nci.nih.gov/tcga/). A total of 165 AML patients stratified by leukemia French American British (FAB) morphology classification were included and 48 AMLs with NPM1 mutation were obtained from TCGA 2013 human AML dataset. Clinical data and MMPs mRNA expression data for AML samples were collected from the TCGA and analyzed using the cBioPortal for Cancer Genomics [25, 26]. For statistical analysis, MMP mRNA expression was compared between the AMLs with NPM1 mutation and those with no NPM1 mutation. Furthermore, MMP mRNA expression was also compared between the AML patients with skin infiltration and AML patients without it.
Statistical analysis
Results were presented as the means± SE for a minimum of three different determinations, and quantitative data from the cell proliferation, adhesion, migration, invasion, western blot analysis and qRT-PCR assays were evaluated for statistical significance using the one-way ANOVA test. Wilcoxon rank sum test analysis was used to compare clinical data. For all tests, values of p< 0.05 were regarded as statistically significant. The SPSS (Version 13.0) software was used for statistical analyses.
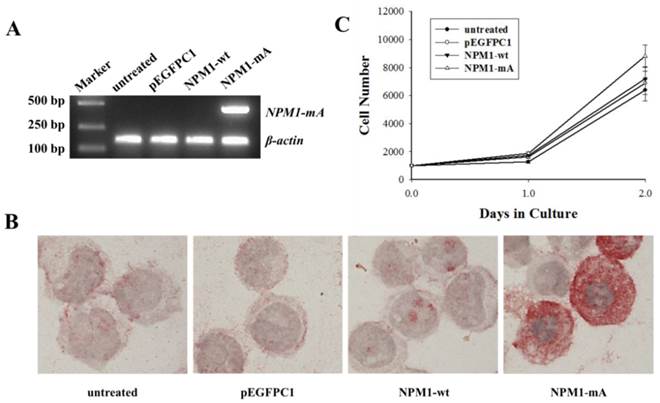
NPM1-mA mRNA and protein expression and THP-1 cell growth levels after NPM1-mA transfection. (A) The NPM1-mA mRNA expression level was determined by RT-PCR. The cells in the NPM1-mA group expressed NPM1-mA mRNA, but it was not expressed in the NPM1-wt, pEGFPC1 and the untreated groups. (B) Immunocytochemistry staining was performed to evaluate the cytoplasmic localization of NPM1-mA protein (NPMc+). NPMc+ cells were observed in the NPM1-mA group. Three independent experiments were performed and an example of this localization is shown. (C) The cell proliferation potential was evaluated by the cell growth curve. Cell numbers in the four groups were quantified on days, 0, 1 and 2 with a CCK-8 assay. NPM1-mA had no significant effect on cell growth within 2 days (p>0.05). Three independent experiments were performed.
Results
NPM1-mA promoted adhesion, migration and invasion of THP-1 cells
First, we established THP-1 AML cells with stably ectopic NPM1-mA expression. To identify whether NPM1-mA was expressed in leukemia cells after it was transfected with pEGFPC1-NPM1-mA, RT-PCR was performed to detect the NPM1-mA mRNA expression. The results showed that the cells in the NPM1-mA group could express NPM1-mA mRNA (Fig. 1A), while the cells belonging to the three control groups could not. Additionally, the immunocytochemistry staining results demonstrated the NPM1 mutant protein remained restricted to the cytoplasm in the NPM1-mA group by the presence of red precipitate particles (Fig. 1B). There was negative staining of cells in the NPM1-wt, pEGFPC1 and the untreated groups. These data indicated that leukemia cells with NPM1-mA were successfully established. Furthermore, to determine whether NPM1-mA had an influence on cellular proliferation in vitro, THP-1 cell proliferation was evaluated with the CCK-8 assay. As shown in Fig. 1C, there was no significant cell number differences between the NPM1-mA group and each of the control groups (p>0.05, respectively). Therefore, transfection with NPM1-mA had no effect on cellular growth within 2 days.
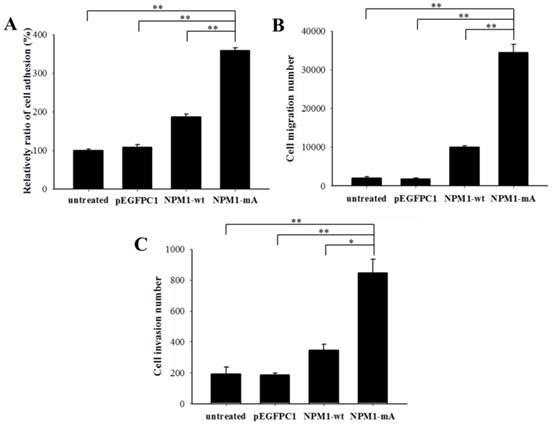
Next, we investigated the invasive potential of leukemia cells with NPM1-mA in vitro by adhesion, migration and invasion assays. As shown in Fig. 2A, the relative ratio of cell adhesion in the NPM1-mA group was significantly higher than that in the NPM1-wt, pEGFPC1 and the untreated groups (p<0.01, respectively). The migration assay indicated that the cell number in the lower chambers of the NPM1-mA group was notably higher than that in the control groups (p<0.01, Fig. 2B). The invasion assay indicated that in the NPM1-mA group, the number of invasive cells in the lower chambers with Matrigel was significantly higher than that of the three control groups (p<0.01, Fig. 2C). These results suggested that NPM1-mA could contribute to the invasion phenotype of leukemia cells.
NPM1-mA increased the MMP-2/9 expression and activity levels in THP-1 cells
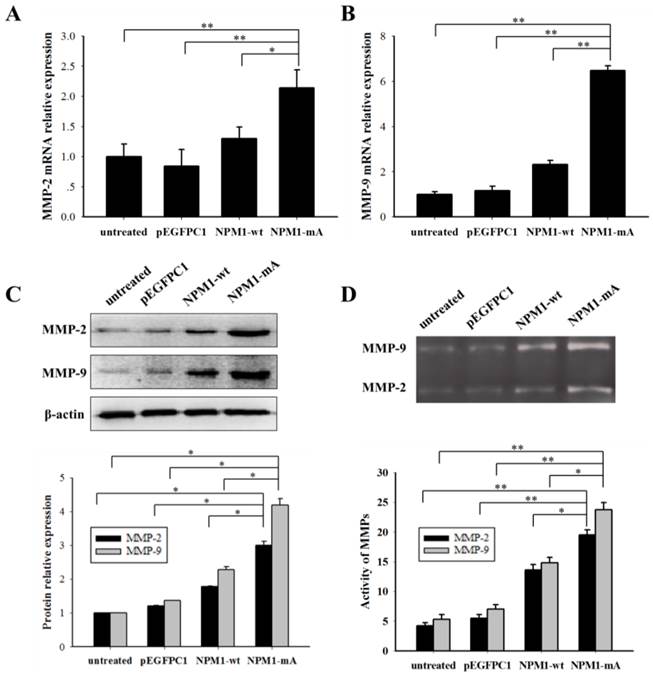
It is well known that MMP-2/9 contributes to leukemia cell invasion. We determined the MMP-2/9 expression and activity levels in THP-1 cells with NPM1-mA. The MMP-2/9 mRNA expression levels in the NPM1-mA group were significantly higher compared with the NPM1-wt, pEGFPC1 and the untreated groups (p<0.01 Fig. 3A, 3B). No notable difference was observed between the control groups. Additionally, a western blotting assay showed that the MMP-2/9 protein levels in the NPM1-mA group were significantly increased compared with the other three control groups (Fig. 3C). Next, the gelatin zymography results indicated that the MMP-2/9 enzymatic activity in the NPM1-mA group were significantly higher than that in the NPM1-wt, pEGFPC1 and untreated groups (p<0.05), and no notable difference was observed between these control groups (Fig. 3D) (p>0.05). These results demonstrated that NPM1-mA increased the MMP-2/9 mRNA and protein expression levels and their enzymatic activities in leukemia cells.
The Ras/ERK MAPK pathway was involved in the invasiveness of THP-1 cells with NPM1-mA overexpression
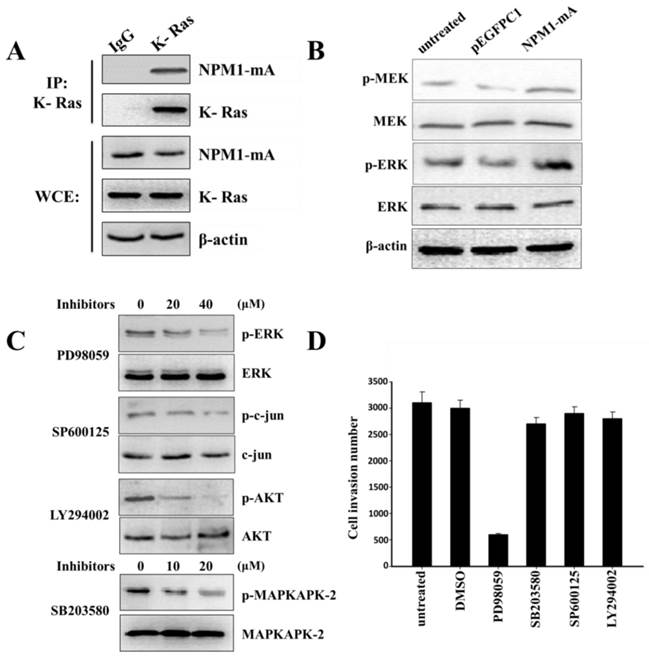
MMP-2/9 expression regulation occurs through several signaling cascades, including the MAPK and PI3-K/AKT signaling pathways. NPM1-wt can interact with K-Ras and regulate ERK/MAPK signal transduction [27]. To confirm that NPM1-mA could also interact with K-Ras, we performed an immunoprecipitation assay to affirm the interaction between NPM1-mA and K-Ras in THP-1 cells. As shown in Fig. 4A, anti-K-Ras antibodies, but not a non-specific IgG control (negative control), selectively bound to NPM1-mA. Furthermore, we found that NPM1-mA increased the MEK and ERK phosphorylation levels (Fig. 4B). Given that K-Ras has specific signaling that is upstream of the ERK/MAPK, p38/MAPK, JNK/MAPK and PI3-K/AKT pathways other signaling pathways besides ERK/MAPK might be involved in cell invasion; therefore, the THP-1 cells with NPM1-mA were treated with four signaling pathway inhibitors. We found that PD98059 (40 µM) could decrease the p-ERK levels, SB203580 (20 µM) could decrease the p-MAPKAPK-2 levels, SP600125 (40 µM) could decrease the p-c-jun levels and LY294002 (20 µM) could decrease the p-AKT levels (Fig. 4C). Next, we examined the pharmacologic inhibition of these pathways with regard to cell invasion. As shown in Fig. 4D, the cell invasion numbers in the PD98059 group significantly decreased compared with the untreated and DMSO groups (p<0.01); however, no significant reduction was found in the other inhibitors groups. These consequences indicated that the Ras/ERK MAPK signaling pathway was involved in the invasion of the THP-1 cells with NPM1-mA overexpression.
NPM1-mA expression promoted adhesion, migration and invasion of THP-1 cells. (A) A cell adhesion assay was performed to test the adhesion ability of the cells. The cells were counted with an MTT assay. The quantified cellular adhesion results were normalized to control cells and are represented as percentages. The relative ratio of the NPM1-mA group was significantly increased compared with the three control groups (p<0.01). (B) Transwell chambers inserted in 24-well tissue culture plates were used for detecting cell migration. The cell numbers of the NPM1-mA group were notably higher than the numbers observed in the NPM1-wt, pEGFPC1 and untreated groups (p<0.01). (C) Transwell chambers with a Matrigel coating were used to test the invasion ability of the cells. Cells that had invaded through the transwell membrane were quantified by counting. The number of invasive cells in the NPM1-mA group was significantly higher than that of the three control groups (p<0.01). Three independent experiments were performed. *p<0.05 vs. control, **p<0.01 vs. controls.
NPM1-mA expression promoted MMP-2/9 mRNA and protein expression levels and their activities in THP-1 cells. (A-B) The MMP-2/9 mRNA levels were determined using qRT-PCR and the MMP-2/9 mRNA levels in the NPM1-mA group were higher than that in the three control groups (p<0.01). (C) Protein levels were determined using western blotting and the MMP-2/9 protein levels in the NPM1-mA group were enhanced compared with the three control groups. All the proteins were quantified using image software and normalized against β-actin. (D) The MMP-2/9 activities were tested with a gelatin zymography assay. The MMP-2/9 enzymatic activities in the NPM1-mA group were significantly higher than that in the NPM1-wt, pEGFPC1 and untreated groups (p<0.05). Three independent experiments were performed. *p<0.05 vs. control, **p<0.01 vs. control.
ERK/MAPK inhibition reduced the MMP-2/9 expression and activity levels in THP-1 cells with NPM1-mA overexpression
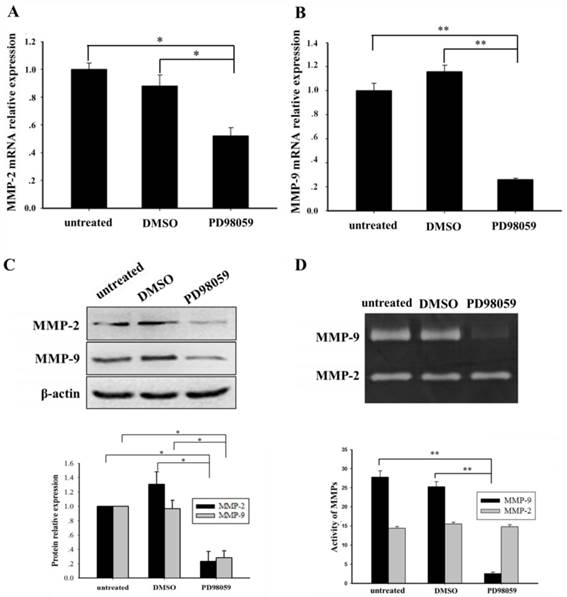
We further investigated whether blocking the ERK/MAPK pathway influenced MMP-2/9 expression and activity. An ERK/MAPK inhibitor (PD98059, 40 µM) was used to treat the THP-1 cells that had NPM1-mA overexpression for 24 h. Compared with the DMSO and untreated groups, the significantly decreased MMP-2/9 mRNA levels (MMP-2, p<0.05; MMP-9, p<0.01) were confirmed in the PD98059 group (Fig. 5A, 5B). Additionally, western blotting showed a significant decrease of MMP-2/9 protein in the PD98059 group (Fig. 5C). Furthermore, the gelatin zymography assay displayed that the MMP-9 activity was significantly decreased in the PD98059 treated group compared with the other control groups (p<0.01); however, no significant difference in MMP-2 activity was observed amongst the three groups (p>0.05, Fig. 5D). These results indicated that the MMP-2/9 mRNA and protein expression levels and the MMP-9 activity might be regulated by the ERK/MAPK signaling pathway in the THP-1 cells that had NPM1-mA overexpression.
NPM1-mA decreased the TIMP-2 expression levels in THP-1 cells
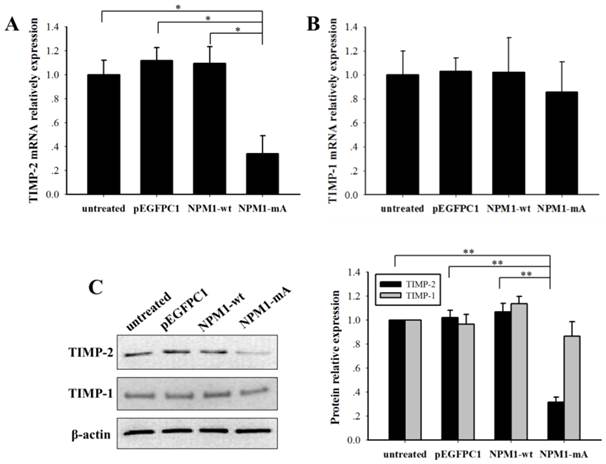
The MMPs activity is regulated by tissue inhibitors of metalloproteinases (TIMPs). To explore the role of NPM1-mA in the expression of TIMPs in THP-1 leukemia cells, we analyzed the TIMP-2/1 mRNA and protein expression levels. TIMP-2 mRNA in the NPM1-mA group had a lower expression level compared with the other three control groups (p<0.01, Fig. 6A), TIMP-1 mRNA had no significant difference among four groups (p>0.05). And the western blotting proved a significant reduction of TIMP-2 protein levels in the NPM1-mA group (Fig. 6B), whereas there was not a distinctly difference in the TIMP-1 protein levels among four groups (Fig. 6C). These consequences indicated that NPM1-mA overexpression down-regulated TIMP-2 mRNA and protein expression levels in THP-1 cells.
High MMP-2 expression in primary AMLs with NPM1 mutation and associated with skin infiltration
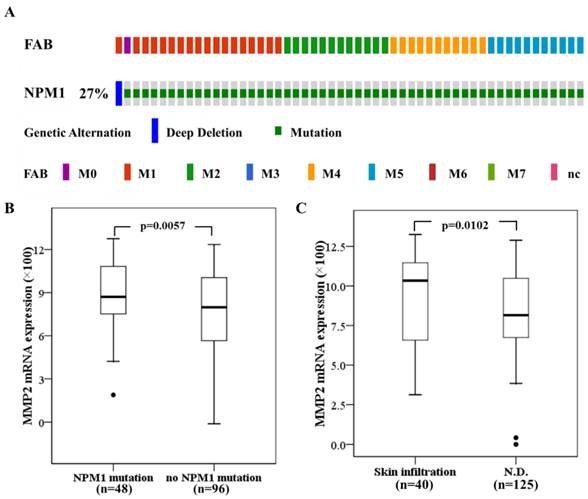
Next we investigated the significance of MMPs expression in primary human AML with NPM1 mutation. The 165 fully annotated human AML samples from TCGA were queried for NPM1 and NPM1 mutation was seen in a subtype of M0, M1, M2, M4 and M5 samples excluded M3, M6 and M7 (Fig. 7A). Then we accessed the RNA-Seq data for 48 TCGA AMLs with NPM1 mutation through cBioPortal. The MMP-2 mRNA expression levels were significantly elevated in the AMLs with NPM1 mutation compared with those with no NPM1 mutation (p= 0.0057, Fig. 7B), whereas high MMP-9 expression was not observed in the AMLs with NPM1 mutation (Data not show). Furthermore, to determine whether MMP-2 expression was associated with extramedullary involvement in primary human AML, clinical data for 165 AMLs from the TCGA were assessed. MMP-2 expression levels were significantly increased in AML cases with skin infiltration compared with controls (p=0.0102, Fig. 7C).
The Ras/ERK MAPK pathway was involved in the invasion of THP-1 cells with NPM1-mA overexpression. (A) The NPM1-mA interaction with K-Ras was determined by an immunoprecipitation assay with THP-1 cells that ectopically expressed NPM1-mA. There was a clear band in the K-Ras group, but not in the negative control group (IgG group). The experiments were repeated three times, and a representative blot is shown. (B) Western blotting showed that NPM1-mA overexpression increased the MEK and ERK phosphorylation levels. (C) Western blotting results showed a dose-dependent reduction of p-ERK by the ERK/MAPK inhibitor, PD98059, a reduction of p-c-jun by the JNK/MAPK inhibitor, SP600125, a reduction of p-AKT by the PI3-K/AKT inhibitor, LY294002 and a reduction of p-MAPKAPK-2 by the p38/MAPK inhibitor, SB203580. (D) Cell invasion was tested after THP-1 cells with NPM1-mA were treated with PD98059 (40 µM), SB203580 (20 µM), SP600125 (40 µM), LY294002 (20 µM). The DMSO group, the solvent that was used for these inhibitors, and an untreated group were used a controls in this experiment. The cell invasion numbers were significantly decreased in the cell group that was treated with PD98059 (p<0.01). Data are expressed as the means ± SEM of at least 3 independent experiments. **p<0.01 vs. control.
The ERK inhibitor, PD95089, affected the expression and activity of MMP-2/9 in THP-1 cells with NPM1-mA overexpression. (A-B) The MMP-2/9 mRNA levels were detected with real time qRT-PCR in the three groups. Decreased MMP-2/9 mRNA was observed in the PD98059 group (MMP-2, p<0.05; MMP-9, p<0.01). (C) MMP-2/9 protein levels were detected by western blotting in the three groups. All the proteins were quantified using image software and normalized against β-actin. A decrease in the MMP-2/9 protein levels was observed in the PD98059 group. (D) The MMP-2/9 protein activity was tested with a gelatin zymography assay in the three groups. The MMP-9 activity was significantly decreased in the PD98059 group compared with the other control groups (p<0.01); however, MMP-2 was not significantly different amongst the three groups (p>0.05). Data are expressed as the means ± SEM of at least 3 independent experiments. *p<0.05 vs. control, **p<0.01 vs. control.
Discussion
NPM1 plays key roles in the regulation of multiple cellular functions. As the most frequent genetic abnormality in AML, NPM1 mutations have been linked to leukemogenesis. Although clinical manifestations of extramedullary infiltration frequently occur in AML patients with NPM1 mutations, how NPM1 mutations regulate the invasive potential of leukemia cells is largely unknown. Here, we showed that NPM1-mA promoted leukemia cell adhesion, migration and invasion in vitro, and the up-regulation of MMPs via activation of the Ras/ERK MAPK pathway was involved in this process.
Leukemic cells bearing NPM1 mutations frequently show myelomonocytic or monocytic features with dysplasia of two or more cell lineages [12]. In this study, THP-1 cells that were derived from human monocytic leukemia were selected as a cellular model. Next, we transfected the NPM1-mA-expressing construct, pEGFPC1-NPM1-mA, into THP-1 cells and evaluated for ectopic NPM1-mA mRNA and protein expression. Importantly, the overexpression of NPM1-mA enhanced the adhesive, migratory and invasive potential of the THP-1 cells. Clinical findings indicated that AML patients with NPM1 mutations were associated with higher gingival hyperplasia, lymphadenopathy and myeloid sarcoma frequencies at an extramedullary site [4, 28]. Recently, Luskin MR et al. [29] identified a unique association between the NPM1 mutation status and leukemia cutis (the infiltration of the epidermis, dermis or subcutis, a form of skin involved) amongst AML patients with monocytic features. Additionally, AML patients with NPM1 mutations always present with higher white blood cell and platelet counts, higher percentage of blasts in the bone marrow and higher lactate dehydrogenase (LDH) serum levels [30]. These observations suggest that NPM1 mutations contribute to the extramedullary infiltration in leukemia.
NPM1-mA expression decreased the TIMP-2 mRNA and protein expression levels in THP-1 cells. (A-B) The TIMP-2/1 mRNA levels were determined using qRT-PCR and the TIMP-2 mRNA in the NPM1-mA group were lower than that in the three control groups (p<0.05), but not TIMP-1 (p>0.05). (C) The TIMP-2/1 protein levels were determined using western blotting and the TIMP-2 protein levels in the NPM1-mA group were lower than that in the three control groups (p<0.01), but not TIMP-1 (p>0.05). All the proteins were quantified using image software and normalized against β-actin. Three independent experiments were performed. *p<0.05 vs. control, **p<0.01 vs. control.
High MMP-2 mRNA expression in primary AMLs with NPM1 mutation and associated with skin infiltration. (A) NPM1 mutation was analyzed using cBioPortal on 165 fully annotated patients from the 2013 TCGA human AML dataset. The percentage of total mutated cases in the dataset was listed, and cases without NPM1 mutation were not fully shown. Cases were sorted by the French American British (FAB) classification. (B) MMP-2 mRNA expression data for AML cases from TCGA were assessed. Brackets indicate the 95% confidence intervals, and black lines indicate the median value of MMP-2 mRNA expression. The AMLs with NPM1 mutation had significantly higher MMP-2 mRNA expression levels (p=0.0057). (C) The AMLs with skin infiltration had significantly higher MMP-2 mRNA expression levels (p=0.0102).
Traversing the protein fibers of the extracellular matrix is a key requirement for cell invasion. There is compelling evidence that MMPs, a family of endopeptidases, may facilitate the release of leukemia cells from the bone marrow into the peripheral blood, which is in accordance with its role in tumor cell invasion [31]. In our experiments, the results demonstrated that NPM1-mA increased the MMP-2/-9 mRNA and protein expression levels and their activities in THP-1 cells. It was also reported that MMP-2 was strongly expressed in human acute monocytic leukemia SHI-1 cells and facilitated cell invasion [32]. Elevated MMP-2 levels were responsible for the cells' increased invasive properties in the drug-resistant acute myeloid leukemia cells [33]. Additionally, MMP-9 specifically binds to the leukocyte surface, β2 integrin, to form the leukemia cell invadosome, which is required for pericellular proteolysis and migration of AML-derived cells [34]. Notably, MMP-9 was demonstrated to be responsible for BCR/ABL-mediated cell invasion and enhanced the ability of BCR/ABL leukemia cells to infiltrate hematopoietic (bone marrow, spleen) and some nonhematopoietic (brain, lung) organs in SCID mice [35]. These data indicated that MMP-2/-9 up-regulation that is mediated by NPM1 mutations might promote leukemia cell invasion. Further analysis that abrogated the MMP-2/-9 catalytic activity with a siRNA approach, a metalloproteinase inhibitor or blocking anti-MMPs antibody in invasive capacity of NPM1-mutated AML cells is required.
Tumor cell invasion is a complex process that is controlled by many signaling cascades [36]. Inder KL et al. [27] found that the N-terminal region of NPM1 could interact with K-Ras and stabilize K-Ras levels on the plasma membrane and concurrently increase the clustered fraction of GTP-K-Ras, which in turn enhances ERK/MAPK signal transduction. In this study, we showed that NPM1-mA interacted with K-Ras in THP-1 cells and enhanced MEK and ERK phosphorylation levels. These results could be explained with a mutant NPM1 protein that shared the same N-terminal region as the NPM1 protein [37]. Additionally, our results indicated that a specific inhibitor of ERK/MAPK pathway (PD98059) decreased the MMP-2 mRNA and protein expression levels. Furthermore, PD98059, but not the p38/MAPK, JNK/MAPK or PI3-K/AKT inhibitors, markedly decreased the invasive potential of the THP-1 cells with NPM1-mA overexpression. In addition, we demonstrated that TIMP-2 was reduced at both mRNA and protein levels in THP-1 cells after transfected with NPM1-mA, suggesting the role of MMP inhibitor in the regulation of MMPs activity. Recent advances showed that NPM1 could interact with Rac1 to mediate its nuclear export, which increased cytoplasmic RhoA signaling and promoted cell invasion [38]. Thus, other molecular mechanisms should be explored in the regulation of NPM1-mutated AML cells invasion.
Based on MMP-2/9 were involved in the invasive properties of AML cell lines by NPM1 mutants. We further confirmed the significance of MMPs in primary AMLs with NPM1 mutations. Evaluation of mRNA expression data from The Cancer Genome Atlas (TCGA) indicated that the AMLs with NPM1 mutation had significantly higher MMP-2 mRNA expression levels, and MMP-2 overexpression was associated with skin infiltration. Surprisingly, high MMP-9 levels were not frequently observed in the AML patients with NPM1 mutation. This contradicted with the results of MMP-9 up-regulation in our in vitro study. Such a difference may be due to the small samples (n=48) in our analysis of TCGA AML dataset. In addition, it could be explained in part by the fundamental difference between cultured cell lines and primary AML cells. Recent studies demonstrated that a new drug azacitidine significantly increased MMP-9 protein levels in bone marrow from myelodysplastic diseases (MDS) patients and enhanced invasive capacity of AML and MDS cell lines in vitro [39]. Therefore, further studies are needed to examine MMP-9 levels in AML patients with NPM1 mutated.
In conclusion, our studies provided direct evidence that NPM1 mutations were involved in leukemia cell invasion in vitro and uncovered that MMPs, which was regulated by the K-Ras/ ERK MAPK signaling pathway, may play a role in this process for the first time. Future efforts should explore the role of NPM1 mutants in leukemia infiltration in a proper animal model and clinical study. Inhibition of MMP activation to attenuate NPM1-mutated AML cell invasion is a promising new approach to be exploited in further translational studies.
Abbreviations
AML: acute myeloid leukemia; CNS: central nervous system; ECM: extracellular matrix; ERK: extracellular signal-regulated kinase 1/2; LDH: lactate dehydrogenase; MAPKs: mitogen-activated protein kinases; MMPs: matrix metalloproteinases; NES: nuclear export signal; NLS: nucleolar localization signal; NPM1: nucleophosmin1; NPMc+: cytoplasmic nucleophosmin; NPM1-mA: type A NPM1 mutation; NPM1-wt: NPM1 wild type; TCGA: The Cancer Genome Atlas; TIMPs: tissue inhibitor of matrix metalloproteinases; WHO: World Health Organization.
Acknowledgements
This work was supported by the National Natural Science Foundation of China (No. 81271913), Natural Science Foundation of CQ CSTC (No. cstc2013jcyjA10035) and the Technology Foundation for Selected Overseas Chinese Scholar, Ministry of Personnel of China (No. 2013009). This study was also partly supported by a Graduate fellowship in research innovation from the Chongqing Municipal Education Commission (No. CYS14115).
Competing Interests
The authors have declared that no competing interest exists.
References
1. O'Donnell MR, Tallman MS, Abboud CN, Altman JK, Appelbaum FR, Arber DA. et al. Acute myeloid leukemia, version 2.2013. Journal of the National Comprehensive Cancer Network: JNCCN. 2013;11:1047-55
2. Schlenk RF, Dohner K, Krauter J, Frohling S, Corbacioglu A, Bullinger L. et al. Mutations and treatment outcome in cytogenetically normal acute myeloid leukemia. The New England journal of medicine. 2008;358:1909-18
3. Vardiman JW, Thiele J, Arber DA, Brunning RD, Borowitz MJ, Porwit A. et al. The 2008 revision of the World Health Organization (WHO) classification of myeloid neoplasms and acute leukemia: rationale and important changes. Blood. 2009;114:937-51
4. Falini B, Nicoletti I, Martelli MF, Mecucci C. Acute myeloid leukemia carrying cytoplasmic/mutated nucleophosmin (NPMc+ AML): biologic and clinical features. Blood. 2007;109:874-85
5. El Rassi F, Arellano M. Update on optimal management of acute myeloid leukemia. Clinical Medicine Insights Oncology. 2013;7:181-97
6. Grisendi S, Mecucci C, Falini B, Pandolfi PP. Nucleophosmin and cancer. Nature reviews Cancer. 2006;6:493-505
7. Colombo E, Alcalay M, Pelicci PG. Nucleophosmin and its complex network: a possible therapeutic target in hematological diseases. Oncogene. 2011;30:2595-609
8. Bolli N, Nicoletti I, De Marco MF, Bigerna B, Pucciarini A, Mannucci R. et al. Born to be exported: COOH-terminal nuclear export signals of different strength ensure cytoplasmic accumulation of nucleophosmin leukemic mutants. Cancer research. 2007;67:6230-7
9. Falini B, Mecucci C, Tiacci E, Alcalay M, Rosati R, Pasqualucci L. et al. Cytoplasmic nucleophosmin in acute myelogenous leukemia with a normal karyotype. The New England journal of medicine. 2005;352:254-66
10. Pasqualucci L, Liso A, Martelli MP, Bolli N, Pacini R, Tabarrini A. et al. Mutated nucleophosmin detects clonal multilineage involvement in acute myeloid leukemia: Impact on WHO classification. Blood. 2006;108:4146-55
11. Falini B, Nicoletti I, Bolli N, Martelli MP, Liso A, Gorello P. et al. Translocations and mutations involving the nucleophosmin (NPM1) gene in lymphomas and leukemias. Haematologica. 2007;92:519-32
12. Falini B, Sportoletti P, Martelli MP. Acute myeloid leukemia with mutated NPM1: diagnosis, prognosis and therapeutic perspectives. Current opinion in oncology. 2009;21:573-81
13. Colombo E, Martinelli P, Zamponi R, Shing DC, Bonetti P, Luzi L. et al. Delocalization and destabilization of the Arf tumor suppressor by the leukemia-associated NPM mutant. Cancer research. 2006;66:3044-50
14. Bonetti P, Davoli T, Sironi C, Amati B, Pelicci PG, Colombo E. Nucleophosmin and its AML-associated mutant regulate c-Myc turnover through Fbw7 gamma. The Journal of cell biology. 2008;182:19-26
15. Noguera NI, Song MS, Divona M, Catalano G, Calvo KL, Garcia F. et al. Nucleophosmin/B26 regulates PTEN through interaction with HAUSP in acute myeloid leukemia. Leukemia. 2013;27:1037-43
16. Leong SM, Tan BX, Bte Ahmad B, Yan T, Chee LY, Ang ST. et al. Mutant nucleophosmin deregulates cell death and myeloid differentiation through excessive caspase-6 and -8 inhibition. Blood. 2010;116:3286-96
17. Shao HY, Miao ZY, Hui C, Qin FX, Chen XC, Tan S. et al. Nucleophosmin gene mutations promote NIH3T3 cell migration and invasion through CXCR4 and MMPs. Experimental and molecular pathology. 2011;90:38-44
18. Alcalay M, Tiacci E, Bergomas R, Bigerna B, Venturini E, Minardi SP. et al. Acute myeloid leukemia bearing cytoplasmic nucleophosmin (NPMc+ AML) shows a distinct gene expression profile characterized by up-regulation of genes involved in stem-cell maintenance. Blood. 2005;106:899-902
19. Nalla AK, Gorantla B, Gondi CS, Lakka SS, Rao JS. Targeting MMP-9, uPAR, and cathepsin B inhibits invasion, migration and activates apoptosis in prostate cancer cells. Cancer gene therapy. 2010;17:599-613
20. Feng S, Cen J, Huang Y, Shen H, Yao L, Wang Y. et al. Matrix metalloproteinase-2 and -9 secreted by leukemic cells increase the permeability of blood-brain barrier by disrupting tight junction proteins. PloS one. 2011;6:e20599
21. Ptak A, Hoffmann M, Gruca I, Barc J. Bisphenol A induce ovarian cancer cell migration via the MAPK and PI3K/Akt signalling pathways. Toxicology letters. 2014;229:357-65
22. Redondo-Munoz J, Jose Terol M, Garcia-Marco JA, Garcia-Pardo A. Matrix metalloproteinase-9 is up-regulated by CCL21/CCR7 interaction via extracellular signal-regulated kinase-1/2 signaling and is involved in CCL21-driven B-cell chronic lymphocytic leukemia cell invasion and migration. Blood. 2008;111:383-6
23. Liu WH, Chang LS. Caffeine induces matrix metalloproteinase-2 (MMP-2) and MMP-9 down-regulation in human leukemia U937 cells via Ca2+/ROS-mediated suppression of ERK/c-fos pathway and activation of p38 MAPK/c-jun pathway. Journal of cellular physiology. 2010;224:775-85
24. Nagase H, Visse R, Murphy G. Structure and function of matrix metalloproteinases and TIMPs. Cardiovascular research. 2006;69:562-73
25. Cerami E, Gao J, Dogrusoz U, Gross BE, Sumer SO, Aksoy BA. et al. The cBio cancer genomics portal: an open platform for exploring multidimensional cancer genomics data. Cancer discovery. 2012;2:401-4
26. Gao J, Aksoy BA, Dogrusoz U, Dresdner G, Gross B, Sumer SO. et al. Integrative analysis of complex cancer genomics and clinical profiles using the cBioPortal. Science signaling. 2013;6:pl1
27. Inder KL, Lau C, Loo D, Chaudhary N, Goodall A, Martin S. et al. Nucleophosmin and nucleolin regulate K-Ras plasma membrane interactions and MAPK signal transduction. The Journal of biological chemistry. 2009;284:28410-9
28. Falini B, Lenze D, Hasserjian R, Coupland S, Jaehne D, Soupir C. et al. Cytoplasmic mutated nucleophosmin (NPM) defines the molecular status of a significant fraction of myeloid sarcomas. Leukemia. 2007;21:1566-70
29. Luskin MR, Huen AO, Brooks SA, Stewart C, Watt CD, Morrissette JJ. et al. NPM1 Mutation is Associated with Leukemia Cutis in Acute Myeloid Leukemia with Monocytic Features. Haematologica. 2015
30. Dohner K, Schlenk RF, Habdank M, Scholl C, Rucker FG, Corbacioglu A. et al. Mutant nucleophosmin (NPM1) predicts favorable prognosis in younger adults with acute myeloid leukemia and normal cytogenetics: interaction with other gene mutations. Blood. 2005;106:3740-6
31. Chang C, Werb Z. The many faces of metalloproteases: cell growth, invasion, angiogenesis and metastasis. Trends in cell biology. 2001;11:S37-43
32. Wang C, Chen Z, Li Z, Cen J. The essential roles of matrix metalloproteinase-2, membrane type 1 metalloproteinase and tissue inhibitor of metalloproteinase-2 in the invasive capacity of acute monocytic leukemia SHI-1 cells. Leukemia research. 2010;34:1083-90
33. Song JH, Kim SH, Cho D, Lee IK, Kim HJ, Kim TS. Enhanced invasiveness of drug-resistant acute myeloid leukemia cells through increased expression of matrix metalloproteinase-2. International journal of cancer Journal international du cancer. 2009;125:1074-81
34. Stefanidakis M, Karjalainen K, Jaalouk DE, Gahmberg CG, O'Brien S, Pasqualini R. et al. Role of leukemia cell invadosome in extramedullary infiltration. Blood. 2009;114:3008-17
35. Nieborowska-Skorska M, Hoser G, Rink L, Malecki M, Kossev P, Wasik MA. et al. Id1 transcription inhibitor-matrix metalloproteinase 9 axis enhances invasiveness of the breakpoint cluster region/abelson tyrosine kinase-transformed leukemia cells. Cancer research. 2006;66:4108-16
36. Alizadeh AM, Shiri S, Farsinejad S. Metastasis review: from bench to bedside. Tumour biology: the journal of the International Society for Oncodevelopmental Biology and Medicine. 2014;35:8483-523
37. Falini B, Bolli N, Shan J, Martelli MP, Liso A, Pucciarini A. et al. Both carboxy-terminus NES motif and mutated tryptophan(s) are crucial for aberrant nuclear export of nucleophosmin leukemic mutants in NPMc+ AML. Blood. 2006;107:4514-23
38. Navarro-Lerida I, Pellinen T, Sanchez SA, Guadamillas MC, Wang Y, Mirtti T. et al. Rac1 nucleocytoplasmic shuttling drives nuclear shape changes and tumor invasion. Developmental cell. 2015;32:318-34
39. Bernal T, Moncada-Pazos A, Soria-Valles C, Gutierrez-Fernandez A. Effects of azacitidine on matrix metalloproteinase-9 in acute myeloid leukemia and myelodysplasia. Experimental hematology. 2013;41:172-9
Author contact
![]() Corresponding author: Ling Zhang, College of Laboratory Medicine, Chongqing Medical University, No. 1, Yixueyuan Road, Chongqing, 400016, China. Tel: +86 023-68485240, Fax: +86 0 23-68485239, Email: lingzhangedu.cn
Corresponding author: Ling Zhang, College of Laboratory Medicine, Chongqing Medical University, No. 1, Yixueyuan Road, Chongqing, 400016, China. Tel: +86 023-68485240, Fax: +86 0 23-68485239, Email: lingzhangedu.cn