Impact Factor ISSN: 1449-2288

 Global reach, higher impact
Int J Biol Sci 2016; 12(6):653-666. doi:10.7150/ijbs.14577 This issue Cite
Research Paper
RNA-Seq and iTRAQ Reveal the Dwarfing Mechanism of Dwarf Polish Wheat (Triticum polonicum L.)
Yi Wang1*, Xue Xiao1*, Xiaolu Wang1*, Jian Zeng2, Houyang Kang1, Xing Fan1, Lina Sha1, Haiqin Zhang1, Yonghong Zhou1 ![]()
1. Triticeae Research Institute, Sichuan Agricultural University, Wenjiang 611130, Sichuan, China.
2. College of Resources, Sichuan Agricultural University, Wenjiang 611130, Sichuan, China.
*The authors contributed equally to this work.
Received 2015-12-2; Accepted 2016-2-15; Published 2016-4-8
Abstract
The dwarfing mechanism of Rht-dp in dwarf Polish wheat (DPW) is unknown. Each internode of DPW was significantly shorter than it in high Polish wheat (HPW), and the dwarfism was insensitive to photoperiod, abscisic acid (ABA), gibberellin (GA), cytokinin (CK), auxin and brassinolide (BR). To understand the mechanism, three sets of transcripts, DPW, HPW, and a chimeric set (a combination of DPW and HPW), were constructed using RNA sequencing (RNA-Seq). Based on the chimeric transcripts, 2,446 proteins were identified using isobaric tags for relative and absolute quantification (iTRAQ). A total of 108 unigenes and 12 proteins were considered as dwarfism-related differentially expressed genes (DEGs) and differentially expressed proteins (DEPs), respectively. Among of these DEGs and DEPs, 6 DEGs and 6 DEPs were found to be involved in flavonoid and S-adenosyl-methionine (SAM) metabolisms; 5 DEGs and 3 DEPs were involved in cellulose metabolism, cell wall plasticity and cell expansion; 2 DEGs were auxin transporters; 2 DEPs were histones; 1 DEP was a peroxidase. These DEGs and DEPs reduced lignin and cellulose contents, increased flavonoid content, possibly decreased S-adenosyl-methionine (SAM) and polyamine contents and increased S-adenosyl-L-homocysteine hydrolase (SAHH) content in DPW stems, which could limit auxin transport and reduce extensibility of the cell wall, finally limited cell expansion (the cell size of DPW was significantly smaller than HPW cells) and caused dwarfism in DPW.
Keywords: RNA-Seq, iTRAQ, dwarfism, dwarf Polish wheat, flavonoid, cellulose.
Introduction
The wheat Reduced-height1 (Rht1) and rice (Oryza sativa L.) semi-dwarf1 (sd1) genes, which triggered the “green revolution”, widely enhance lodging resistance, harvest index and biomass production of crops [1-5]. The dwarfing mechanisms involved in plant phytohormone biosynthesis and signaling and other metabolisms have also been examined and discovered.
Most dwarfing genes regulate the balance of endogenous phytohormone(s) to disturb cell proliferation and/or cell expansion, thus result in dwarfism [5-10]. Some dwarfing genes unbalance the biosynthesis or signaling of gibberellins (GAs) which play important roles in elongated growth, thereby cause dwarfism. For example, mutants Rht-B1 and Rht-D1 encode a GA signaling repressor reduce the response to GA, and then limit the elongation of wheat stems [3, 11]. d35 and sd-1 cause dwarfism in rice by disrupting GA biosynthesis [5, 12]. Several GA-related dwarfing genes and their dwarfing mechanisms have also been discovered in barley [13], Arabidopsis [14-15], sorghum [16], tobacco [17], and Brassica rapa [15]. The disruptions of other phytohormones biosynthesis and signaling caused dwarfism have also been reported. Mutant genes, such as d2, d11, d61 and brd1 in rice [6-7, 18-19] and dwf5, shrink1-D, dwarf4 and bes1 in Arabidopsis [8, 20-22], result in deficiencies of brassinolide (BR) biosynthesis and/or signaling and cause aberrant cell division or elongation, finally generate differentially BR-related dwarfisms. The mutant genes, smos and tdd1 in rice [23-24], abcb in Pearl millet [25], maize and sorghum [26], and bud1 in Arabidopsis [27], disturbed auxin biosynthesis, transport or signaling, cause dwarfisms. Meanwhile, other mutant genes caused deficiencies of strigolactones and salicylic acid also cause dwarfisms in rice and Arabidopsis [9, 28-30].
In addition to these phytohormone-related dwarfing genes and mechanisms, the phenylpropanoid pathway, participated in many physiological processes [31-32], is also involved in dwarfism. Knockout of S-adenosyl-L-homocysteine hydrolase (SAHH) result in dwarfism with increasing cytokinin (CK) [33-35]. Silencing of cinnamyl alcohol dehydrogenase (CAD) causes dwarfism with reducing lignin content [36]. Silencing of hydroxycinnamoyl CoA:shikimate hydroxycinnamoyl transferase (HCT) in Arabidopsis also results in dwarfism by accumulating endogenous flavonoid [37].
To date, 10 dwarfing genes have been discovered in tetraploid wheat (2n = 4x = 28, AABB) [38-42]. Of these 10 genes, the recessive gene Rht-dp mapped on 4BS in Chinese dwarf Polish wheat (DPW) [42] reduces the coleoptile length and seedling leaf area [43]. However, its dwarfing mechanism remains unknown. Additionally, Chinese Polish wheat exhibits low genetic similarity to T. durum, T. turgidum and common wheat [44-45]. Therefore, it is impossible to extrapolate the dwarfing mechanism of DPW from the transcriptomic and proteomic information of T. turgidum and common wheat [46-48].
With the advances of next-generation sequencing technology, RNA sequencing (RNA-Seq) has been widely used in plants lacking complete genomic information to find transcriptional evidence [46-49]. Meanwhile, proteomic analyses providing translational insights have also been widely used in wheat treated with salinity and drought [50], salt [51] and hydrogen peroxide stress [52]. Additionally, the results of RNA-Seq can facilitate the identification of novel and known proteins and their roles in target traits [53-54].
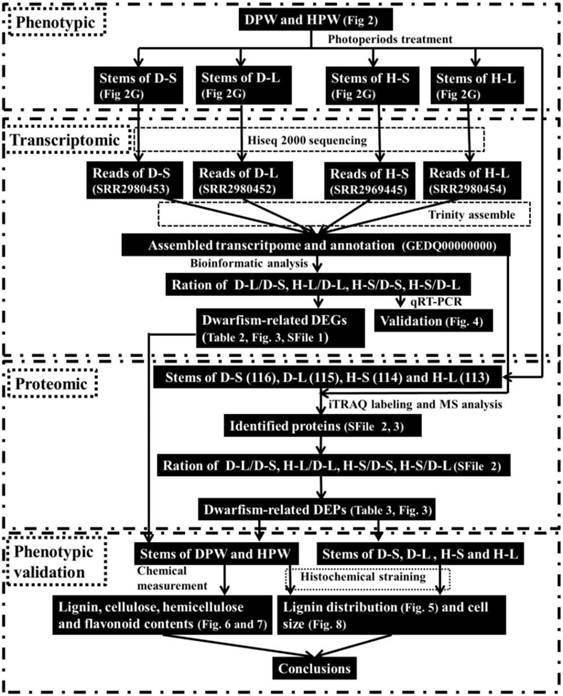
The workflow of this study was shown in Fig. 1. We combined RNA-Seq and isobaric tags for relative and absolute quantification (iTRAQ) which widely used in wheat [52, 55] to construct unique transcripts and proteomes of DPW and a high Polish wheat (HPW), and then identified dwarfism-related genes and proteins to understand the dwarfing mechanism of Rht-dp.
The general workflow and summary of the present study. This study used morphologic, transcriptomic, and proteomic analysis, and phenotypic validation to construct unique transcripts and identify unique wheat proteins of DPW and HPW to discover the possible mechanism of dwarfism in DPW.
Methods
Phenotypic characterization
DPW, HPW and F2 (DPW×HPW) were grown in Chengdu, China, under a normal growing season. The plant height, leaf color, spike and glume length, seed size and 1000-seed weight were measured in maturation stage.
Phytohormone treatments
At the beginning of stem elongation, every 20 DPW seedlings were sprayed (once a week) with a 1 mM abscisic acid (ABA) solution, 100 μM auxin, 50 μM CK or 10 μM BR, until flowering. Plant heights were measured at maturation.
RNA-Seq and iTRAQ analysis
Photoperiod treatments
DPW and HPW seeds were planted in soil in a growth chamber (16 hours light/8 hours dark, 25 ˚C, and 70% humidity). At the beginning of the jointing stage, part of DPW and HPW plants were grown under 8 hours light/16 hours dark, 25 ˚C, and 70% humidity (named as D-S and H-S, where S means a shorter photoperiod), other plants were grown under 16 hours light/8 hours dark, 25 ˚C, and 70% humidity (named as D-L and H-L, where L means a longer photoperiod). After 30 days of the photoperiod treatments, the stems from fifteen plants (two biological replicates) were collected and snap frozen in liquid nitrogen and stored at -80 ˚C until RNA and protein extraction.
RNA isolation, quantification and qualification
The total RNA of each sample (D-L, D-S, H-L and H-S) was isolated using the E.Z.N.A.® Total RNA Kit II (Cat. #: R6934-01, Omega) according to the user manual. The quality of Each RNA sample was checked 1) on 1% agarose gels; 2) and using the NanoPhotometer® spectrophotometer (Implen, CA, USA), and 3) with the RNA 6000 Nano Assay Kit of the Bioanalyzer 2100 system (Agilent Technologies, CA, USA). Samples with the RNA integrity number (RIN) above 8 were used for the next step. The Qubit® RNA Assay Kit in a Qubit® 2.0 Fluorometer (Life Technologies, CA, USA) was used to measure RNA concentration.
Library construction and sequencing
mRNA was purified from total RNA using poly-T oligo-attached magnetic beads (Life Technologies, CA, USA) and transcribed to cDNA using random oligonucleotides with M-MuLV Rease Transcriptase (RNase H-) (TaKaRa) and DNA polymerase I and RNase H (TaKaRa). NEBNext adaptor oligonucleotides (Illumina) were ligated to the 3' ends of cDNA fragments adenylated with Klenow Exo- (Illumina). Approximate 200 bp cDNA fragments were purified using the AMPure XP bead system (Beckman Coulter, Beverly, USA). Ten cycles of PCR amplifications were conducted to enrich cDNA fragments ligated to the adaptors on both ends using the NEB Universal PCR primer and Index primer (Illumina). The PCR products were purified using the AMPure XP bead system and quantified using the Agilent high sensitivity DNA (Agilent Technologies, CA, USA) on the Agilent 2100 bioanalyzer system. Finally, the four-coded samples were clustered by the cBot cluster generation system using the TruSeq PE Cluster Kit v3-cBot-HS (Illumina) according to the user manual, and then sequenced using the 100 bp protocol on an Illumina Hiseq 2000 platform.
Transcriptome assembly and CDS (coding sequence) prediction
Reads containing adapters, poly-N and low-quality reads were removed using Novogene-written Perl scripts to produce clean reads. The GC content and sequence duplication level of the clean data were calculated. The pair-end clear reads generated contigs using Trinity (V2012-10-15) [56] with a minimum K-mer coverage of 2 and other parameters with default values. Unigene definition and CDS prediction were conducted according to Zhang et al. [49] and Krasileva et al. [48].
Gene function annotation
Functions of unigenes were annotated using a series of databases, including BLASTx against the NCBI non-redundant protein (Nr), NCBI nucleotide collection (Nt) and Swiss-Prot databases with 10-6 as an E-value cutoff, and hmmscan against the protein family (Pfam) database. Functional categories of putative unigenes were grouped using the Kyoto Encyclopedia of Genes and Genomes (KEGG, http://www.genome.jp/kegg/), Clusters of Orthologous Groups of proteins (KOG/COG, http://www.ncbi.nlm.nih gov/COG/) database, and Blast2GO against Gene Ontology (GO, http://www.geneontology.org) [57].
Differential expression analysis
Clean reads were aligned against assembled transcript to generate read counts using the RSEM package [58]. The read count of each unigene was converted into RPKM values to normalize the gene expression using the RPKM method [59]. Differential gene expressions were calculated using the DEseq method [60].
Protein extraction
Stems were ground in liquid nitrogen with 0.1 mg polyvinylpyrrolidone (PVPP) and homogenized with Tris-phenol (pH 8.0) and protein extraction buffer (0.7 M sucrose, 0.1 M KCl, 50 mM EDTA, 0.5 M Tris, 2% β-mercaptoethanol and 1 mM PMSF) with a pH of 7.5. After 20 minutes centrifuge at 6,000 rpm, the supernatant was purified again using protein extraction buffer. The protein was precipitated by ammonium acetate methanol and then washed with methanol (twice) and acetone (twice). Finally, the protein was diluted with RIPA reagent. The protein concentration was measured using the BCA Assay Kit (Biotech) according to the user manual.
iTRAQ labeling and LC-MS analysis
iTRAQ labeling was performed according to Wu et al. [61] and Tse et al. [54] with minor modification. Briefly, 200 μg proteins of each sample were reduced, alkylated and then subjected to tryptic hydrolysis. The iTRAQ labeling was performed using iTRAQ® reagents - 8plex Kit (Applied Biosystems, Sciex) according to the user manual. Peptides from stem samples of H-L, H-S, D-L and D-S were labeled individually with the iTRAQ reporters 113, 114, 115, and 116, respectively. LC-MS (TripleTOF5600, Applied Biosystems, Sciex) analysis was performed according to Wu et al. [61].
Protein identification and quantification
Protein identification and relative quantification were performed according to Ruppen et al. [62] with minor modifications. Briefly, Protein Pilot software v4.0 (Applied Biosystems, Sciex) was used to convert the raw data (.wiff) into peak lists (.mgf). Each MS/MS spectrum was searched against a deduced protein database from RNA-Seq. The search parameters were as follows: Paragon method - iTRAQ-8plex, Cys alkylation - MMTS, Digestion - Trypsin, Instrument - TripleTOF 5600, ID focus - Biological Modifications and Amino Acids Substitutions, Detected Protein Threshold [Unused ProtScore (Confidence)] - ≥ 1.3, Competitor Error Margin (ProtScore) - 2.0, and No. Distinct Peptides (Confidence) - ≥ 95%. The averagely relative expression (fold-change ratios of differential expression between labeled protein samples), P value, error factor, lower confidence interval and upper confidence interval were calculated by Protein Pilot and then exported into Excel. Proteins with fold change ratios ≥ 2 or ≤ 0.5 and P values ≤ 0.05 were considered to be differentially expressed proteins (DEPs) [52, 61, 63].
Quantitative real time PCR (qPCR) for validation
Total RNA was isolated from the stems of DPW and HPW under photoperiod treatments, and genomic DNA was removed using an RNase-free DNase set (Omega) according to the user manual. The qPCR and data analysis were performed as described by Wang et al. [64]. Ten differentially expressed genes from RNA-Seq were validated, and their primers are listed in Additional file 4: Supplementary Table 1. Actin, as described by Wang et al. [64], was used as a reference gene to normalize gene expression.
Histochemical staining of lignin
At the jointing-booting stage, the second internode stems of DPW and HPW treated with different photoperiods, under growing seasons and sprayed with phytohormones were fixed in Carnoy's fixative I (3 parts of 95% ethanol to 1 part of glacial acetic acid). Sections (cross and longitudinal) with 10-μm-thick were cut on a cryostat microtome (Leica, CM1850, UV) with 1% agarose gel. After removing agarose gel using QIAquick Gel Extraction Kit (Qiagen, Cat. #: 28706, USA), the sections were stained with 1% safranin O (Solarbio) in water for 3 hours, rinsed three times in 85% ethanol for 10 minutes, and then counterstained with an alcoholic solution of fast green FCF (Solarbio, Cat. #: 907A035) (1 mg fast green FCF in 200 ml 50% ethanol) for 20 seconds. Images were captured using a Photometrics SenSys CCD camera on an Olympus BX-51 microscope (Olympus, Tokyo, Japan).
Measurement of Klason lignin, lignin monomer, cellulose, hemicellulose and flavonoid contents
DPW and HPW stems were collected to determine the Klason lignin, lignin monomer, cellulose, hemicellulose and flavonoid contents. Samples for measuring the Klason lignin, cellulose and hemicellulose contents were prepared according to the protocol of Hames et al. [65], and the contents were determined according to the protocol of Sluiter et al. [66]. Lignin monomeric compositions were analyzed according to Guo et al. [67]. Flavonoid contents were measured using the method of Quettier-Deleu et al. [68]
Results
Phenotypic characterization of DPW and HPW
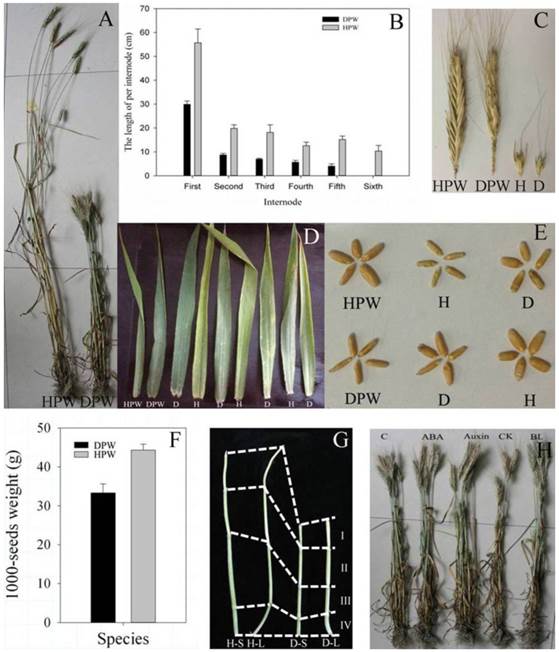
In maturation stage, DPW with a plant height of 78.35 ± 4.42 cm was significantly shorter than HPW with a plant height of 157.08 ± 9.76 cm (P < 0.05, Fig. 2A). DPW and HPW had five and six internodes, respectively (Fig. 2B), and each internode of DPW was significantly shorter than the corresponding internode of HPW (P < 0.05, Fig. 2B). The spike lengths (Fig. 2C) and tiller numbers (Fig. 2A) between DPW and HPW were similar, but the glume of HPW was larger than that in DPW (Fig. 2C). DPW had dark green and erect leaves, while HPW had yellow-green and curled leaves (Fig. 2D). The seed length of DPW was similar to that of HPW, but the seed width of DPW was narrower than that in HPW (Fig. 2E), which resulted in a significantly lower 1000-seed weight for DPW compared to HPW (P < 0.05, Fig. 2F). However, the dark green and erect leaves and the narrower seeds were not associated with the dwarfism of the F2 population (Fig. 2D and E).
Morphological traits. A: Plant heights of HPW and DPW at the maturate stage. B: Each internode length of HPW and DPW at the maturate stage; the first internode was below the spike; all data were collected from 10 plants with three replicates. C: Spikes and glumes of HPW and DPW. D: Leaves of HPW, DPW and 7 F2 plants. E: Seeds of HPW, DPW and 4 F2 plants; D and H represented DPW and HPW type, respectively. F: 1000-seed weights of HPW and DPW. G: Stems of HPW and DPW under photoperiod treatments; total of 4 internodes; H-S and D-S were HPW and DPW plants, respectively, grown under 8 hours light/16 hours dark, 25 ˚C, and 70% humidity; H-L and D-L were HPW and DPW plants, respectively, grown under 16 hours light/8 hours dark, 25 ˚C, and 70% humidity. H: Plant heights of DPW sprayed with different phytohormones, respectively. The bars in B and F represented standard deviation from three replicates; the data and figures were analyzed and drawn using SigmaPlot 12.0.
Photoperiod treatments did not change the stem lengths of DPW and HPW
Li et al. [69] reported a photoperiod-sensitive dwarfing gene Psd1 whose plant height was restored by short-day growth. Whether Rht-dp was also a photoperiod-sensitive dwarfing gene? The stem lengths of H-S (47.41 ± 4.32 cm) and H-L (50.83 ± 4.30 cm) were significantly longer than that of D-S (28.52 ± 4.01 cm) and D-L (31.76 ± 3.64 cm) (P < 0.05) (Fig. 2G), the photoperiod treatments therefore did not affect the stem elongations in both DPW and HPW. The plant heights of DPW were not rescued by short or long photoperiods (Fig. 2G). These results indicated that Rht-dp was a photoperiod-insensitive dwarfing gene, and the stems were suitable for RNA-Seq and iTRAQ analysis to reveal the molecular mechanism of dwarfism.
Rht-dp is insensitive to ABA, CK, BR and auxin
Previous studies indicated that some dwarfisms were restored by spraying with phytohormones [6-7, 13]. We also examined this possibility in DPW. Compared with the control (78.35 ±4.42 cm), the application of exogenous ABA, auxin, CK and BL did not restore the plant heights of DPW, which were 78.22 ± 4.40 cm, 81.13 ± 6.01 cm, 79.22 ± 4.68 cm, and 82.22 ± 5.14 cm, respectively (Fig. 2H). These results indicated that Rht-dp was an ABA-, CK-, BR- and auxin-insensitive dwarfing gene.
cDNA sequence generation and de novo assembly
To understand the dwarfing mechanism of Rht-dp, the transcription levels of stems from DPW and HPW were analyzed using RNA-Seq. All raw reads were deposited into the NCBI Sequence Read Archive (SRA) database with accession number SRX1452957.
After cleaning and quality checks, a total of 108,106,616 100 bp pair-end reads consisted of 57,404,542 from D-S and 50,702,074 from D-L, were obtained. Reads from D-S and D-L were assembled and produced 212,645 transcripts with an average length of 1064 bp. After gap filling, the transcript including 102,876 DPW unigenes with an average length of 680 bp was further assembled.
A total of 94,223,698 100 bp pair-end reads including 45,565,570 from H-S and 48,658,128 from H-L were also obtained. A total of 189,216 transcripts with an average length of 1,000 bp were assembled. Further assembly generated 98,455 HPW unigenes with an average length of 673 bp.
To normalize the expression of unigenes and identify differentially expressed genes (DEGs) involved in DPW dwarfism, a chimera including 268,932 transcripts with an average length of 1,070 bp was assembled from all the reads of DPW and HPW. Further assembly produced 124,395 chimeric unigenes with an average length of 671 bp. The sequences of these unigenes were deposited into the NCBI Transcriptome Shotgun Assembly (TSA) database with accession number GEDQ00000000.
CDS prediction and functional annotation of unigenes
The open reading frames and CDS of 38,347 (32.27%) DPW unigenes, 37,934 (38.53%) HPW unigenes and 42,397 (34.08%) chimeric unigenes were successfully predicted using BLASTx against the NCBI Nr and Swiss-Prot databases with a cut-off E-value of 1e-6. The open reading frames and CDS of another 55,963 (54.40%) DPW unigenes, 52,767 (53.60%) HPW unigenes, and 70,903 (57.00%) chimeric genes that were not predicted by NCBI Nr and Swiss-Prot were predicted using ESTScan. A total of 56,394 DPW unigenes (54.82%), 55,079 HPW unigenes (55.94%) and 64,700 chimeric genes (52.01%) were successfully functionally annotated in at least one of the databases. The annotated information of these unigenes was deposited into the NCBI TSA database with accession number GEDQ00000000.
Dwarfism-related DEGs
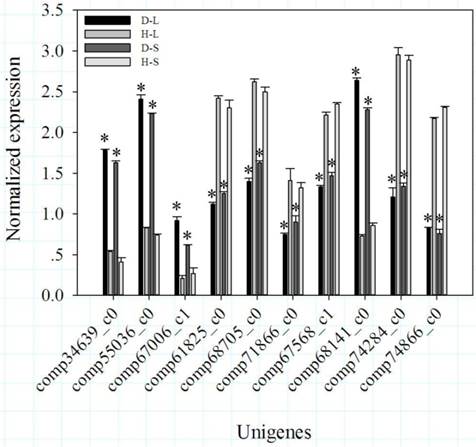
Because the photoperiod treatments on DPW and HPW did not significantly change the stem lengths (Fig. 2G), dwarfism-related genes should exhibit significantly differential expression (P < 0.05) between D-L and H-L, D-S and H-S, D-S and H-L, and D-L and H-S, but not between H-L and H-S or D-L and D-S. Based on these conditions, 108 DEGs including 35 that were down-regulated and 73 that were up-regulated (DPW/HPW) were considered dwarfism-related genes (Additional file 1). Among of these DEGs, 6 DEGs (Table 1; Fig. 3), carboxylesterase 6 (CXE), 2 chalcone synthases (CHS), cytochrome P450 (CYP450), isoflavone reductase (IFR), and O-methyltransferase (OMT), were involved in flavonoid metabolism. 5 DEGs (Table 1), beta-galactosidase 2 (β-GAL), expansin-B10 (EXPB10), expansin-B7 (EXPB7), xyloglucan endotransglucosylase/hydrolase protein 19 (XTH19) and glucan endo-1,3-beta-glucosidase (β-GLU), were involved in cellulose metabolism, mainly in cell wall plasticity and cell expansion. 2 DEGs (Table 1), ABC transporter B family member 2 (ABCB2) and pleiotropic drug resistance protein 2 (PDR2/ABCG2) involved in auxin transport, were down-regulated in DPW. The differential expressions of genes between DPW and HPW were also validated by qRT-PCR, namely the expressions of 10 DEGs in D-L, D-S, H-L and H-S. As shown in Fig. 4, the expression levels of CXE, CHS, CYP450 and β-GLU in D-S and D-L were significantly higher than that in H-L and H-S; in contrast, the expression levels of IFR, OMT, β-GAL, EXPB10, ABCB2 and PDR in D-S and D-L were significantly lower than that in H-S and H-L (Fig. 4).
Dwarfism-related DEGs.
| Unigene | Length | Name | Fold change of transcript | |||||
|---|---|---|---|---|---|---|---|---|
| D-L/H-L | D-S/H-S | H-S/H-L | D-S/D-L | D-S/H-L | D-L/H-S | |||
| Phenylpropanoid metabolism | ||||||||
| comp34639_c0 | 1595 | Carboxylesterase 6 (CXE) | 4.85 | 4.38 | -0.46 | -0.90 | 3.98 | 5.26 |
| comp55036_c0 | 914 | Chalcone synthase (CHS) | 3.14 | 5.38 | -2.66 | -0.39 | 2.78 | 5.75 |
| comp55036_c1 | 816 | Chalcone synthase 1 (CHS) | 3.47 | 5.33 | -2.46 | -0.57 | 2.93 | 5.88 |
| comp67006_c1 | 1983 | Cytochrome P450 (CYP450) | 3.49 | 2.13 | 0.33 | -1.00 | 2.52 | 3.11 |
| comp61825_c0 | 1544 | Isoflavone reductase (IFR) | -1.61 | -1.17 | -0.47 | -0.01 | -1.58 | -1.19 |
| comp68705_c0 | 1633 | O-methyltransferase (OMT) | -1.89 | -1.53 | 0.24 | 0.62 | -1.23 | -2.17 |
| Cellulose metabolism | ||||||||
| comp71866_c0 | 3578 | Beta-galactosidase 2 (β-GAL) | -1.56 | -1.05 | -0.06 | 0.47 | -1.05 | -1.55 |
| comp67568_c1 | 1332 | Expansin-B10 (EXPB10) | -1.80 | -1.50 | 0.24 | 0.57 | -1.19 | -2.09 |
| comp54116_c0 | 1391 | Expansin-B7 (EXPB7) | -3.72 | -4.15 | -0.49 | -0.89 | -4.58 | -3.28 |
| comp53875_c0 | 489 | Xyloglucan endotransglucosylase/hydrolase protein 19 (XTH) | -2.44 | -4.34 | 0.72 | -1.15 | -3.56 | -3.21 |
| comp68141_c0 | 2129 | Glucan endo-1,3-beta-glucosidase (β-GLU) | 2.01 | 1.01 | 0.40 | -0.58 | 1.47 | 1.56 |
| Auxin transporters | ||||||||
| comp74284_c0 | 3728 | ABC transporter B family member 2 (ABCB2) | -2.46 | -2.39 | 0.26 | 0.35 | -2.06 | -2.76 |
| comp74866_c0 | 1120 | Pleiotropic drug resistance protein 2 (PDR) | -2.13 | -2.66 | 0.15 | -0.37 | -2.45 | -2.32 |
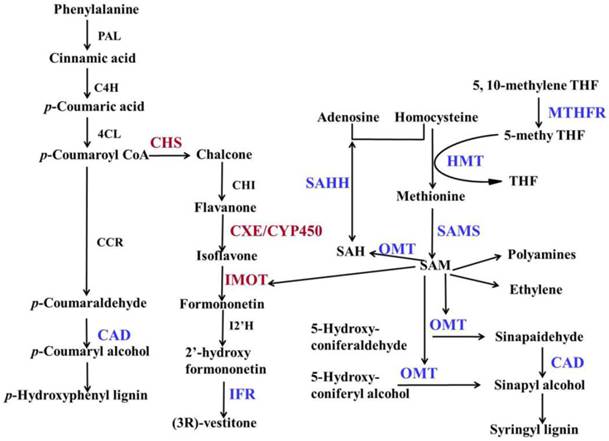
DEGs and DEPs in the phenylpropanoid biosynthetic pathway. Modified biosynthesis pathways of lignin and flavonoid (Moffatt et al., 2002; Piślewska et al., 2002; Bonawitz and chapple, 2010; Dao et al., 2011; Vanholme et al., 2010; Rípodas et al., 2013; Tang et al., 2014). PAL: phenylalanine ammonia-lyase; C4H: cinnamate 4-hydroxylase; 4CL: 4-coumarate:CoA ligase; IFR: isoflavone reductase; CCR: cinnamoyl CoA reducatase; CAD: Cinnamyl alcohol dehydrogenase; SAHH: S-adenosyl- L -homocysteine hydrolase; MTHFR: methylenetetrahydrofolate reductase; HMT: homocysteine methyltransferase; SAMS: S-adenosyl-methionine synthase; OMT: O-methyltransferase; SAM: S-adenosyl-L-methionine; SAH: S-adenosyl-L-homocysteine; THF: tetrahydrofolate; CHI: chalcone flavanone isomerase; IOMT: isoflavone-7-O-methyltransferase; CXE: carboxylesterase; CYP450: cytochrome P450; I2'H: isoflavone 2'-hydroxylase. Red represented up-regulation, blue represented down-regulation in DPW.
qRT-PCR validation of the expression levels of 10 DEGs from RNA-Seq. Bars represented standard errors from three biological replicates. Asterisks represented significant differences between DPW and HPW. The data analysis and figures were obtained using SigmaPlot 12.0.
Protein identification using four databases
Proteins were identified based on having at least one peptide with Unused ProtScore ≥ 1.3 (with a confidence of ≥ 95%). A total of 2,028 (Additional file 2) unique proteins were identified from the deduced protein database (DPD) of the chimera using BLASTx. Meanwhile, 1,592 proteins with two or more high-confidence peptides were used to further select dwarfism-related DEPs (the identified peptide information was listed in Additional file 3).
Dwarfism-related DEPs
Likely as dwarfism-related DEGs, the values of dwarfism-related DEPs in H-L/D-L, H-L/D-S, H-S/D-S, H-S/D-L must be ≥ 2 or ≤ 0.5 with P ≤ 0.05; in H-L/H-S and D-L/D-S, they must be between 0.5 and 2. Based on these criteria, 12 proteins (6 down-regulated and 6 up-regulated in DPW) were identified as dwarfism-related DEPs (Table 2). 6 DEPs, cinnamyl alcohol dehydrogenase (CAD), O-methyltransferase (OMT), methylenetetrahydrofolate reductase (MTHFR), homocysteine methyltransferase (HMT), S-adenosyl-methionine synthase (SAMS), and S-adenosyl-L-homocysteine hydrolase (SAHH), were mainly functioned in S-adenosyl-methionine (SAM) metabolism (Table 2, Fig. 3). Three DEPs, pyruvate decarboxylase isozyme 1 (PDC), beta-glucosidase 34 (β-GLU34) and endoglucanase 18 (EGL), were involved in the cellulose metabolism. Three other DEPs, 2 histone H1 proteins and a peroxidase 40, were up-regulated in DPW.
Dwarfism-related DEPs.
| Protein ID | Protein name | Up a | No. b | Fold Change of proteins | |||||||||||
|---|---|---|---|---|---|---|---|---|---|---|---|---|---|---|---|
| H-L/H-S | H-L/D-L | H-L/D-S | H-S/D-L | H-S/D-S | D-L/D-S | ||||||||||
| R | P | R | P | R | P | R | P | R | P | R | P | ||||
| Phenylpropanoid metabolism | |||||||||||||||
| comp68138_c0 | S-adenosylmethionine synthase 3 (SAMS) | 45.18 | 60 | 1.22 | 0.53 | 4.61 | 0.00 | 7.18 | 0.00 | 3.80 | 0.00 | 5.97 | 0.00 | 1.60 | 0.09 |
| comp73084_c0 | Homocysteine methyltransferase (HMT) | 110.45 | 174 | 1.05 | 0.27 | 4.21 | 0.00 | 2.51 | 0.00 | 4.06 | 0.00 | 2.33 | 0.00 | 0.56 | 0.50 |
| comp65209_c1 | Cinnamyl alcohol dehydrogenase 2 (CAD) | 24.59 | 18 | 0.70 | 0.10 | 2.58 | 0.04 | 2.17 | 0.03 | 3.77 | 0.00 | 3.10 | 0.00 | 0.81 | 0.91 |
| comp72713_c2 | Adenosylhomocysteinase (SAHH) | 72.97 | 121 | 0.77 | 0.81 | 4.88 | 0.00 | 4.74 | 0.01 | 7.18 | 0.00 | 6.55 | 0.00 | 0.86 | 0.16 |
| comp62983_c0 | Isoflavone-7-O-methyltransferase 9 (IOMT) | 13.22 | 11 | 0.62 | 0.86 | 0.15 | 0.04 | 0.11 | 0.01 | 0.22 | 0.01 | 0.16 | 0.00 | 0.69 | 0.16 |
| comp67038_c0 | Methylenetetrahydrofolate reductase 1 (MTHFR) | 52.02 | 39 | 1.41 | 0.11 | 3.53 | 0.00 | 3.19 | 0.00 | 2.51 | 0.00 | 2.27 | 0.00 | 0.87 | 0.09 |
| Cellulose metabolism | |||||||||||||||
| comp69483_c0 | Pyruvate decarboxylase isozyme 1 (PDC) | 29.22 | 24 | 0.57 | 0.16 | 0.24 | 0.00 | 0.28 | 0.00 | 0.41 | 0.00 | 0.47 | 0.02 | 1.14 | 0.20 |
| comp66813_c0 | Beta-glucosidase 34 (β-GLU34) | 30.81 | 25 | 0.76 | 0.49 | 0.30 | 0.03 | 0.14 | 0.00 | 0.38 | 0.01 | 0.18 | 0.00 | 0.46 | 0.00 |
| comp73196_c0 | Endoglucanase 18 (EGL) | 6.69 | 4 | 1.06 | 0.91 | 3.22 | 0.04 | 2.96 | 0.02 | 2.96 | 0.03 | 2.75 | 0.02 | 0.90 | 0.96 |
| Other | |||||||||||||||
| comp67069_c0 | Histone H1 | 9.28 | 5 | 0.81 | 0.53 | 0.14 | 0.01 | 0.17 | 0.01 | 0.18 | 0.01 | 0.21 | 0.02 | 1.17 | 0.60 |
| comp64494_c0 | Histone H1 | 8.24 | 6 | 1.16 | 0.82 | 0.34 | 0.01 | 0.37 | 0.04 | 0.29 | 0.01 | 0.32 | 0.03 | 1.10 | 0.35 |
| comp80135_c0 | Peroxidase 40 | 14.36 | 9 | 0.86 | 0.67 | 0.06 | 0.00 | 0.06 | 0.00 | 0.07 | 0.00 | 0.06 | 0.00 | 0.93 | 0.79 |
Note: a: UP, Unused ProtScore; b: No., Number of distinct peptides (confidence ≥ 95%).
Different lignin, cellulose and flavonoid contents in DPW and HPW at the stem elongation
Since 6 DEGs involved in flavonoid metabolism, 6 DEPs involved in SAM/lignin metabolism, and 5 DEGs and 3 DEPs involved in cellulose metabolism, the contents of flavonoid, cellulose and lignin should be differences between DPW and HPW.
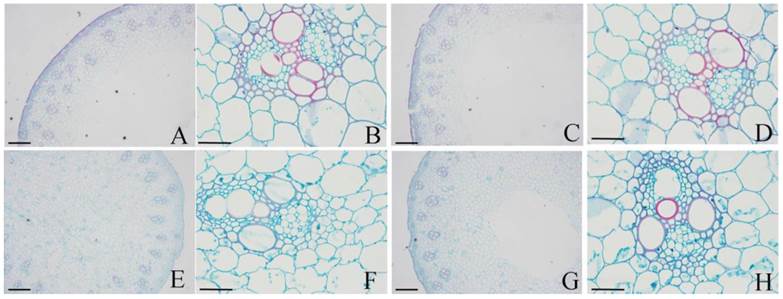
Under photoperiod treatments, the epidermis (Fig. 5A and C) and xylem (Fig. 5B and D) were stained red with safranin O in both H-L (Fig. 5A-B) and H-S (Fig. 5C-D). These results indicated that the lignification of these tissues and the lignin contents of H-L and H-S were similar. However, in both D-L (Fig. 5E-F) and D-S (Fig. 5G-H), only protoxylem vessels were stained red with safranin O, while other tissues were stained green with fast green FCF. These results indicated that the lignin contents of H-L and H-S were higher than that in D-L or D-S.
Histochemical staining of lignin in DPW and HPW stems under photoperiod treatments. Cross sections of stems were collected from the second internode. A-B: H-L; C-D: H-S; E-F: D-L; G-H: D-S. Cross-sectional images of A, C, E and G were captured at 10 µm; B, D, F and H were captured at 40 µm. Lignin was stained red by afranin O.
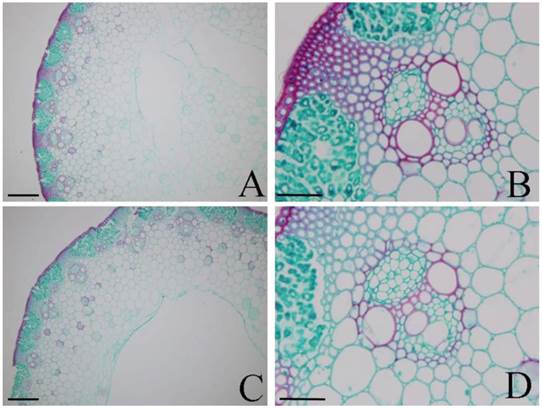
To validate that the different lignin contents between DPW and HPW were not caused by photoperiod treatments, we also analyzed the lignin contents in both DPW and HPW during stem elongation under a normal growth season. The epidermis, xylem vessels and tissues around vascular bundles in HPW were stained red with safranin O (Fig. 6A-B); the xylem vessels were stained red, while the epidermis and tissues around vascular bundles in DPW were weakly stained (Fig. 6C-D). Furthermore, the difference in lignin content between DPW and HPW was confirmed by the content of Klason lignin, which was significantly lower in DPW than that in HPW (Fig. 7A). Further analysis indicated that the significantly lower syringyl lignin (S type) content in DPW than that in HPW caused the different lignin content between DPW and HPW (Fig. 7B), as the contents of guaiacyl (G type) and p-hydroxyphenyl (H type) were similar between DPW and HPW (Fig. 7B).
Histochemical staining of lignin in DPW and HPW stems under normal growth season. Cross sections of stems were collected from the second internode. A-B: HPW; C-D: DPW. Lignin was stained red by afranin O. Images of A and C were captured at 10 µm; images of A and C were captured at 40 µm.
Klason lignin, lignin monomer, cellulose, hemicellulose, and flavonoid contents. Asterisks represented significant differences between DPW and HPW. The data analysis and figures were obtained using SigmaPlot 12.0.
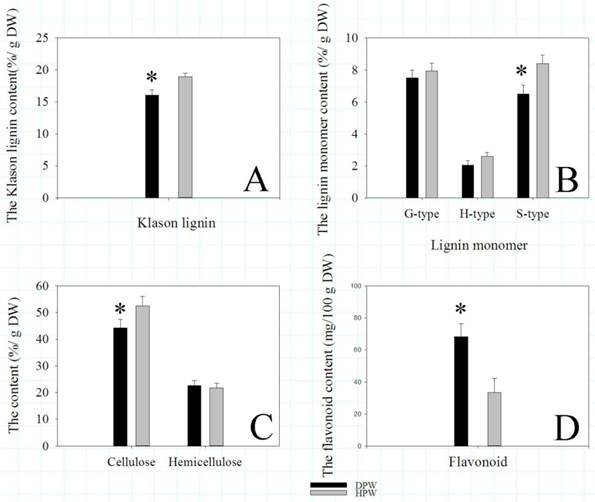
Likely as several DEGs and DEPs involved in cellulose metabolism, the content of cellulose in DPW was significantly lower than that in HPW (Fig. 7C). However, the contents of hemicellulose were similar (Fig. 7C). Meanwhile, as some DEGs and a DEP involved in flavonoid metabolism, the content of flavonoid in DPW was significantly higher than that in HPW (Fig. 7D).
Cell size in DPW and HPW stems
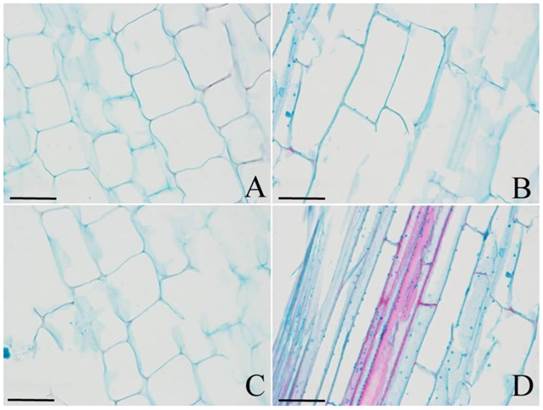
The regulation of cell division and/or cell expansion determines the final morphology of plant organs. To understand which mechanism causes the dwarfism in DPW, or if both do, the cell number and size were observed. As shown in Fig. 8, the size of longitudinal cells in DPW (Fig. 8A) was significantly smaller than that in HPW (Fig. 8B) during stem elongation; meanwhile, photoperiod treatments also did not affect cell size in HPW (Fig. 8C) and DPW (Fig. 8D). These results indicated that Rht-dp caused dwarfism in DPW by limiting cell expansion.
The cell size of DPW and HPW stems. Longitudinal sections of stems were collected from the second internode. A and C: DPW; B and D: HPW. A and B: at the stage of stem elongation under normal growth season; C and D: at stem elongation under photoperiod treatments. The image scales were 40 µm.
Discussion
Because wheat has a larger genome and lacks complete genomic sequencing information, RNA-Seq has been widely used in wheat and its relative species [70-72, 46-47]. In this study, 102,876 DPW (Additional file 1), 98,455 HPW (Additional file 2) and 124,395 chimeric (Additional file 3) unigenes were assembled, which was less than the 140,118 unigenes of T. turgidum [48]. To yield high-quality annotated unigenes, approximately 50% of unigenes with E-values ≤ 1e-6 were not functionally annotated using BLASTX. As proposed by Krasileva et al. [48], these unigenes should be (1) wheat-specific genes and rapidly evolving gene families, (2) expressed pseudogenes that have accumulated too many mutations, (3) non-coding transcribed sequences, (4) pieces of 5' and 3' UTRs, and (5) general assembly artifacts.
Different dwarfing genes have different phenotypic effects. The semi-dwarfing gene sd37 generates shorter internodes in mutant rice than that in wild type [10]. Compared with HPW, Rht-dp caused dwarfism in DPW by reducing internode number (Fig. 2A and B) and limiting cell expansion (Fig. 8), which was unexpected as sd37 in rice [10] and Rht22 in T. turgidum [40] cause shorter internodes by reducing cell number. However, some dwarfing genes in rice or Arabidopsis cause dark green and erect leaves, short seeds and small panicles [6-10]. Compared with HPW, although DPW had dark green and erect leaves (Fig. 2D), shorter glume (Fig. 2C), narrower seeds (Fig. 2E), lighter seed weight (Fig. 2F), and shorter coleoptile and smaller seedling leaf area [43], the dark green and erect leaves and the narrower seeds were not associated with the dwarfism in the F2 population (Fig. 2D and E). These results indicate that Rht-dp has no effect on leaves and seeds and also has a different dwarfing mechanism.
Some GA-sensitive dwarfing plants such as rsg dwarfing tobacco [17] and Rht12 dwarfing wheat [73] can be restored by the application of exogenous GA. BR-sensitive dwarfing plants such as d2 [6] and d11 [7] dwarfing rice also can be restored by exogenous BL. However, likely as other phytohormones-insensitive dwarfing genes, Rht-dp was GA- [43], BL-, ABA-, CK- and auxin-insensitive (Fig. 2H), suggesting that Rht-dp might disturb the biosynthesis, signaling or transport of one or more of these or other phytohormones (e.g., strigolactones and SA) [28-30] as well as other non-phytohormones such as phenylpropanoid metabolism [32-33, 36, 74]. However, photoperiods can regulate the signaling and transport of several phytohormones (GA, CK, BR, ABA and auxin) to mediate plant growth and development [75-76]. Meanwhile, a photoperiod-sensitive dwarf (Psd1) causes dwarfism in rice by disturbing cell division and elongation [69]. In contrast, Rht-dp was a photoperiod-insensitive gene (Fig. 2G), but the possibility of involvement in the signaling or transport of GA, CK, BR, ABA or auxin cannot be excluded. Therefore, stems collected from photoperiod treatments were used for transcriptomic and proteomic analysis to reveal the dwarfing mechanism.
In vascular plants, the phenylpropanoid pathway including lignin, flavonoid and ethylene biosynthesis is involved in many physiological processes [31-32]. Previous studies indicated that the knockout or knockdown of one or more genes of the phenylpropanoid pathway, such as CAD and COMT [33], cause dwarfism through the reduction of lignin content. Lignin, as a complex aromatic polymer, is mainly present in secondarily thickened cell walls to provide strength, rigidity and hydrophobicity [77-78]. Compared with HPW, the expression levels of CAD (DEP) and OMT (DEG) were down-regulated in DPW, which was consistent with the lower lignin content in stems based on histochemical staining (Fig. 5 and 6) and Klason lignin and monomer analysis (Fig. 7A-B). Therefore, we proposed that the mechanism of dwarfism of DPW was related to lignin biosynthesis during stem elongation.
S-adenosyl-L-methionine (SAM), a precursor of ethylene and polyamines and a methyl group donor for protein and DNA methylation reactions [79], regulates numerous cellular functions. As key biosynthesis enzymes, the knockdown of MTHFR, HMT or SAMS decrease SAM content [80-82] which provide the methyl donor to OMT in lignin biosynthesis, finally significantly decrease lignin content [80, 82]. Importantly, in addition to SAM decrease, the knockdown of SAMS also causes dwarfism in rice [83]. Meanwhile, the knockdown of SAHH in tobacco causes dwarfism with increasing CK and S-adenosyl-L-homocysteine (SAH) content [33, 84] which is a by-product from SAM-dependent methylation reactions that competitively inhibit SAM-dependent transmethylation [34]. Compared with HPW, the proteins of MTHFR, HMT, SAMS and SAHH were down-regulated in DPW. These results suggested an increase in SAH and decrease in SAM content, which would cause a decrease in OMT methylation reactions (Table 1) in lignin biosynthesis or a decrease of ethylene and polyamines. Plant polyamines play important roles in a wide range of developmental processes, such as stem elongation. Increasing reports have indicated that the disrupted polyamine biosynthesis limits stem elongation and thus causes dwarfism [85-88]. Meanwhile, up-regulated arginine decarboxylase (ADC) was observed in DPW (Additional file 1). Interestingly, overexpression of ADC changes polyamine content and causes dwarfism in tobacco [85]. Therefore, we did not exclude disrupted polyamine biosynthesis as a possible dwarfing mechanism.
Previous studies have indicated that CHS induction or IOMT overexpression increases flavonoid content [37, 89-91]. IOMT consumes SAM and produces SAH [89]. Meanwhile, CEX (2-hydroxyisoflavanone dehydratase, HID), IFR and CYP450 (2-hydroxyisoflavanone synthase, IFS) are also key enzymes in flavonoid biosynthesis [92-94]. Compared with HPW, the expression levels of 2 CHS, CEX, CYP450 and IOMT were up-regulated in DPW, which caused the flavonoid content to be higher in DPW than that in HPW (Fig. 7D), and might result in low SAM and more SAH in DPW. Plant flavonoids, inhibited the activity of some ABC transporters (ABCB family and PDR) that act as auxin transporters [95-98], can regulate cellular auxin efflux and, consequently, auxin polar transport [37, 96, 99-100]. Auxin polar transport is crucial in the regulation of growth processes such as cell division and cell expansion [98, 101-102], which are important in dwarfism [25-27]. As flavonoid content increased (Fig. 7D), ABCB2 and PDR transcripts were down-regulated in DPW (Table 1), thus inhibiting auxin transport and causing dwarfism [37]. However, IFR, also involved in isoflavonoid biosynthesis, was down-regulated in DPW; this was similar to the mechanism by which knockdown of IFR caused dwarfing Phaseolus vulgaris [94].
To grow, plants need to loosen their primary cell walls to achieve cell expansion [103-104]. Several studies have indicated that directed cell expansion is dependent on the synthesis and deposition of cellulose [104-107] which is a major component of the cell wall [108]. Cellulose is completely hydrolyzed by exoglucanase, EGL and β-GLU [109]. Meanwhile, several proteins located in the cell wall, such as EXPA and XTH, remodel and disassemble the cellulose and xylogucan framework, thereby increasing cell wall extensibility and regulating growth and development [103-104, 110-113]. EXPA loosens cell walls, and cell extension is activated by auxin [114-115]. EGL, EXPA10, EXPA7 and XTH were down-regulated in DPW (Table 1 and 2), which reduced cellulose content (Fig. 7C, 104, 116). Additionally, auxin transport was inhibited by the increase of flavonoids (Fig. 7D) and the down-regulation of ABC transporters (Table 1). As such, the cell wall extensibility was reduced, limiting cell expansion (Fig. 8), consequently shortening stems and causing dwarfism (Fig. 2A, 2B and 2G).
In summary, our findings suggest that Rht-dp, involved in the phenylpropanoid pathway, reduces the contents of lignin, cellulose and SAM, and increases the contents of flavonoid and SAHH, then may limit auxin transport and reduce extensibility of the cell wall, finally limits cell expansion and causes dwarfism in DPW. It will provide a great help to understand the new dwarf mechanism in DWP and perform further researches that fine mapping, clone and functioned analysis of Rht-dp.
Supplementary Material
Additional File 1The detail information of dwarfism-related DEGs.
The detail information of believed proteins identified from iTARQ.
The detail peptide information of dwarfism-related DEPs.
Supplementary Table 1 - qRT-PCR primers for the normalization of DEGs.
Acknowledgements
The authors thank the National Natural Science Foundation of China (grant no. 31301349, 31270243 and 31470305), the Bureau of Science and Technology and the Bureau of Education of Sichuan Province, China.
Competing Interests
The authors have declared that no competing interest exists.
References
1. Hargrove TR, Cabanilla VL. The impact of semi-dwarf varieties on Asian rice-breeding programs. Bioscience. 1979;29:731-735
2. Khush GS. Green revolution: preparing for the 21st century. Genome. 1999;42:646-655
3. Peng J, Richards DE, Hartley NM. et al. 'Green revolution' genes encode mutant gibberellin response modulators. Nature. 1999;400:256-261
4. Sasaki A, Ashikari M, Ueguchi-Tanaka M. et al. Green revolution: a mutant gibberellin-synthesis gene in rice. Nature. 2002;416:701-702
5. Spielmeyer W, Ellis MH, Chandler PM. Semi-dwarf (sd-1), “green revolution” rice, contains a defective gibberellin 20-oxidase gene. Proc Natl Acad Sci USA. 2002;99:9043-9048
6. Hong Z, Ueguchi-Tanaka M, Umemura K. et al. A rice brassinosteroid-deficient mutant, ebisu dwarf (d2), is caused by a loss of function of a new member of cytochrome P450. Plant Cell. 2003;15:2900-2910
7. Tanabe S, Ashikari M, Fujioka S. et al. A novel cytochrome P450 is implicated in brassinosteroid biosynthesis via the characterization of a rice dwarf mutant, dwarf11, with reduced seed length. Plant Cell. 2005;17:776-790
8. Takahashi N, Nakazawa M, Shibata K. et al. Shk1-D, a dwarf Arabidopsis mutant caused by activation of the CYP72C1 gene, has altered brassinosteroid levels. Plant Cell. 2005;42:13-22
9. Gao Z, Qian Q, Liu X. et al. Dwarf 88, a novel putative esterase gene affecting architecture of rice plant. Plant Mol Biol. 2009;71:265-276
10. Zhang J, Liu X, Li S. et al. The rice semi-dwarf mutant sd37, caused by a mutation in CYP96B4, plays an important role in the fine-tuning of plant growth. Plos ONE. 2014;9:e88068
11. Pearce S, Saville R, Vaughan SP. et al. Molecular characterization of Rht-1 dwarfing genes in hexaploid wheat. Plant Physiol. 2011;157:1820-1831
12. Itoh H, Tatsumi T, Sakamoto T. et al. A rice semi-dwarf gene, Tan-Ginbozu (D35), encodes the gibberellin biosynthesis enzyme, ent-kaurene oxidase. Plant Mol Biol. 2004;54:533-547
13. Jia Q, Zhang J, Westcott S. et al. GA-20 oxidase as a candidate for the semidwarf gene sdw1/denso in barley. Funt Inegr Genomic. 2009;9:255-262
14. Barboza L, Effgen S, Alonso-Blanco C. et al. Arabidopsis semidwarfs evolved from independent mutantions in GA20ox1, ortholog to green revolution dwarf alleles in rice and barley. Proc Natl Acad Sci USA. 2013;110:15818-15823
15. Muangprom A, Thomas SG, Sun TP. et al. A novel dwarfing mutation in a green revolution gene from Brassica rapa. Plant Physiol. 2005;137:931-938
16. Ordonio RL, Ito Y, Hatakeyama A. et al. Gibberellin deficiency pleiotropically induces culm bending in sorghum: am insight into sorghum semi-dwarf breeding. Sci Rep. 2014;4:5287
17. Fukazawa J, Sakai T, Ishida S. et al. REPRESSION OF SHOOT GROWTH, a bZIP transcriptional activator, regulates cell elongation by controlling the level of gibberellins. Plant Cell. 2000;12:901-915
18. Yamamuro C, Ihara Y, Wu X. et al. Loss of function of a rice brassinosteroid insensitive1 homolog prevents internode elongation and bending of the lamina joint. Plant Cell. 2000;12:1591-1606
19. Hong Z, Ueguchi-Tanaka M, Shimizu-Sato S. et al. Loss-of-function of a rice brassinosteroid biosynthetic enzyme, C-6 oxidase, prevents the organized arrangement and polar elongation of cells in the leaves and stem. Plant J. 2002;32:495-508
20. Choe S, Tanaka A, Noguchi T. et al. Lesions in the sterol Δ reductase gene of Arabidopsis cause dwarfism due to a block in brassinosteroid biosynthesis. Plant J. 2000;21:431-443
21. Noguchi T, Fujioka S, Choe S. et al. Biosynthetic pathways of brassinolide in Arabidopsis. Plant Physiol. 2000;124:201-209
22. Yin Y, Wang ZY, Mora-Garcia S. et al. BES1 accumulates in the nucleus in response to brassinosteroids to regulate gene expression and promote stem elongation. Cell. 2002;109:181-191
23. Sazuka T, Kamiya N, Nishimura T. et al. A rice tryptophan deficient dwarf mutant, tdd1, contains a reduced level of indole acetic acid and develops abnormal flowers and organless embryos. Plant J. 2009;60:227-241
24. Aya K, Hobo T, Sato-Izawa K. et al. A novel AP2-type transcription factor, SAMLL ORGAN SIZE1, controls organ size downstream of an auxin signaling pathway. Plant Cell Physiol. 2014;55:897-912
25. Parvathaneni RK, Jakkula V, Padi FK. et al. Fine-mapping and identification of a candidate gene underlying the d2 dwarfing phenotype in Pear Millet, Cenchrus americanus (L.) Morrone. G3: Genes Genom Genet. 2013;3:563-572
26. Multani DS, Briggs SP, Chamberlin MA. et al. Loss of an MDR transporter in compact stalks of maize br2 and sorghum dw3 mutant. Science. 2003;302:81-84
27. Dai Y, Fu Z, Li J. Isolation and characterization of an Arabidopsis bush and dwarf mutant. Acta Bot Sin. 2003;45:621-625
28. Suarez-Rodriguez MC, Adams-Phillips L, Liu Y. et al. MEKK1 is required for flg22-induced MPK4 activation in Arabidopsis plants. Plant Physiol. 2007;143:661-669
29. Lin H, Wang R, Qian Q. et al. DWARF27, an iron-containing protein required for the biosynthesis of strigolactones, regulates rice tiller bud outgrowth. Plant Cell. 2009;21:1512-1525
30. Jiang L, Liu X, Xiong G. et al. DWARF 53 acts as a repressor of strigolactone signaling in rice. Nature. 2013;504:401-405
31. Dixon RA, Paiva NL. Stress-induced phenylpropanoid metabolism. Plant Cell. 1995;7:1085-1097
32. Song J, Wang Z. RNAi-mediated suppression of the phenylalanine ammonia-lyase gene in Salvia miltiorrhiza causes abnormal phenotypes and a reduction in rosmarinic acid biosynthesis. J Plant Res. 2011;124:183-192
33. Tanaka H, Masuta C, Uehara K. et al. Morphological changes and hypomethylation of DNA in transgenic tobacco expressing antisense RNA of the S-adenosyl-L-homocysteine hydrolase gene. Plant Mol Biol. 1997;35:981-986
34. Moffatt BA, Stevens YY, Allen MS. et al. Adenosine kinase deficiency is associated with developmental abnormalities and reduced transmethylation. Pant Physiol. 2002;128:812-821
35. Schoor S, Farrow S, Blaschke H. et al. Adenosine kinase contributes to cytokinin interconversion in Arabidopsis. Plant Physiol. 2011;157:659-672
36. Trabucco GM, Matos DA, Lee SJ. et al. Functional characterization of cinnamyl alcohol dehydrogenase and caffeic acid O-methyltransferase in Brachypodium distachyon. BMC Biotech. 2013;13:61
37. Besseau S, Hoffmann L, Geoffory P. et al. Flavonoid accumulation in Arabidopsis repressed in lignin synthesis affects auxin transport and plant growth. Plant Cell. 2007;19:148-162
38. Konzak CF. Mutations and mutation breeding. In: (ed.) Heyne EG. wheat and wheat improvement, 2nd ed. Madison: Wisconsin. 1987:428-443
39. Watanabe N. Triticum polonicum IC12196: a possible alternative source of GA3-insensitive semi-dwarfism. Cereal Res Commun. 2004;32:429-434
40. Peng ZS, Li X, Yang ZJ. et al. A new reduced height gene found in the tetraploid semi-dwarf wheat landrace Aiganfanmai. Genet Mol Res. 2011;10:2349-2357
41. Haque MA, Martinek P, Kobayashi S. et al. Microsatellite mapping of genes for semi-dwarfism and branched spike in Triticum durum Desf. var. ramosoobscurum Jakubz. “Vetvistokoloskaya”. Genet Resour Crop Evol. 2012;59:831-837
42. Kang HY, Lin LJ, Song ZJ. et al. Identification, fine mapping and characterization of Rht-dp, recessive wheat dwarfing (reduced height) gene derived from Triticum polonicum. Genes & Genomic. 2012;34:509-515
43. Song ZJ, Kang HY, Zhou YH. Genetic analysis on gibberellin acid insensitively gene in dwarfing polish wheat. J Triticeae Crops. 2007;27:425-427
44. Wang Y, Wang C, Zhang H. et al. Genetic analysis of wheat (Triticum aestivum L.) and related species with SSR markers. Genet Resour Crop Evol. 2013;60:1105-1117
45. Michalcová V, Dušinskŷ R, Sabo M. et al. Taxonomical classification and origin of Kamut® wheat. Plant Syst Evol. 2014;300:1749-1757
46. Duan J, Xia C, Zhao G. et al. Optimizing de novo common wheat transcriptome assembly using short-read RNA-Seq data. BMC Genomics. 2012;13:392
47. Schreiber AW, Hayden MJ, Forrest KL. et al. Transcriptome-scale homoeolog-specific transcript assemblies of bread wheat. BMC Genomics. 2012;13:492
48. Krasileva KV, Buffalo V, Bailey P. et al. Separating homeologs by phasing in the tetraploid wheat transcriptome. Genome Biol. 2013;14:R66
49. Zhang XM, Zhao L, Larson-Rabin Z. et al. De Novo sequencing and characterization of the floral transcriptome of Dendrocalamus latiflorus (Poaceae: Bambusoideae). Plos ONE. 2012;7:e42082
50. Peng Z, Wanf M, Li F. et al. A proteomic study of the response to salinity and drought stress in an introgression strain of bread wheat. Mol Cellular Proteomics. 2009;8:2676-2686
51. Guo G, Ge P, Ma C. et al. Comparative proteomic analysis of salt response proteins in seedling roots of two wheat varieties. Proteomics. 2012;75:1867-1885
52. Ge P, Hao P, Cao M. et al. iTRAQ-based quantitative proteomic analysis reveals new metabolic pathways of wheat seedling growth under hydrogen peroxide stress. Proteomics. 2013;13:3046-3058
53. Looso M, Preussner J, Sousounis K. et al. A de novo assembly of the newt transcriptome combined with proteomic validation identifies new protein families expressed during tissue regeneration. Genome Biol. 2013;14:R16
54. Tse WKF, Sun J, Zhang H. et al. Transcriptomic and iTRAQ proteomic approaches reveal novel short-term hyperosmotic stress responsive proteins in the gill of the Japanese (Anguilla japonica). J Proteomics. 2013;89:81-94
55. Karp NA, Huber W, Sadowski PG. et al. Addressing accuracy and precision issues in iTRAQ quantitation. Mol Cell Proteomics. 2010;9:1885-1897
56. Grabherr MG, Haas BJ, Yassour M. et al. Full-length transcriptome assembly from RNA-Seq data without a reference genome. Nautre Biotech. 2011;29:644-652
57. Götz S, García-Gómez JM, Terol J. et al. High-throughput functional annotation and data mining with the Blast2GO suite. Nucleic Acids Res. 2008;36:3420-3435
58. Li B, Dewey CN. RSEM: accurate transcript quantification from RNA-Seq data with or without a reference genome. BMC Bioinformatics. 2011;12:323
59. Mortazavi A, Williams BA, McCue K. et al. Mapping and quantifying mammalian transcriptomes by RNA-Seq. Nature Methods. 2008;5:621-628
60. Ander S, Huber W. Differential expression analysis for sequence count data. Genome Biol. 2010;11:R106
61. Wu Q, Yang A, Zou W. et al. Transcriptional engineering of Escherchia coli K4 for fructosylated chondroitin production. Biotech Progress. 2013;29:1140-9
62. Ruppen I, Grau L, Orenes-Piñero E. et al. Differential protein expression profiling by iTRAQ-two-dimensional LC-MS/MS of human bladder cancer EJ138 cells transfected with the metastasis suppressor KiSS-1 gene. Mol Cellular Proteomics. 2010;9:2276-2291
63. Owiti J, Grossmann J, Gehrig P. et al. iTRAQ-based analysis of changes in the cassava root proteome reveals pathways associated with post-harvest physiological deterioration. Plant J. 2011;67:145-156
64. Wang Y, Wang X, Gu M. et al. Cloning and characterization of four novel SnRK2 genes from Triticum polonicum. Biol Plantarum. 2015;59:211-219
65. Hames B, Ruiz R, Scarlata C. et al. Preparation of samples for compositional analysis. National Renewable Energy Laboratory. 2008 NREL/TP-510-42620
66. Sluiter A, Hames B, Ruiz R. et al. Determination of structural carbohydrates and lignin in biomass. National Renewable Energy Laboratory. 2011 NREL/TP-510-42618
67. Guo D, Chen F, Inoue K. et al. Downregulation of caffeic acid 3-O-methltransferase and caffeoyl CoA 3-O-methyltransferase in transgenic alfalfa. Impacts on lignin structure and implications for the biosynthesis of G and S lignin. Plant Cell. 2001;13:73-88
68. Quettier-Deleu C, Gressier B, Vasseur J. et al. Phenolic compounds and antioxidant activities of buckwheat (Fagopyrum esculentum Moench) hulls and flour. J Ethnopharmacology. 2000;72:35-42
69. Li R, Xia J, Xu Y. et al. Characterization and genetic mapping of a Photoperiod-sensitive dwarf1 locus in rice (Oryza sativa L.). Theor Appl Genet. 2014;127:241-250
70. Cantu D, Pearce SP, Distelfeld A. et al. Effect of the down-regulation of the high grain protein content (GPC) genes on the wheat transcriptome during monocarpic senescence. BMC Genomics. 2011;12:492
71. Pont C, Murat F, Confolent C. et al. RNA-Seq in grain unveils fate of neo- and paleopolyploidization events in bread wheat (Triticum aestivum L.). Genome Biol. 2011;12:R119
72. Pellny TK, Lovegrove A, Freeman J. et al. Cell walls of developing wheat starchy endosperm: comparison of composition and RNA-Seq transcriptome. Plant Physiol. 2012;158:612-627
73. Chen L, Hao L, Condon AG. et al. Exogenous GA3 application can compensate the morphogenetic effects of the GA-responsive dwarfing gene Rht 12 in bread wheat. Plos ONE. 2014;9:e86431
74. Huang J, Gu M, Lai Z. et al. Functional analysis of the Arabidopsis PAL gene family in plant growth, development, and response to environmental stress. Plant Physiol. 2010;153:1526-1538
75. Wolers H, Jürgens G. Survival of the flexible: hormonal growth control and adaptation in plant development. Nat Rev Gent. 2009;10:305-317
76. Sassi M, Wang J, Ruberti I. et al. Shedding light on auxin movement: light-regulation of polar auxin transport in the photocontrol of plant development. Plant Signaling Behavior. 2013;8:e23355
77. Vanholme R, Demedts B, Morreel K. et al. Lignin biosynthesis and structure. Plant Physiol. 2010;153:895-905
78. Bonawitz N, Chapple C. The genetics of lignin biosynthesis: connecting genotype to phenotype. Annu Rev Genet. 2010;44:337-363
79. Roje S. S-Adenosyl-L-methionine: beyond the universal methyl group donor. Phytochemistry. 2006;67:1686-1698
80. Shen B, Li C, Tarczynski MC. High free-methionine and decreased lignin content result from a mutation in the Arabidopsis S-adenosyl-L-methionine synthetase 3 gene. Plant Cell. 2002;29:371-380
81. Lee M, Huang T, Toro-Ramos T. et al. Reduced activity of Arabidopsis thaliana HMT2, a methionine biosynthetic enzyme, increases seed methionine content. Plant J. 2008;54:310-320
82. Tang HM, Liu S, Hill-Skinner S. et al. The maize brown midrib (bm2) gene encodes a methylenetetrahydrofolate reductase that contributes to lignin accumulation. Plant J. 2014;77:380-392
83. Li W, Han Y, Tao F. et al. Knockdown of SAMS genes encoding S-adenosyl-L-methionine synthetases causes methylation alterations of DNAs and histones and leads to late flowering in rice. J Plant Physiol. 2011;168:1837-1843
84. Masuta C, Tanaka H, Uehara K. et al. Broad resistance to plant viruses in transgenic plants conferred by antisense inhibition of a host gene essential in S-adenosylmethionine-dependent transmethylation reaction. Proc Natl Acad Sci USA. 1995;92:6117-6121
85. Masgrau C, Altabella T, Farras R. et al. Inducible overexpression of oat arginine decarboxylase in transgenic tobacco plants. Plant J. 1997;11:465-473
86. Imai A, Hanzawa Y, Komura M. et al. The dwarf phenotype of the Arabidopsis acl5 mutant is suppressed by a mutation in an upstream ORF of a bHLH gene. Development. 2006;133:3575-3585
87. Kakehi J, Kuwashiro Y, Niitsu M. et al. Thermospermine is required for stem elongation in Arabidopsis thaliana. Plant Cell Physiol. 2008;49:1342-1349
88. Zhang Y, Wu R, Qin G. et al. Over-expression of WOX1 leads to defects in meristem development and polyamine homeostasis in Arabidopsis. J Intergrat Plant Biol. 2011;53:493-506
89. He XZ, Dixon RA. Genetic manipulation of isoflavone 7-O-methyltransferase enhances biosynthesis of 4'-o-methylated isoflavonoid phytoalexins and disease resistance in alfalfa. Plant Cell. 2000;12:1689-1702
90. Liu CJ, Dixon RA. Elicitor-induced association of isoflavone O-methyltransferase with endomembranes prevents the formation and 7-O-methylation of daidzein during isoflavonoid phytoalexin biosynthesis. Plant Cell. 2001;13:2643-2658
91. Dao TTH, Linthorst HJM, Verpoorte R. Chalcone synthase and its functions in plant resistance. Phytochem Rev. 2011;10:397-412
92. Akashi T, Aoki T, Ayabe S. Cloning and functional expression of a cytochrome P450 cDNA encoding 2-hydroxyisoflavanone synthase involved in biosynthesis of the isoflavonoid skeleton in licorice. Plant Physiol. 1999;121:821-828
93. Akashi T, Aoki T, Ayabe S. Molecular and biochemical characterization of 2-hydroxyisoflavanone dehydratase. Involvement of carboxylesterase-like proteins in Leguminous isoflavone biosynthesis. Plant Physiol. 2005;137:882-891
94. Rípodas C, Dalla Via V, Aguilar OM. et al. Knock-down of a member of the isoflavone reductase gene family impairs plant growth and nodulation in Phaseolus vulgaris. Plant Physiol Biochem. 2013;68:81-89
95. Noh B, Murphy AS, Spalding EP. Multidrug resistance-like genes of Arabidopsis required for auxin transport and auxin-mediated development. Plant Cell. 2001;13:2441-2454
96. Peer WA, Murphy AS. Flavonoids and auxin transport: modulators or regulators? Trends Plant Sci. 2007;12:556-563
97. Cho M, Cho HT. The function of ABCB transporters in auxin transport. Plant Physiol. 2012;159:642-654
98. Xu YX, Liu Y, Chen ST. et al. The B subfamily of plant ATP binding cassette transporters and their roles in auxin transport. Biol Plantarum. 2014;58:401-410
99. Peer WA, Bandyopadhyay A, Blakeslee JJ. et al. Variation in expression and protein localization of the PIN family of auxin efflux facilitator proteins in flavonoid mutants with altered auxin transport in Arabidopsis thaliana. Plant Cell. 2004;16:1898-1911
100. Taylor LP, Grotewold E. Flavonoids as developmental regulators. Curr Opin Plant Biol. 2005;8:317-323
101. Sandberg G, Tarkowski P, Petersson SV. et al. Auxin-cytokinin crosstalk and interaction with other hormones. Biol Plant. 2005;49:s26
102. Teale WD, Paponov I, Palme K. Auxin in action: signalling, transport and the control of plant growth and development. Nat Rev Mol Cell Biol. 2006;7:847-859
103. Choi D, Lee Y, Cho HT. et al. Regulation of expansin gene expression affects growth and development in transgenic rice plants. Plant Cell. 2003;15:1386-1398
104. Zenoni S, Reale L, Tornielli GB. et al. Downregulation of the Petunia hybrida α-expansin gene PhEXP1 reduces the amount of crystalline cellulose in cell walls and leads to phenotypic changes in petal limbs. Plant Cell. 2004;16:295-308
105. Fagard M, Desnos T, Desprez T. et al. PROCUSTE1 encodes a cellulose synthase required for normal cell elongation specifically in roots and dark-grown hypocotyls of Arabidopsis. Plant Cell. 2000;12:2409-2424
106. Schindelman G, Morikami A, Jung J. et al. COBRA encodes a putative GPI-anchored protein, which is polarly localized and necessary for oriented cell expansion in Arabidopsis. Genes Dev. 2001;15:1115-1127
107. Pagant S, Bichet A, Sugimoto K. et al. KOBIO1 encodes a novel plasma membrane protein necessary for normal synthesis of cellulose during cell expansion in Arabidopsis. Plant Cell. 2002;14:2001-2013
108. Liu Y, Liu D, Zhang H. et al. The α- and β-expansin and xyloglucan endotransglucosylase/hydrolase gene families of wheat: molecular cloning, gene expression, and EST data mining. Genomics. 2007;90:516-529
109. Singhania RR, Patel AK, Sukumaran RK. et al. Role and significance of beta-glucosidases in the hydrolysis of cellulose for bioethanol production. Bioresource Technol. 2013;127:500-507
110. Cosgrove DJ. Loosening of plant cell walls by expansins. Nature. 2000;407:321-326
111. Cosgrove DJ. Plant expansins: diversity and interactions with plant cell walls. Current Opin Plant Biol. 2015;25:162-172
112. Miedes E, Suslov D, Vandenbussche F. et al. Xyloglucan endotransglucosylase/ hydrolase (XTH) overexpression affects growth and cell wall mechanics in etiolated Arabidopsis hypocotyls. J Exp Bot. 2013;64:2481-2497
113. Hara Y, Yokoyama R, Osakabe K. et al. Function of xyloglucan endotransglucosylase/hydrolases in rice. Annals Bot. in press
114. McQueen-Mason S, Durachko DM, Cosgrove DJ. Two endogenous proteins that induce cell wall extension in plants. Plant Cell. 1992;4:1425-1433
115. Hager A. Role of the plasma membrane H+-ATPase in auxin-induced elongation growth: Historical and new aspects. J Plant Res. 2003;116:483-505
116. Klose H, Gunl M, Usadel B. et al. Cell wall modification in tobacco by differential targeting of recombinant endoglucanase from Trichoderma reesei. BMC Plant Biol. 2015;15:54
Author contact
![]() Corresponding author: Yonghong Zhou, Fax: +86 028 826 503 50, E-mail address: Zhouyhedu.cn.
Corresponding author: Yonghong Zhou, Fax: +86 028 826 503 50, E-mail address: Zhouyhedu.cn.