Impact Factor ISSN: 1449-2288

 Global reach, higher impact
Int J Biol Sci 2017; 13(8):985-995. doi:10.7150/ijbs.19249 This issue Cite
Research Paper
Intracellular Insulin and Impaired Autophagy in a Zebrafish model and a Cell Model of Type 2 diabetes
Xiang-Hui Meng, Bo Chen, Jing-Pu Zhang ![]()
Laboratory of pharmacology, Institute of Medicinal Biotechnology, Chinese Academy of Medical Sciences and Peking Union Medical College, Beijing, China
Received 2017-1-18; Accepted 2017-5-13; Published 2017-7-18
Abstract

Type 2 diabetes mellitus is characterized by insulin resistance. However, the complete molecular mechanism remains unclear. In this study, zebrafish were fed a long-term high-fat diet to induce type 2 diabetes, which resulted in a higher body weight, body mass index, more lipid vacuoles in liver, increased insulin transcription level in liver, brain and muscle, and high fasting blood glucose in the high-fat diet zebrafish. Oppositely, the transcription levels of insulin substrate-2 and glucose transporter 2 were significantly decreased, indicating insulin signaling pathway and glucose transport impaired in the insulin-targeting tissues. Transcription of the autophagy-related genes, ATG3, ATG4B, ATG5, ATG7, ATG12, and FOXO3, were decreased but autophagy inhibitor gene m-TOR increased, and autophagy-flux was inhibited in liver of the high-fat diet zebrafish. Main of these changes were confirmed in palmitic acid-treated HepG2 cells. Further, in co-immunoprecipitation and subcellular co-localization experiments, the conjunction of preproinsulin with cargo-recognition protein p62 increased, but conjuncts of autophagosome with p62-cargo, lysosomes with p62-cargo, and autolysosomes decreased apparently. Interestingly, lysosomes, autolysosomes and conjuncts of p62-insulin localized at the periphery of palmitic acid-treated cells, the margination of lysosomes may mediate deactivation of proteases activity. These findings suggest that intracellular high-lipid may trigger defective autophagy, defective downstream signaling of insulin and accumulated intracellular preproinsulin, leading to dysregulation of cell homeostasis mechanism, which may be one of reasons involved in insulin-resistance in type 2 diabetes.
Keywords: type 2 diabetes, insulin-targeting tissues, animal models, defective autophagy, subcellular localization, preproinsulin
Introduction
Type 2 diabetes mellitus is a complex metabolic disease with a high global incidence that is associated with hyperglycemia, hyperlipemia, and hyperinsulinemia. The number of patients with diabetes mellitus will reach up to 592 million in 2035 and more than 90% will have type 2 diabetes [1]. Type 2 diabetes, also known as non-insulin-dependent diabetes mellitus, is rapidly spreading around the globe with a prevalence estimated to be 8% worldwide by 2030 [2]. The main etiology of this disease is β-cell dysfunction and insulin resistance, which means “the relative lack of insulin” in insulin target tissues resulting from the failure of β-cells to compensate for insulin resistance [3]. Due to its complexity, the complete mechanism underlying type 2 diabetes remains unclear.
Currently, several mechanisms about type 2 diabetes have been identified or hypothesized. For example, lack of glucose transporters, IRSs or glucose metabolism related enzymes results in failed interaction of insulin with the insulin receptor, causing inhibition of insulin transport and function [4]. Some local and systemic inflammatory mediators, such as tumor necrosis factor alpha (TNF-α), interleukin (IL)-1β and IL-6, can induce insulin resistance by suppressing the insulin signaling pathway [5]. Obesity is also considered a causal risk factor for type 2 diabetes and commonly co-exists with this disorder [6-8]. In fact, insulin resistance is an important link between obesity and type 2 diabetes, because it can be induced by several adipokines/cytokines in adipose tissue [9]. In addition, as a highly inducible intracellular degradation process, autophagy can maintain homeostasis of eukaryotic cells through the turnover of long-lived proteins, cytosolic components, and damaged organelles. It also plays an important role in maintaining β-cell mass and function [10]. Dysregulation of this process causes type 2 diabetes due to the development of insulin resistance through the regulation of mitochondrial function and endoplasmic reticulum (ER) stress [11-17]. However, it is unknown how these events occur in insulin target tissues and cells. The main models used to study type 2 diabetes include mice/rats fed a high-fat diet (HFD) with or without streptozotocin treatment, transgenic diabetic mice/rats, and cellular models of insulin resistance [18,19]. Zebrafish, an established model organism for the study of developmental processes, human disease, and tissue regeneration, has similar pancreatic development and function as mammals and is reportedly a good tool for diabetic research [20-22].
In this study, we researched the correlation between autophagy and intracellular insulin gene expression induced by a HFD or palmitic acid (PA) treatment to determine the molecular events underlying insulin resistance in insulin target tissue cells. To this end, we developed a type 2 diatebes-like model in zebrafish and HepG2 liver carcinoma cells and examined the contribution of autophagic flux and preproinsulin levels in the two models. The results showed that accumulation of intracellular preproinsulin led to formation of a defective autophagic apparatus and dysregulation of glycolipid metabolism.
Results
Long-term HFD induced type 2 diabetes-like symptoms in zebrafish
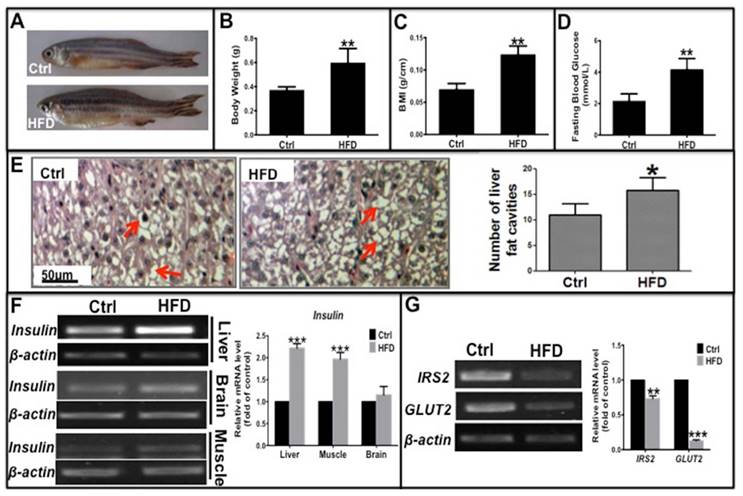
Liver, muscle, and brain are the main target tissues of insulin action, of which the liver is critical for glycolipid metabolism and insulin resistance in type 2 diabetes. To investigate whether a long-term HFD could induce type 2 diabetes in zebrafish, we fed adult zebrafish a HFD for 10 weeks. Then we evaluated several clinical indicators of type 2 diabetes including obesity, fasting blood glucose (FBG) levels, and mRNA expression of glucose metabolism-related genes such as insulin, glucose transporter 2 (GLUT2), and insulin receptor substrate 2 (IRS2). These zebrafish had a significantly higher weight, body mass index (BMI) and more lipid vacuoles in liver cells compared to the normal diet group (Fig. 1A-C, E), demonstrating that a long-term HFD induced obesity in zebrafish compared to those fed a normal diet. In addition, level of fasting blood glucose (FBG) and the mRNA expression level of insulin in its target organs elevated, specially, insulin in the liver and muscle were notably higher in HFD-treated zebrafish than in the normal diet group (Fig. 1D and F). However, transcription levels of key factors downstream of the insulin signaling pathway, namely, IRS2 and GLUT2, were significantly decreased in HFD-treated zebrafish liver (Fig. 1G), indicating that the signaling pathway was impaired in the insulin target cells. These data demonstrate that a long-term HFD not only induced obesity but also induced hyperglycemia-like and hyperinsulinemia-like symptoms in zebrafish, which is in accordance with a study by Oka et al [23]. Thus, an insulin-resistant zebrafish model was established that was subsequently used for our in vivo studies.
Long-term high-fat diet induced Type 2 Diabetes-like symptoms in zebrafish. Adult zebrafish were fed a normal diet (Ctrl) or a high-fat diet (HFD) for 10 weeks. (A)-(C) Comparison of morphology (A), body weight (B), and body mass index (BMI; weight/length, g/cm) (C) between Ctrl and HFD zebrafish. (D) Higher fasting blood glucose induced in the HFD group compared to the normal diet group. (E) Representative images of hematoxylin and eosin (H&E) staining show lipid vesicles in zebrafish liver slices in both groups. The histogram shows the average number of fat cavities per sight field in the control group and HFD group, which were counted from ten sight fields each group. (F) Representative electrophorogram of insulin bands from RT-PCR (left) and real-time qPCR results (right) show the mRNA levels of insulin gene transcription in the liver, brain, and muscle of zebrafish in both groups. (G) The mRNA levels of insulin receptor substrate-2 (IRS-2) and glucose transporter 2 (GLUT2) assayed by RT-PCR electrophorogram (left) and real-time qPCR results (right) in zebrafish liver. *p<0.05, **p<0.01, ***p<0.001 vs the control group.
Autophagy levels were decreased in insulin target tissues in type 2 diabetes zebrafish
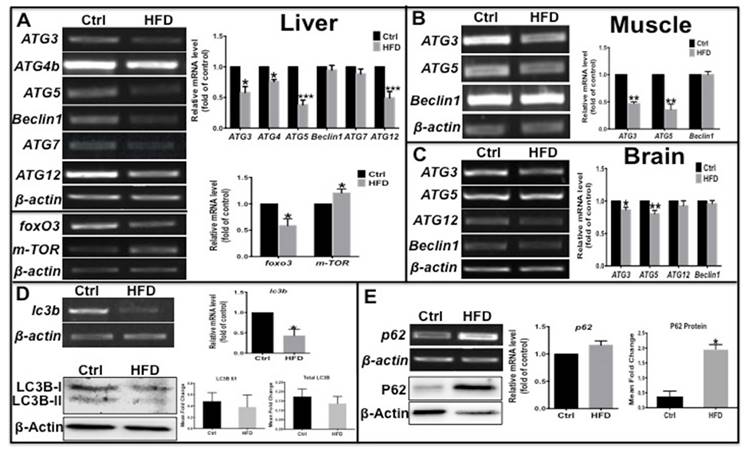
Autophagy can be disrupted by fatty acids [24,25] and regulated by insulin signaling [26], and can maintain β-cell survival and function during diabetes by promoting the clearance of unfolded protein aggregates [10]. Thus, we determined if the autophagy process was also impacted in this zebrafish type 2 diabetes model. The mRNA levels of several autophagy-related genes (ATGs) were examined by real-time qPCR; ATG3, ATG4b, ATG5 and ATG12 in liver, ATG3 and ATG5 in muscle and in brain were significantly decreased, while beclin 1 and ATG7 not notably changed (Fig. 2A-C) in HFD-treated zebrafish compared to the control group. In addition, there were decreased level of FOXO3, an upstream autophagy activator, and increased level of m-TOR, an autophagy inhibitor (Fig. 2A), indicative inhibition of autophagosome formation and autophagy. The microtubule-associated protein light chain 3B (LC3B)-II/I ratio represents the status of autophagosome development and maturation, and p62, also known as sequestosome-1 (SQSTM1), is an autophagy substrate [27]; their comprehensive levels indicate the status of autophagic flux. Thus we examined the expression levels of these autophagy markers, and found that lc3b transcript level was significantly reduced and LC3B-II/I ratio and total LC3B protein level decreased moderately (Fig. 2D). In contrast, there was a slight increase in p62 mRNA levels and a significant increase in protein levels in the liver of HFD-treated zebrafish (Fig. 2E). These results demonstrate that in HFD-treated or type 2 diabetes-like zebrafish, autophagosome formation was impaired due to suppression of pro-autophagy gene transcription and autophagy flux was inhibited. Thus a deficient autophagic process appears to be involved in obesity or type 2 diabetes.
Transcription levels of autophagy related genes were suppressed and autophagic flux was blocked in the type 2 diabetes-like zebrafish. (A)-(C) The transcript levels of autophagy-related genes were assayed in liver (A), muscle (B), and brain (C) tissues in type 2 diabetes zebrafish. Representative electrophorograms of the ATGs bands from RT-PCR (left) and histograms of real-time qPCR results (right) were showed for comparison between the T2D group and the control group. (D) mRNA level of LC3B significantly decreased in real-time qPCR test, and the LC3B-II/I ratio and total LC3 protein levels moderately decreased via western blotting; (E) tested by the same methods, p62 mRNA level moderately increased and its protein levels significantly increased in the liver of HFD-treated zebrafish. *p<0.05, **p<0.01, ***p<0.001 compared with the control group.
Palmitic acid induced type 2 diabetes-like characteristics in HepG2 cells
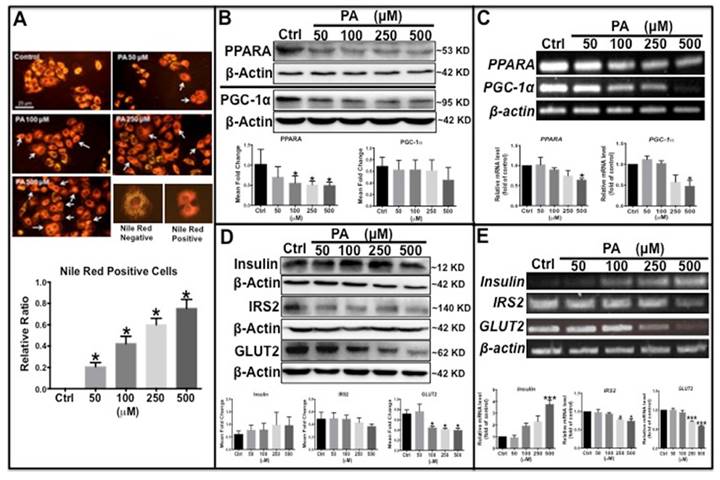
To further clarify the molecular mechanism underlying type 2 diabetes development, a type 2 diabetes-like cellular model was established in HepG2 human liver carcinoma cells. Palmitic acid (PA) is frequently used to induce insulin resistance by inhibiting the insulin signaling pathway [28]. In this study, HepG2 cells were exposed to different concentrations of PA and stained with Nile red to detect intracellular lipid content and glycolipid metabolism-related proteins. The results showed that the number of Nile Red-positive cells with orange-red fluorescence was significantly increased in PA-treated cells in a dose-dependent manner (Fig. 3A). Western blot analysis showed that the protein levels of peroxisome proliferator-activated receptor gamma coactivator 1-alpha (PGC-1α) and peroxisome proliferator-activated receptor alpha (PPARα) decreased with PA treatment in a concentration-dependent (Fig. 3B), similarly, transcription levels of the two genes also decreased significantly (Fig. 3C). Previous studies have reported that PGC-1α and PPARα promote β-oxidation and fatty acid metabolism [29,30]; thus, the observed decreased levels of these two proteins indicates impaired lipid oxidation and metabolism. PA treatment also caused an increase in endogenous preproinsulin protein levels, as determined by Western blot analysis, which showed only one band at approximately 10 kD that matched the molecular weight of the preproinsulin protein; no other insulin bands (including insulin and proinsulin) were detected by the human insulin antibody. Moreover, IRS2 and GLUT2 levels declined synchronously in both transcription and translation (Fig. 3D and E), demonstrating that downstream insulin signaling was impaired by PA treatment. These results are similar to those found in the type 2 diabetes zebrafish.
Palmitic acid induced type 2 diabetes-like features in HepG2 cells. (A) Lipid level was increased in PA concentration-dependent manner in PA-treated cells determined by Nile Red staining. (B) Lipid metabolism-related proteins, PPARα and PGC-1α, were reduced in PA-treated cells. (C) Transcription levels of PPARα and PGC-1α were decreased by PA treatment. (D) Western blot results show that preproinsulin levels increased, and IRS2 and GLUT2 expression decreased in PA-treated cells in a concentration-dependent manner. (E) Transcription levels of insulin elevated and of IRS2 and GLUT2 declined following PA treatment. The upper panel shows representative electrophorogram of the gene bands from RT-PCR and lower panels show the corresponding histograms from real-time qPCR in C and E. *p<0.05, **p<0.01, ***p<0.001 compared with the control group.
Autophagy process was impaired in the type 2 diabetes cell model
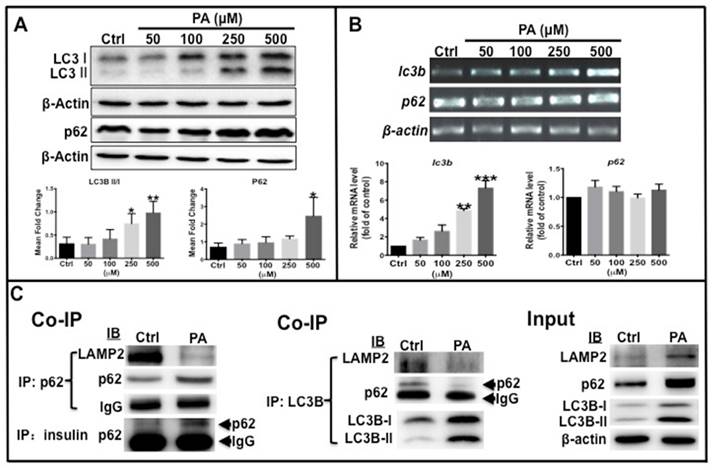
As mentioned above, autophagy levels decreased in HFD-treated zebrafish. Western blot analysis was performed to determine the ratio of LC3B-II/LC3B-I and p62 protein levels in type 2 diabetes-like cells. The results showed that the ratio of LC3B-II /LC3B-I, total LC3B and p62 protein levels increased in a dose-dependent manner with increasing PA concentration (Fig. 4A). Furthermore, the transcription of the two autophagy markers was examined by real-time qPCR, which shows that LC3B mRNA expression significantly increased in PA-treated cells in a concentration-dependent manner, although p62 mRNA level remained unchanged (Fig. 4B). These data illustrate that elevation of total LC3B expression resulted from its increased transcription level, LC3B-II level elevation indicates that PA can promote autophagic vacuole maturation. The increase in p62 levels may be due to accumulation of the p62 cargo loading protein. To determine if the autophagy process was functional or impaired, co-immunoprecipitation (co-ip) was performed to examine the interaction of p62 with LC3B, LAMP2 and insulin. The conjugation of p62 with LAMP2, p62 with LC3B, and the conjugation of LAMP2 with LC3B were clearly decreased in the PA-treated group compared to the control group, although the levels of p62 and LC3B proteins and ratio of LC3B-II/I were higher than those in the control cells (Fig. 4C). Importantly, the conjugation of preproinsulin protein with p62 was increased in PA-treated cells (Fig. 4C). These data suggest that PA can cause impaired autophagosomes lacking p62 cargo proteins and cause redundant preproinsulin-p62 cargos.
Autophagy flux was affected by PA treatment. (A) LC3B-II/I ratio, total LC3B and p62 proteins were increased in PA-dependent manner. (B) Transcription levels of lc3b increased, but p62 was unchanged by PA treatment. The upper panel shows representative electrophorogram of lc3b and p62 bands from RT-PCR and lower panels show the corresponding histograms from real-time qPCR. (C) Co-immunoprecipitation (Co-IP) results indicate that there was decreased association of p62 with LAMP2, p62 with LC3B, and LC3B with LAMP2, but an increased association of p62 with preproinsulin in the PA treatment group. *p<0.05, **p<0.01, ***p<0.001 compared with the control group.
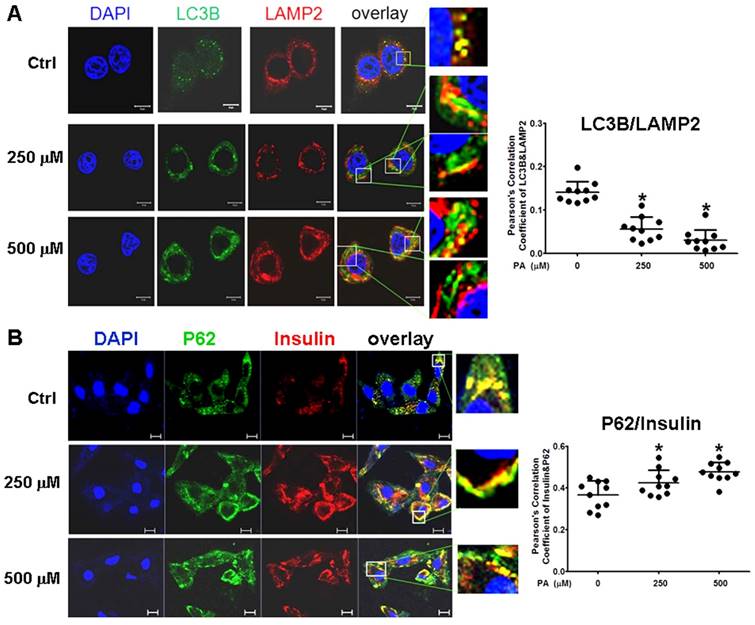
To confirm the results in situ, laser confocal microscopy and Pearson' correlation coefficient analysis were performed to determine the subcellular co-localization of cargo (p62 as the marker) with autophagosomes (LC3B as the marker), cargo with lysosomes (LAMP2 as the marker), and autophagosomes with lysosomes. The results showed that co-localization of p62 with LC3B presented a few regular puncta in the control group, whereas in PA-treated cells the co-localized punctas were more decreased and irregular rod-shaped structures of p62 cargos presented and did not combine with LC3B compared to the control group; correlation of autophagosome with p62 cargo was also reduced in Pearson' correlation coefficients (Fig. 5A). Co-localization experiments between p62 and LAMP2 presented similar rod-shaped structures to that in co-localization of p62 with LC3B, and co-localized puncta significantly decreased (Fig. 5B). Interestingly, the distribution of lysosomes moved from the cytoplasm to the cellular periphery, and the lysosome-p62 cargo (LAMP2-p62) conjugate also lined up together and departed from the nuclei in a PA-concentration dependent manner (Fig. 5B). Accordingly, most of p62 cargo proteins alone occupied the area between the nucleus and cellular periphery. In the experiment of LAMP2-LC3B co-localization, the co-localized punctas were not many in the control group; under PA treatment, the LAMP2-LC3B co-localized puncta was nearly disappeared and most autophagosome particles and lysosome particles were separately distributed in small pieces and rod-like structure in PA concentration-dependent manner (Fig. 6A). These evidences mean that autophagy flux and autophagy were impaired in type 2 diabetes-like HepG2 cells. In contrast, co-localization particles of p62 with "insulin" increased moderately, and other more "insulin" protein, situated in the middle area of cells, did not combine with p62 in type 2 diabetes-like HepG2 cells (Fig. 6B). The results indicate that the storage and irregular structure of both p62-cargo and autolysosomes may correlate with 'preproinsulin" protein accumulation. P62-cargo cannot enter autophagosomes and fail to fuse with lysosomes in PA-treated cells.
Analysis of autophagy flux by subcellular colocalization. (A) Combination of autophagosomes with p62-cargos was disrupted by Palmitic acid treatment. Decrease of co-localized punctas of LC3B-P62 analyzed by Pearson' correlation coefficients, the distribution and structure of autophagosomes (LC3B) and p62 were changed as rod-like shape and departing from the nuclei, separately, in Palmitic acid-treated cells. White arrows indicate conjunction of LC3B with p62-cargos; pink arrows indicate alone p62-cargo aggregates in rod-like shape. (B) Conjugation of lysosomes with p62 was decreased by Palmitic acid treatment. The marginalized distribution and abnormal structure of lysosomes were associated with the irregular p62-cargo, and more unconjuaged p62-cargos situated at the internal cytoplasm in Palmitic acid-treated cells. The open boxes in the overlay pictures are amplified at the right columns. Scale bar = 10 µm. Pearson' correlation coefficient analysis was based on 10 sight fields each group. *p<0.05, **p<0.01 vs control; ## p< 0.01 vs 250 μM PA group.
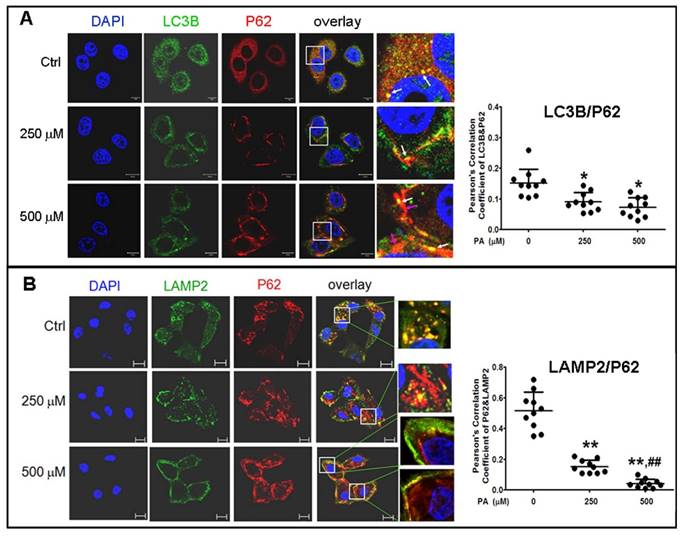
Intracellular insulin was involved in formation of Autophagolysosomes. (A) Formation of Autophagolysosomes was suppressed in Palmitic acid-treated cells. The fusion of lysosomes with autophagosomes was reduced and marginalized, and more aggregates of lysosomes (the red structures) or p62 (the green structures) were separately distributed in PA-treated cells. (B) The association of preproinsulin with p62 was marginalized at the cellular periphery; and some preproinsulin aggregates (the red structures) lonely accumulated in the intermediate area in PA-treated cells. The open boxes in the overlay pictures are amplified at the right columns. Scale bar = 10 µm. Pearson' correlation coefficient analysis was based on 10 sight fields each group. *p<0.05 vs control.
Discussion
Liver and muscle are the two main tissues for the β-oxidation of fatty acids. PPARα can regulate a number of genes that function in hepatic lipid homeostasis, such as fatty acid transport protein, fatty acid translocase, fatty acid binding protein for fatty acid transfer and absorption, and so on [31]. PGC-1α is an important transcriptional coactivator that regulates cellular energy metabolism and plays roles in the inhibition of glyconeogenesis, enhancement of fatty acid oxidation, and suppression of lipid synthesis [32]. In this study, intracellular lipid levels were significantly increased in the liver in the type 2 diabetes-like zebrafish and in the type 2 diabetes-like cells. Meanwhile, both PPARα and PGC-1α protein levels were decreased in PA-treated cells, which demonstrate that hepatic lipid accumulation or a fatty liver induced by a HFD may be associated with deregulation of the signaling pathways involved in lipid metabolism. A study also showed that obesity in zebrafish share common pathophysiological pathways with mammalian obesity [23].
On the other hand, expression of endogenous preproinsulin was increased in PA-treated cells and in the insulin target tissues of HFD zebrafish with elevated FBG. IRS2 and GLUT2 were downregulated in a dose-dependent manner in the models in vitro and in vivo. These results indicate that glycometabolism disorder or type 2 diabetes-like symptoms can also be induced by long-term HFD or by long-chain saturated fatty acid treatment. IRS2 promotes glycogen synthesis in insulin target cells, but its expression can be suppressed and lipogenesis is enhanced by insulin under conditions of hepatic insulin resistance [33]. So, in this study decrease of irs2 transcription hints an occurrence of insulin resistance. As the principal transporter for transfer of glucose between liver and blood, GLUT2 can sense changes in nutrient and can regulate sugar absorbance in insulin target tissues and β-cells [34]. GLUT2 gene expression decreased in vivo and in vitro after HFD and PA treatment, indicating that glucose transfer was inhibited, which may be one cause of insulin resistance and high FBG in type 2 diabetes. Thus, glycometabolism and lipid metabolism are two tightly linked processes that intercommunicate and interact in insulin target cells. Meanwhile, we find that the transcription of some autophagy-related genes decreased in zebrafish, and autophagic flux was inhibited in both HFD zebrafish and PA-treated cells, which is in accordance with data from previous reports [13, 17]. Therefore, insulin resistance is involved in impaired autophagy, which is probably a common causative mechanism that links syndromes of both glycometabolism and lipid metabolism.
It is interesting that intracellular preproinsulin expression was highly induced in non-islet cells such as hepatocytes, muscle cells, and brain cells in HFD fish and PA-treated HepG2 cells relative to their corresponding control groups. We presume that the high levels of preproinsulin may be a compensatory response for insulin resistance, but failed to function in type 2 diabetes animals and in the cell model. There is an attractive relationship between non-islet intracellular insulin gene expression and autophagy in type 2 diabetes models. Recently, Chen's team [35] demonstrated extrapancreatic insulin gene expression in diabetic mice. Several studies reported that postprandial millions of proinsulin disulfide bonds were formed, and isomerization of improper disulfide bonds may be produced into big invalid proteins and accumulation of misfolded proinsulin protein may cause endoplasmic reticulum stress and type 2 diabetes [36, 37]. In our study, the mRNA levels of insulin were highly induced in non-islet cells such as hepatocytes, muscle, and brain in type 2 diabetes zebrafish, and its protein precursor level was higher in PA-treated HepG2 cells than in the control groups. We presume that the high level of “insulin” may be the host cellular compensatory response for the relative insulin shortage induced by high lipid conditions, but the preproinsulin could not be processed into insulin. On the other hand, we found increased particles of preproinsulin jointing with p62, although the interaction of autophagosome with p62 and lysosomes with p62, as well as autolysosomes clearly decreased. Besides, other more p62-cargos did not enter autophagosomes, which showed impaired autophagosomes and autolysosomes, and excessive useless proteins including preproinsulin were not degraded in PA-treated HepG2 cells. Thus, we infer that the sites of p62 recognizing and ligating to autophagosomes (to LC3B) might be disrupted or masked, leading to invalid assemblies of autophagosomes and inhibited autophagic flux.
Another interesting phenomenon is that the distribution of lysosomes and autoplysosomes with irregular rod-like shapes, including conjugates of p62 with insulin, were marginalized in PA-treated cells in this study. Recent studies have reported that high fatty acid levels could decrease lysosomal acidification; lysosome marginalization is a symbol of reduced acidification and deactivation of lysosmalproteolytic activity [38,39], and the subcellular localization of lysosomes is a major determinant of pH [40]. Thus, we presume that excessive free preproinsulin and preproinsulin-containing p62 occupied the intermediate area by some unknown mechanism, which prevented lysosomes moving towards the perinucleus from the cytoplasm, leading to impaired lysosomal function in PA-treated cells.
In summary, HFD induced intracellular preproinsulin production and type 2 diabetes-like syndromes, as well as impaired autophagy in zebrafish and HepG2 cells. Accumulation of intracellular preproinsulin protein may be an important factor for insulin resistance and dysregulation of glycolipid metabolism by mediating the marginalization of lysosomes and disrupting autophagosome formation.
Materials and Methods
Zebrafish husbandry
Zebrafish (Danio. rerio) of wild-type AB strain were maintained under standard laboratory conditions with 14-h light/10-h dark cycle at a temperature of 28.5±1°C [41]. The fish were fed brine shrimp once daily as the control group (Ctrl), and were fed twice daily with brine shrimp (60 mg cysts per fish daily) plus 1% egg yolk as the HFD group [42, 43]. Fifteen fishes were included in each group. All of the fish were fed for 10 weeks.
Zebrafish BMI, FBG, and organ collection
After feeding for 10 weeks, BMI was analyzed; body length of the zebrafish from the front end of the mouth to the tail end was measured, and body mass was weighed using an electronic balance (BS2202S, Sartorius, Argentina, Germany). Zebrafish were fasted for 24 h, after which blood from the heart was collected using scissors and micropipette tip, and FBG was evaluated using a blood glucose meter (Accu-Check® Active, Roche, Penzberg, Germany) [44]. Next, zebrafish liver, brain, and muscle were isolated and stored at -80°C for further use.
Hematoxylin and Eosin Staining
Fish were fixed in formaldehyde and coated with paraffin, and then cut into slices with paraffin microtome. The slices were stained with hematoxylin and eosin (H&E) and observed using a microscope.
Cell Culture
The HepG2 human hepatocellular carcinoma cell line was cultured in MEM medium (11095-080, Gibco, Grand Island, NY, USA) supplemented with 10% fetal bovine serum (26140-079, Gibco, Grand Island, NY, USA) at 37ºC in a humidified atmosphere containing 5% CO2.
Palmitic acid treatment
Palmitic acid (51.28 mg; P0500, Sigma-Aldrich, St. Louis, MO, USA) was dissolved in 1 ml 0.1 M NaOH at 70°C and was filtered. A total of 5% free fatty acid (FFA)-bovine serum albumin (BSA) (BAH66-500, Equitech-bio, Cotton Gin Ln, Kerrville, TX, USA) solution was prepared in double-distilled water at 55°C and filtered. The PA solution was conjugated to 5% FFA-free BSA in a 70°C water bath, after which the solution was cooled to room temperature and diluted in MEM to the final concentrations of 50 µM, 100 µM, 250 µM, and 500 µM. Cells were treated with different concentrations of PA for 12 h in 10% FBS-MEM. Cells treated without PA were considered the normal group control.
Nile red staining
Nile Red (1 mg; 19123, Sigma-Aldrich, St. Louis, MO, USA) powder was dissolved in 1 ml DMSO to a final concentration of 1 mgml-1. DMSO was diluted in MEM to a final concentration of 50%. The nile red solution was diluted in 50% DMSO to a final concentration of 1 μg ml-1. The solution was diluted again in MEM to working concentration of 0.5 µg ml-1. HepG2 cells were exposed to PA at the indicated concentrations for 12 h and washed twice with phosphate buffer saline (PBS). Then Nile red working solution was added to the cell dishes, which was incubated in the dark for 10 min at 37°C. Then the cells were observed using Inverted Fluorescence Microscope (IX51, Olympus, Tokyo, Japan) under an excitation wavelength of 543 nm. Cells with strong orange-red fluorescence were deemed positive for lipid accumulation, and those with golden-orange fluorescence were deemed negative for lipid accumulation.
Real-time qPCR
Total RNA was extracted from different zebrafish organs and HepG2 cells using Trizol reagent (15596-026, Invitrogen, Carlsbad, CA, USA). RNA samples were used to generate cDNA using the M-MLV RTase cDNA Synthesis Kit (D6130, Takara Bio Inc, Kusatsu, Japan). The reaction of quantitative real-time PCR was performed by the real-time quantification system (Roche, LightCycler® 96). The relative levels of messenger RNAs (mRNAs) were calculated with β-actin mRNA as the internal control. Relative transcript expression was determined using control sample as a calibrator and the ΔΔCT method. The PCR parameters were as follows: 95°C for 30s, 95°C for 5s, 55°C for 15s, and 72°C for 10s, for 30 cycles. The primers used in this study were shown in Table 1 and Table 2.
Primers for qPCR of zebrafish genes used in this study
| Gene | Primer F Sequence (5'- 3') | Primer R Sequenc (5'- 3') |
|---|---|---|
| insulin | GGTCCTGTTGGTCGTGTC | GTTGTAGAAGAAGCCTGTTGG |
| irs2 | TTCATCCACCACCACAGTTG | GACTCATACTCCTCATCAGAACC |
| glut2 | GCAGAAGAACCCTCACTC | TCTCCGCCACAATAAACC |
| atg3 | ACCGTCACCATTGAGAATC | AGTTCACCTCCTCCTTCC |
| atg4b | ACACCACTCAGCCAGCAG | AAGCCAGCAGCAATAGAAGG |
| atg5 | CAACTGTGGATGGGTCTG | GAGCGTCTGGATGAATGG |
| beclin1 | GCCATTGTATTGTTCAGGTG | CAGAAGCCAGTGTCATCC |
| atg7 | AGAGTCCAGTCCGATGTC | GAAGTAACAGCCGAGACG |
| atg12 | CCAGTTCATCTCACGCTTCCTC | TGCCGTCACTTCCGAAACAC |
| p62 | TTTGGCTCTTGTGAAGGATGAC | GAGGGCTAAAGTGAGGTGTAGTGA |
| foxo3a | GAGTCCAGTAGTCGCAGTG | GCAGTTCATCCGCCATCC |
| m-tor | ATACGCATCCAGTCCATTG | TCATTAGCCAGTAGAGTGTTC |
| lc3b | CCTCCAACTCAACTCCAACC | GCCGTCTTCGTCTCTTTCC |
| β-actin | CCGTGACATCAAGGAGAAG | ATACCGCAAGATTCCATACC |
Primers for qPCR of human genes used in this study
| Gene | Primer F Sequence (5'- 3') | Primer R Sequenc (5'- 3') |
|---|---|---|
| insulin | CCAGCCGCAGCCTTTGTG | TGTGTAGAAGAAGCCTCGTTCC |
| irs2 | CCTCGCTGGATGAATACAC | GTCTCCGTAGTCCTCTGG |
| glut2 | CACTGCTGTCTCTGTATTCC | TGCTCACATAACTCATCCAAG |
| pparΑ | CATCCCAGGCTTCGCAAAC | AAACCCATTTCCATACGCTACC |
| Pgc-1a | GGAGAGGCAGAGGCAGAAG | GCATCACAGGTATAACGGTAGG |
| lc3b | CGGTGATAATAGAACGATACAAGG | CTGAGATTGGTGTGGAGACG |
| p62 | CACCAAGAGCACGGACAG | AATAGCCTTCGTAGCCTTCG |
| β-actin | GCGTGACATTAAGGAGAAG | GAAGGAAGGCTGGAAGAG |
Western blot analysis
Briefly, total protein in the zebrafish organs and HepG2 cells was extracted using the Tissue Protein Rapid Miniprep Kit (90707-50,TIANDZ, Beijing, China) plus protease inhibitors, and as resolved on 15% or 10% SDS-PAGE gels. The protein bands were electrophoretically transferred to a nitrocellulose membrane and then blocked in Tris-buffered saline (TBS) containing 10% skim milk for 1 h at room temperature. The membranes were incubated overnight at 4°C with primary antibody including anti-human p62 polyclonal antibody (PM045, MBL, Nagoya, Japan) diluted 1:500, and anti-human β-ACTIN monoclonal antibody (TA-09, ZSGB-Bio, Beijing, China) diluted 1:1000, anti-human LC3B polyclonal antibody (PM036, MBL) diluted 1:500, anti-human LAMP2 monoclonal antibody (sc-5571, Santa Cruz Biotechnology, Dallas, TX) diluted 1:200, anti-human PPARA monoclonal antibody (AM8452b, Abgent, Suzhou, China) diluted 1:500, anti-human PGC-1α polyclonal antibody (ab54481, Abcam, Cambridge, UK) diluted 1:500, anti-human insulin polyclonal antibody (sc-7838,Santa Cruz Biotechnology) diluted 1:200, anti-human GLUT2 polyclonal antibody (sc-9117,Santa Cruz Biotechnology) diluted 1:200, and anti-human IRS2 polyclonal antibody (#4502, CST, Danvers, MA, USA) diluted 1:200. Then the membrane were washed and incubated with horseradish peroxidase-conjugated secondary antibodies. Proteins were visualized by enhanced chemiluminescence using the Supersignal® West Pico chemiluminescent substrate (34080, Thermo Fisher, Waltham, MA) with the AlphaEase® FC Imaging System. β-actin was used as a loading control.
Co-immunoprecipitation
Cells were lysed in Nondenaturinglysis buffer (C1050, Applygen, Beijing, China). Cell lysates were separately incubated with a specific primary antibody, including anti-p62 (PM045, MBL), anti-LC3B (M186-3, MBL) and anti-insulin (L6B10, CST), overnight at 4°C; then with protein A/G-Sepharose (Santa Cruz Biotechnology) for 3 h. The immunoprecipitated complexes were collected by centrifugation at 4°C, 3000 rpm for 3 min and then eluted 5 times by the lysis buffer. The eluted protein samples were separated on SDS-PAGE and followed by immunoblotting using the three antibodies mentioned above, anti-LAMP2 (L0668) and anti-β-actin (A5441) (both from Sigma-Aldrich US).
Cell Imaging Assay
HepG2 cells were cultured on slides and fixed, permeabilized, blocked in BSA, and incubated overnight at 4°C with primary antibodies including rabbit anti-human p62 antibody (PM045, MBL) diluted 1:500, mouse anti-human LC3 antibody (M186-3, MBL) diluted 1:500, rabbit anti-human GLUT2 antibody (sc-9117, Santa Cruz Biotechnology) diluted 1:200, and goat anti-human insulin antibody (sc-7838, Santa Cruz Biotechnology) diluted 1:200. Then, the cells were washed and incubated with fluorochrome-conjugated secondary antibodies. Finally, the cell nuclei were counterstained with DAPI to visualize nuclei. Images were captured using a laser scanning confocal microscope (LSM 710, Zeiss, Jena, Germany).
Data treatment and Statistical analysis
The quantitative data of immunoblot and real-time quantitative PCR are relative magnitudes that were normalized with β-actin protein and mRNA, respectively. The means and standard deviations (SD) in histograms are derived from three independent experiments.
For the fluorescence quantification of colocalization images, the free software Image J. Fiji and the Pearson's correlation coefficient were used to calculate double fluorescence correlation coefficients [45], and scatter diagrams were used to describe changes of co-localized fluorescence quantification, in which 10 sight fields each group were analyzed.
The Student's t-test was used for comparison between two independent groups, while one-way ANOVA was used to compare means among multiple groups. All statistical tests were two-tailed and p value was shown as *p<0.05 and **p<0.01.
Abbreviations
T2D: type 2 diabetes; ATG: autophage related gene; FOXO3: forkhead box protein O3; IRS: insulin receptor substrate; TNF-a: tumor necrosis factor a; ER: endoplasmic reticulum; HFD: high-fat diet; PA: palmitic acid; FBG: fasting blood glucose; GLUT: glucose transporter; BMI: body mass index; SQSTM1: sequestosome-1; PGC-1a: peroxisome proliferator-activated receptor gamma coactivator 1-alpha; PPARAa: peroxisome proliferator-activated receptor alpha.
Acknowledgements
We thank the Equipment Center of IMB and Dr Guang-Zhi Shan and Li-Min Zuo for helping in use the confocal microscope, and thank Jie Meng for fish husbandry. We thank LetPub (www.letpub.com) for its linguistic assistance during the preparation of this manuscript.
Funding
This work was supported by The National Natural Science Foundation of China (No. 81373453 to JPZ and 81603172 to BC), Foundation for Innovative Research Groups (81321004 to JDJ) and the Chinese National Key Technology R&D Program (2015BAK45B01 to JPZ).
Author contributions
JPZ conceived and designed the project, and wrote the manuscript. XHM and BC performed the experiments and dealt data, as well as wrote “Research Design and Methods”. BC, XHM and JPZ analyzed the results.
Competing Interests
The authors declare no potential conflicts of interest relevant to this article.
References
1. Guariguata L, Whiting DR, Hambleton I. et al. Global estimates of diabetes prevalence for 2013 and projections for 2035. Diabetes Res Clin Pract. 2014;103:137-49
2. Lam DW, LeRoith D. The worldwide diabetes epidemic. Curr Opin Endocrinol Diabetes Obes. 2012;19:93-6
3. Saisho Y. β-cell dysfunction: Its critical role in prevention and management of type 2 diabetes. World J Diabetes. 2015;6:109-24
4. Kim JA, Wei Y, Sowers JR. Role of Mitochondrial Dysfunction in Insulin Resistance. Circ Res. 2008;102:401-14
5. Khodabandeloo H, Gorgani-Firuzjaee S, Panahi S. et al. Molecular and cellular mechanisms linking inflammation to insulin resistance and β-cell dysfunction. Transl Res. 2016;167:228-56
6. Eckel RH, Kahn SE, Ferrannini E. et al. Obesity and type 2 diabetes: what can be unified and what needs to be individualized? J Clin Endocrinol Metab. 2011;96:1654-63
7. Cusi K. The role of adipose tissue and lipotoxicity in the pathogenesis of type 2 diabetes. Curr Diab Rep. 2010;10:306-15
8. Sattar N, Gill JM. Type 2 diabetes as a disease of ectopic fat? BMC Med. 2014;12:123
9. Deng Y, Scherer PE. Adipokines as novel biomarkers and regulators of the metabolic syndrome. Ann N Y Acad Sci. 2010;1212:E1-E19
10. Kaniuk NA, Kiraly M, Bates H. et al. Ubiquitinated-protein aggregates form in pancreatic beta-cells during diabetes-induced oxidative stress and are regulated by autophagy. Diabetes. 2007;56:930-9
11. Yorimitsu T, Klionsky DJ. Autophagy: molecular machinery for self-eating. Cell Death Differ. 2005;12(Suppl 2):1542-52
12. Naito T, Kuma A, Mizushima N. Differential contribution of insulin and amino acids to the mTORC1-autophagy pathway in the liver and muscle. J Bio Chem. 2013;288:21074-81
13. Liu HY, Han J, Cao SY. et al. Hepatic Autophagy Is Suppressed in the Presence of Insulin Resistance and Hyperinsulinemia: Inhibition of FoxO1-dependent expression of key autophagy genes by insulin. J Biol Chem. 2009;284:31484-92
14. Ebato C, Uchida T, Arakawa M. et al. Autophagy is important in islet homeostasis and compensatory increase of beta cell mass in response to high fat diet. Cell Metab. 2008;8:325-32
15. Bernales S, Schuck S, Walter P. ER-phagy: selective autophagy of the endoplasmic reticulum. Autophagy. 2007;3:285-7
16. Ozcan U, Yilmaz E, Ozcan L. et al. Chemical chaperones reduce ER stress and restore glucose homeostasis in a mouse model of type 2 diabetes. Science. 2006;313:1137-40
17. Yang L, Li P, Fu S. et al. Defective Hepatic Autophagy in Obesity Promotes ER Stress and Causes Insulin Resistance. Cell Metab. 2010;11:467-78
18. Sumiyoshi M, Sakanaka M, Kimura Y. Chronic intake of high-fat and high -sucrose diets differentially affects glucose intolerance in mice. J Nutr. 2006;136:582-7
19. Gao CL, Zhu C, Zhao YP. et al. Mitochondrial dysfunction is induced by high levels of Glucose and free fatty acids in 3T3 -L1 adipocytes. Mol Cell Endocrinol. 2010;320:25-33
20. Kinkel MD, Prince VE. On the diabetic menu: Zebrafish as a model for Pancreas development and function. Bioessays. 2009;31:139-52
21. Jörgens K, Hillebrands JL, Hammes HP. et al. Zebrafish: A Model for Understanding Diabetic Complications. Exp Clin Endocrinol Diabetes. 2012;120:186-7
22. Seth A, Stemple DL, Barroso I. The emerging use of zebrafish to model metabolic disease. Dis Model Mech. 2013;6:1080-8
23. Oka T, Nishimura Y, Zang L. et al. Diet-induced obesity in zebrafish shares common pathophysiological pathways with mammalian obesity. BMC Physiol. 2010;10:21
24. Papáčková Z, Daňková H, Páleníčková E. et al. Effect of Short-and Long-Term High-Fat Feeding on Autophagy Flux and Lysosomal Activity in Rat Liver. Physiol Res. 2012;61(Suppl. 2):67-76
25. Choi SE, Lee SM, Lee YJ. et al. Protective role of autophagy in palmitate-induced INS-1 β-cell death. Endocrinology. 2009;150:126-34
26. Mizushima N, Levine B, Cuervo AM. et al. Autophagy fights disease through cellular self-digestion. Nature. 2008;451:1069-75
27. Lippai M, Lőw P. The role of selective adaptor p62 and ubiquitin-like proteins in autophagy. Biomed Res Int. 2014;2014:832704
28. Ishii M, Maeda A, Tani S. et al. Palmitate induces insulin resistance in human HepG2 hepatocytes by enhancing ubiquitination and proteasomal degradation of key insulin signaling molecules. Arch BiochemBiophys. 2015;566:26-35
29. Summermatter S, Baum O, Santos G. et al. Peroxisome proliferator-activated receptor {gamma} coactivator 1{alpha} (PGC-1{alpha}) promotes skeletal muscle lipid refueling in vivo by activating de novo lipogenesis and the pentose phosphate pathway. J Bio Chem. 2010;285:32793-800
30. Pawlak M, Lefebvre P, Staels B. Molecular mechanism of PPARa action and its impact on lipid metabolism, inflammation and fibrosis in non-alcoholic fatty liver disease. J Hepatol. 2015;62:720-33
31. Mattijssen F, Georgiadi A, Andasarie T. et al. Hypoxia-inducible lipid droplet-associated (HILPDA) is a novel peroxisome proliferator-activated receptor (PPAR) target involved in hepatic triglyceride secretion. J Biol Chem. 2014;289:19279-93
32. Wu H, Deng X, Shi Y. et al. PGC-1α, glucose metabolism and type 2 diabetes mellitus. J Endocrinol. 2016;229:R99-R115
33. Shimomura I, Matsuda M, Hammer RE. et al. Decreased IRS-2 and increased SREBP-1c lead to mixed insulin resistance and sensitivity in livers of lipodystrophic and ob/ob mice. Mol Cell. 2000;6:77-86
34. Leturque A, Brot-Laroche E, Le Gall M. GLUT2 mutations, translocation, and receptor function in diet sugar managing. Am J Physiol Endocrinol Metab. 2009;296:E985-92
35. Chen X, Larson CS, West J. et al. In vivo detection of extrapancreatic insulin gene expression in diabetic mice by bioluminescence imaging. PLoS ONE. 2010;5:e9397
36. Sun J, Cui J, He Q. et al. Proinsulin misfolding and endoplasmic reticulum stress during the development and progression of diabetes. Mol Aspects Med. 2015;42:105-18
37. Haataja L, Manickam N, Soliman A. et al. Disulfide Mispairing During Proinsulin Folding in the Endoplasmic Reticulum. Diabetes. 2016;65:1050-60
38. Johnson DE, Ostrowski P, Jaumouillé V. et al. The position of lysosomes within the cell determines their luminal pH. J Cell Biol. 2016;212:677-692
39. Lavallard VJ, Gual P. Autophagy and Non-Alcoholic Fatty Liver Disease. Biomed Res Int. 2014;2014:121079
40. Gowrishankar S, Ferguson SM. Lysosomes relax in the cellular suburbs. J Cell Biol. 2016;212:617-9
41. Westerfield M, Doerry E, Kirkpatrick AE. et al. An on-line database for zebrafish development and genetics research. Semin Cell Dev Biol. 1997;8:477-88
42. Flynn EJ 3rd, Trent CM, Rawls JF. Ontogeny and nutritional control of adipogenesis in zebrafish (Daniorerio). J Lipid Res. 2009;50:1641-52
43. Hasumura T, Shimada Y, Kuroyanagi J. et al. Green tea extract suppresses adiposity and affects the expression of lipid metabolism genes in diet-induced obese zebrafish. Nutr Metab (Lond). 2012;9:73
44. Eames SC, Philipson LH, Prince VE. et al. Blood sugar measurement in zebrafish reveals dynamics of glucose homeostasis. Zebrafish. 2010;7:205-13
45. Moser B, Hochreiter B, Herbst R. et al. Fluorescence colocalization microscopy analysis can be improved by combining object-recognition with pixel-intensity-correlation. Biotechnol J. 2017:12
Author contact
![]() Corresponding author: zhangjingpupumc.edu.cn or zjp5577com
Corresponding author: zhangjingpupumc.edu.cn or zjp5577com