Impact Factor ISSN: 1449-2288
- Issue 12; 2026
- Issue 11; 2026
- Issue 10; 2026
- Issue 9; 2026
- Issue 8; 2026
- Volume 22; 2026
- Past Issues
- Advance Articles
- Editorial Board
- Cover Images
- Index & Coverage
- Cover Suggestion
- Special Issues
Introduction
Materials and Methods
Results and Discussion
Conclusions
Supplementary Material
Abbreviations
Acknowledgements
References

 Global reach, higher impact
Int J Biol Sci 2017; 13(9):1213-1221. doi:10.7150/ijbs.21502 This issue Cite
Research Paper
Identification and Analysis of P53-Mediated Competing Endogenous RNA Network in Human Hepatocellular Carcinoma
Yiming Zhang, Ran Kang, Wenrong Liu, Yalan Yang, Ruofan Ding, Qingqing Huang, Junhua Meng, Lili Xiong ![]() , Zhiyun Guo
, Zhiyun Guo ![]()
School of Life Sciences and Bioengineering, Southwest Jiaotong University
Received 2017-6-16; Accepted 2017-7-30; Published 2017-9-5
Abstract

Recent studies have indicated that long non-coding RNAs (lncRNAs) and mRNA function as competing endogenous RNAs (ceRNAs) that compete to bind to shared microRNA (miRNA) recognition elements (MREs) to perform specific biological functions during tumorigenesis. The tumor suppressor p53 is a master regulator of cancer-related biological processes by acting as a transcription factor to regulate target genes including miRNA and lncRNA. However, the mechanism in human hepatocellular carcinoma and whether p53-mediated RNA targets could form ceRNA network remain unclear. Here, we identified a series of differential expressed miRNAs, lncRNA and mRNA which were potentially regulated by p53 using RNA sequencing in HepG2. Genomic characteristics comparative analysis showed significant differences between mRNAs and lncRNAs. By integrating experimentally confirmed Ago2 and p53 binding sites, we constructed a highly reliable p53-mediated ceRNA network using hypergeometric test. The KEGG pathway enrichment analysis showed that the ceRNA network highly enriched in the cancer or p53-associated signaling pathways. Finally, using betweenness centrality analysis, we identified five master miRNAs (hsa-miR-3620-5p, hsa-miR-3613-3p, hsa-miR-6881-3p, hsa-miR-6087 and hsa-miR-18a-3p) that regulated most of the target RNAs, suggesting these miRNAs play central roles in the whole p53-mediated ceRNAs network. Taken together, our results provide a new regulatory mechanism of p53 networks for future studies in cancer therapeutics.
Keywords: ceRNA network, p53, hepatocellular carcinoma, mRNA, lncRNA.
Introduction
MicroRNA (miRNA) is a conserved ~22nt small non-coding RNA. It could specifically bind to the 3'-UTR of the target gene through miRNA response element (MRE). The mature miRNA then incorporates with Ago2 protein into RNA-induced silencing complex (RISC) to degenerate the target RNAs. Studies have shown that miRNAs are dysregulated in tumors and involve in a variety of tumor-related biological processes including apoptosis, proliferation and differentiation [1]. Long non-coding RNA (lncRNA) is a class of RNA with length greater than 200 nt and does not encode any proteins, usually involved in transcription and post-transcriptional regulation, X chromosome silencing, genomic imprinting, chromatin modification and other important regulatory processes, etc. [2] Previous studies have proved that many miRNAs and lncRNAs were involved in the regulation of hepatocellular carcinoma (HCC) such as the miR-221, miR-21 [3] and lincRNA MALAT-1 [4].
In recent years, the Poliseno research team found that overexpression of pseudogene PTENP1 induced miR-19b and miR-20a would reduce the abundance of tumor suppressor gene PTEN, thus interfering with cell dynamic balance and cell proliferation [5]. From this phenomenon, they presented the concept of competing endogenous RNA (ceRNA) that how different kinds of RNAs, including mRNAs, lncRNAs, pseudogenes, etc., “communicate” to each other via MREs. Especially lncRNA as a critical member of ceRNA networks has been confirmed involved in various cancer [6, 7].
p53 tumor suppressor gene (TP53) is a node that regulates multiple cell pathways that response to different types and levels of external stress, including apoptosis, cell cycle arrest, aging, DNA repair, cell metabolism, or cell autophagy [8]. In order to play a regulatory role, p53 requires a sophisticated and complex regulatory network to perform different functions [9, 10]. A previous study confirmed that p53 can induce the ectopic hsa-miR-34a by binding to a conserved site, which could induce cell cycle arrest and apoptosis, then suppressing tumor cell proliferation [11]. In recent years, a series of miRNAs were found to be potentially regulated by p53 [12-15]. Meanwhile, many studies show that lncRNA also could be regulated by p53 as miRNA does in cancer such as lincRNA-p21 [16], PANDA [17] and lncRNA loc285194 [18]. However, the association between p53 and ceRNA network in HCC is still unclear.
Here, the differential expressed mRNAs, lncRNAs and miRNAs in response to doxorubicin (Dox) treatment, an agent induced activity of p53, were obtained through RNA-seq. In order to construct a p53-mediated ceRNA network, two steps were adopted. First of all, the potential MRE sites were predicted via miRanda-aug [19] and verified using Ago2 ChIP-seq data. Secondly, each pair of the ceRNA was validated using hypergeometric test. To extract highly relevant p53-ceRNA network, a ceRNA subnetwork with experimentally confirmed p53 binding sites was explored using existing ChIP-seq data sets of p53, and five of these miRNAs were found significantly enriched in p53-dependent pathways in HepG2 cells via the betweeness centrality (BC) and KEGG signaling pathways analysis.
Materials and Methods
Cell culture, RNA extraction, library preparation and sequencing
The human HCC cell line HepG2 were purchased from ATCC and maintained in Dulbecco's Modified Eagle Medium (DMEM) (Gibco) with 10% fetal bovine serum (Biowest, France), 100 IU/ml penicillin and 100 μg/ml streptomycin solution (Hyclone). Cell cultures were maintained at 37 °C with 5% of CO2. 5.0×10⁶ HepG2 cells were plated in 60 mm dishes and cultured for 24 h. For drug treatment, the growing cells were treated with 1µg/ml Dox (BeiJing HuaFeng). Cells were collected after 24h treatment for RNA and protein extraction.
Total RNA of Dox treated and untreated HepG2 cells were extracted using the TRIzol reagent (Invitrogen, USA) according to the manufacturer's instructions. The purity and integrity of total RNA were measured with 1% agarose gel electrophoresis and microplate reader (Biotech, USA). After RNA detection qualified, polyA+ RNA was enriched through magnet beads. Then total RNA was reverse transcribed to double-stranded cDNA. The purified cDNA was further ligated with polyA tail and sequencing adapter. Fragment size selection was finished by AMPure XP beads. Finally, the PCR enriched cDNA library was prepared and then sequenced with the Illumina HiSeq 4000 sequencer.
Data processing and differential expression analysis
The original image obtained by HiSeq 4000 is converted to the original sequencing sequence by base calling, and the results are stored in the FASTQ format. Obtain the clean reads by removing the connector and low quality reads in original sequence. The clean reads were mapped to human genome (hg19 assembly) via Hisat2 (2.03-beta) [20]. All the mRNAs and lncRNAs detected in this transcriptome sequencing were obtained by cufflinks (1.3.0) [21] according to the reference genome annotation. The differential expression analysis was performed by cuffdiff base on the fold change and q value (Benjamini & Hochberg correction) of each mRNA and lncRNA in the two libraries. The criteria of significant differentially expressed mRNAs and lncRNAs were as follows: 1) log2(Fold Change) > 1 or log2(Fold Change) < -1; 2) q value < 0.05 [22].
Small RNA-seq data was downloaded from Gene Expression Omnibus (GEO) with the accession numbers: GSM1923400, GSM1923402, GSM1923401, GSM1923403 [23]. These data were obtained from HepG2 cells, which were treated with same experimental procedures as RNA-Seq. The number of reads of each miRNA was counted by miARma-Seq (v1.5) [24]. The differential expression analysis was performed with the same standard as RNA-seq procedure via edgeR [25, 26].
Prediction of microRNA binding sites
The miRNA binding sites between all differential expressed RNAs, including mRNA and lncRNA, were predicted using miRanda-aug2010 [27]. All default parameters were used, but -sc and -en were set to 150 and -8.0, respectively. The reported data of RNA binding protein Ago2 were downloaded from GEO database, including HITS-CLIP, PAR-CLIP and iCLIP. All the binding sites were converted to hg19 assembly through LiftOver (UCSC). If there is an overlap between binding sites of Ago2 and prediction, these miRNA binding sites will be considered as experimentally validated sites for following analysis.
The Ago2 data was downloaded from Gene Expression Omnibus (GEO) with the accession numbers: GSE21918, GSE28865, GSE32109, GSE41285, GSE41357, GSE42701, GSE43573 and GSE44404.
Verification of differentially expressed mRNAs and lncRNAs by qRT-PCR
HepG2 cells were treated using 1 μg/ml Dox for 0 h and 24 h. Total RNA was extracted with TRIzol reagent according to manufacturer's instruction, and the total RNA content and mass were verified with 1% of agarose gel electrophoresis and microplate reader. The reverse transcription of total RNA was performed according to the instruction of the M-MLV Reverse Transcription Kit (Invitrogen, USA). The real-time PCR validation of mRNAs and lncRNAs were conducted using the SYBR GreenI Fluorescence Quantification Kit (Roche, Switzerland). PCR reaction started with 95 ℃ denaturation for 5 min, followed by 40 cycles of denaturation with 94 ℃ for 30 s, 60 ℃ for 40 s and 72 ℃ for 20 s.
Construct of ceRNA network
We consider any two RNAs, including mRNA and lncRNA, that could bind to common miRNA as potential ceRNA pairs. Each of the potential ceRNA pairs was examined by hypergeometric test. The p value is computed as:
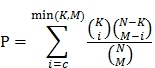
In this formulation, N is the total number of miRNAs that have any MRE; K is the number of miRNAs that interact with one of the two potential ceRNAs; M is the number of miRNAs that interact with the other one of the potential ceRNA; and c is the number of common miRNAs between two potential ceRNAs. Then the Benjamini & Hochberg correction was performed base on p values calculated by this formula. The criteria of reliable ceRNA pairs was q values < 0.01.
KEGG Pathway, betweeness centrality analysis and the regulatory network
KEGG pathway analysis was performed to further identify significantly enriched metabolic pathways or signal transduction pathways using the clusterProfiler (R package). Pathways with q values < 0.05 were defined as significantly enriched. In graph theory, betweenness centrality [28] is a measure of centrality in a graph based on shortest paths. The between centrality for each vertex is defined as the number of shortest paths from each node to all others that pass through the node. We use this value to show the degree of importance of each RNA in ceRNA network. The higher the BC value, the more important this node is.
BC values are computed as follows:
Betweenness Centrality
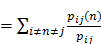
In this formula, pij represents the number of shortest paths between nod i and node j. pij(n) means the number of paths that pass through intermediate point n.
ceRNA network that mediated by p53
The Chip-seq data of p53 were download from Botcheva [29] and GEO database with accession numbers: GSE46991-GSE46993 [30], GSE55727 [31], GSE46641 [32], GSE58714 [33], GSE58740 [34].
The transcription start site (TSS) of each mRNA and lncRNA was obtained according to the annotation file downloaded from GENCODE [35]. The putative promoter region of mRNA was defined as -5kb~1kb of the TSS. For lncRNAs, we defined the -5kb~5kb of TSSs as the putative promoter region. As for the miRNAs, we downloaded the transcript start site (TSS) data from miRStart (http://mirstart.mbc.nctu.edu.tw/), a resource of human miRNA TSSs. For TSSs of miRNA not collected in miRStart, we defined their TSSs with the following steps: 1) obtain the genomic location of miRNAs from UCSC database, 2) TSSs of intragenic miRNAs were identified by transcription initiation of the host gene transcripts, 3) TSSs of the remaining miRNAs were determined by the genomic location of first nucleotide of each pre-miRNA. Next, 10 kb upstream and 1 kb downstream of TSS of each miRNA were defined as the putative promoter region based on previous studies [36].
Results and Discussion
RNA sequencing and the data analysis
A total of 49,623,323 and 4,1673,077 clean reads were obtained in the control group and the Dox-treated group using Illumina HiSeq 4000, respectively. All the clean reads were map to reference genome of human (hg19) using Hisat2 [20]. In control group, 85.05% of reads were mapped to human genome. As for the treatment group overall mapping rate was 83.29% (Supplementary Fig. S1A). In addition, the proportion of total clean reads that uniquely mapped to the human reference genome was 80.42% in control group and 80.01% in treatment group, respectively (Supplementary Fig. S1B). Among the aligned reads, we identified the species of reads in both groups according to reference genome annotation, and the results show that RNAs were made up of mRNA, ncRNA, pseudogene, etc. Furthermore, the proportion of aligned reads in control and treatment group that assign to different RNA categories is shown in Supplementary Fig. S1C, the result shows that both groups have a similar distribution.
The differential expression analysis and qRT-PCR validation
In order to find out RNAs that functionally correlate with p53, we performed differential expression analyses on RNA-seq data. Totally, 20,344 mRNAs, 13,871 lncRNAs and 2,588 miRNAs were detected in both groups. Finally, we identified 2,743 mRNAs (1,193 upregulated and 1,550 downregulated), 617 lncRNAs (454 upregulated and 163 downregulated) and 207 microRNAs (129 upregulated and 78 downregulated) that were significantly differential expressed in HepG2 cells treated with Dox (Supplementary Fig. S2, Supplementary Table S1).
As expected, the activation of p53 by Dox treatment caused a series of expression level changes of known p53 target genes. For example, we observed significantly differential expression in GADD45A (Fold Change = 4.8577), GADD45B (Fold Change = 4.4577) and CDKN1A (Fold Change = 2.2243), which were well-known as the p53 targets [37]. We also observed the expression level of H19 was 2.21 folds lower in treatment group than control group, which is a lncRNA that has a functional link with p53 [38]. In addition, HOTAIR (Fold Change = 8.3259) could form a negative regulation loop with p53 in NSCLC cells [39]. Moreover, previously confirmed miRNA targets of p53 have also been found such as hsa-miR-34b-5p (Fold Change = 145.6538), hsa-miR-34c-5p (Fold Change = 11.5899) [40], hsa-miR-200a-3p (Fold Change = 77.6115) and hsa-miR-200b-5p (Fold Change = 24.4659) [12]. These findings show that the expression level of differential expressed mRNAs in the treatment group is significantly lower than control group, in contrast with the expression levels of lncRNAs and miRNAs (Fig. 1A). This result is consistent with the concept that miRNAs mainly inhibit the expression of their target mRNAs.
The comparative analysis and qRT-PCR validation of differentially expressed mRNAs and lncRNAs. A: Boxplot of differential expressed mRNAs (left), lncRNAs (middle) and miRNAs (right). The y-axis represented the expression level of mRNA (FPKM), lncRNA (FPKM) and miRNA (CPM), respectively. B: Relative expression levels of the MDM2, p53, p21 and PTEN in HepG2 cells (normalized to GAPDH). C: Relative expression levels of the TGFB2-AS1, AC132217.4, RP11-211G3.2, RP11-62F24.2 and RP4-533D7.5 in HepG2 cells (normalized to GAPDH). Values were presented as mean ± S.D. followed by paired student's t-test. *P <0.05 compared with the control, **P <0.01 compared with the control, ***P <0.001 compared with the control.
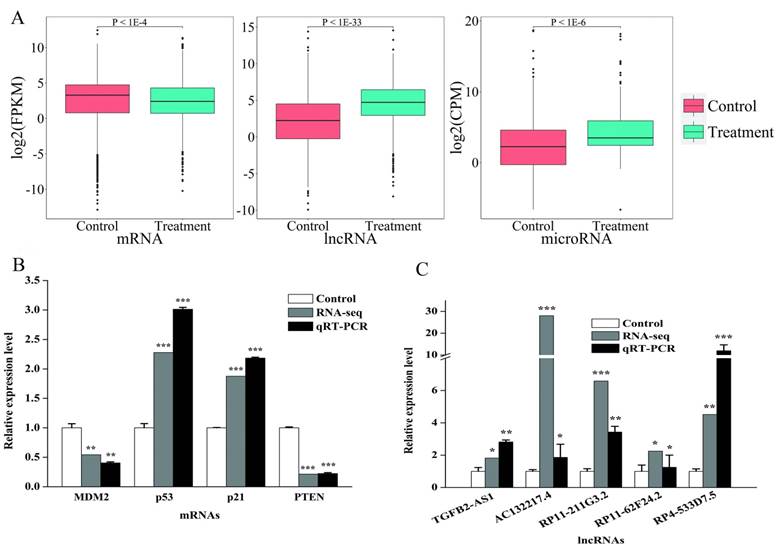
To verify accuracy of RNA-seq, we select four genes (PTEN, MDM2, CDKN1A and TP53) and five lncRNAs (TGFB2-AS1, AC132217.4, RP11-211G3.2, RP11-62F24.2 and RP4-533D7.5) which were associated with cancer. As expected, the results show the same express tendencies with RNA-seq results (Fig. 1B and Fig. 1C).
Comparison of genomic characteristics analysis of mRNAs and lncRNAs
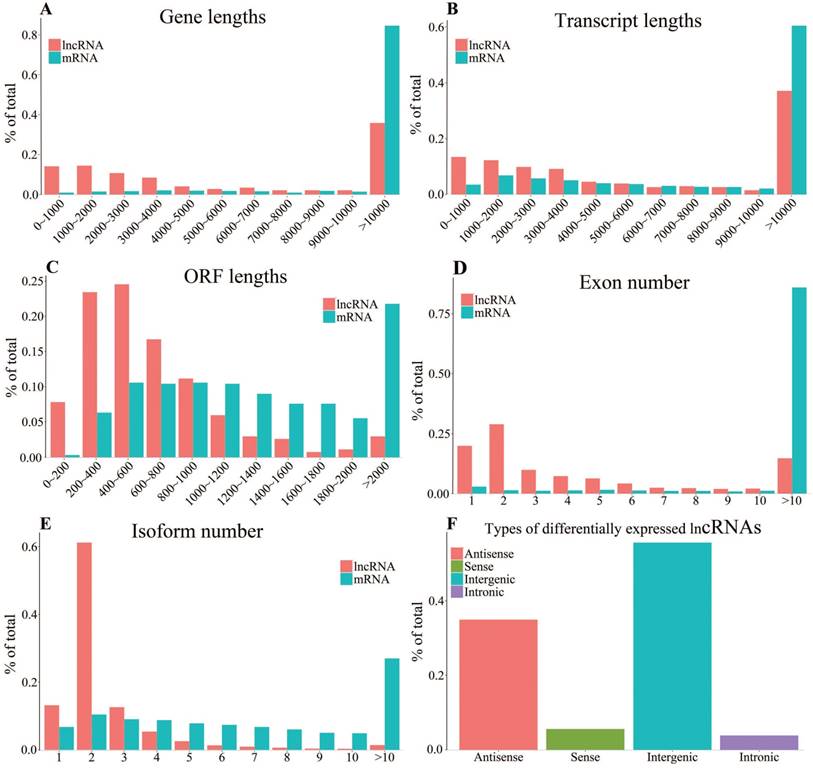
To investigate the difference of genomic characteristics between differentially expressed mRNAs and lncRNAs, we performed the analyses of gene lengths, transcript lengths, open reading frame (ORF) lengths, exon numbers, isoform numbers and lncRNA types. The results show that the gene lengths and transcript lengths of mRNAs and lncRNAs have a similar distribution. Gene lengths of most of mRNAs and lncRNAs are more than 10kb (84.59% and 38.81%, respectively) (Fig. 2A). Most of the mRNAs and lncRNAs have transcripts longer than 10kb (60.46% and 37.12%, respectively) (Fig. 2B). The result indicates that the ORF lengths in lncRNAs (most lengths are less than 800 bp) are in general smaller than mRNAs' (Fig. 2C). As shown in figure 2D, the exon numbers of mRNAs are about six times of the lncRNAs', which is consistent with previous observations [41]. More than 90% lncRNAs have alternative splicing with 1-4 transcript isoforms. Notably, more than 60% of lncRNAs have two isoforms. On the contrary, the numbers of isoform of each mRNA vary from 1-10 and mainly distributed in >10 group (Fig. 2E). The previous study has proved that lncRNAs tend to have fewer transcript isoforms [42]. As shown in Fig. 2F, these differentially expressed lncRNAs mainly consisted of 34.93% of antisense lncRNAs and 55.61% of intergenic lncRNAs, both of which have very long intron lengths resulting in very short transcript lengths after lncRNA transcription and processing [43].
Genomic characteristics of differentially expressed mRNAs and lncRNAs. A-E: Gene lengths (A), transcript lengths (B), ORF lengths (C), exon number (D) and isoform number (E). F: Types of differentially expressed lncRNAs.
The ceRNA network mediated by p53 significantly enriched in cancer or p53-related signaling pathways
The ceRNA network was constructed with the mRNA, lncRNA and miRNA that came from the same experimental system and processing conditions. To further reduce the false positive of ceRNA network construction, miRNA needs to combine with Ago2, a member of RISCs to perform its function of translation repression and target cleavage. The integration of Ago2 binding sites could effectively reduce the false positive of prediction of miRNA binding sites [44]. We consider those RNAs, which have miRNA target sites with Ago2 binding, as valid potential MREs. Finally, ceRNA network (1818 mRNAs, 504 lncRNAs and 207 miRNAs) was built based on 22,873 pairs of RNA-RNA interaction using hypergeometric test (Supplementary Table S2).
To investigate whether these ceRNAs are associated with tumorigenesis or p53 signaling pathways, the KEGG pathway annotation was carried out using mRNA datasets of ceRNAs. The results show that the ceRNAs obviously enriched in cancer or p53-related signaling pathways, such as pathway in cancer (q-value=1.66E-3), HTLV-I infection (q-value=3.86E-4) and Viral carcinogenesis (q-value=3.06E-4) (Supplementary Fig. S3). Pathway in cancer represents multiple different pathways that correlate with cancer, including p53 signaling pathways, Wnt signaling pathway and cell cycle. p53 could suppressing Wnt-mediate tumor formation by inducing Dkk-1 [45]. Besides, cell cycle was also found to be arrested by p53 in tumor initiation and progression [46]. HBZ, a HTLV-1 protein, could suppress the transcription that was active by p53, via interactions with two different HAT proteins [47]. The results of KEGG pathways annotation show that the function of mRNAs in this ceRNA network is highly associated with p53 or tumorigenesis, suggesting that this ceRNA network may be an essential mediator network of p53 to perform subsequent regulation of tumorigenesis in hepatocellular carcinoma.
The construction of ceRNA network that mediated by p53 directly using p53 ChIP-seq data
In order to investigate which ceRNA networks may be directly mediated by p53, six p53 ChIP-seq datasets were collected to identify the RNAs mediated by p53 directly. Ultimately, we obtained a ceRNA network that consists of 54 miRNAs, 173 lncRNAs and 494 mRNAs with experimentally confirmed p53 binding sites (Supplementary Table S3). In order to find out the master RNA, the betweenness centrality analysis was performed. The level of BC value is significantly different between various RNAs. The average BC value of miRNA is 17.95 times and 98.17 times for lncRNA and mRNA, respectively. The BC value represents the influence of each RNA. The higher the BC value is, the more different target RNAs could be affected by this RNA directly and indirectly. As shown in the Fig. 3A, hsa-miR-3620-5p, hsa-miR-3613-3p, hsa-miR-6881-3p, hsa-miR-6087 and hsa-miR-18a-3p, have top five BC values. To better understand the centrality of these five miRNAs, we compared the target RNAs of these five miRNAs with the remaining 49 miRNAs'. The results showed that two groups of miRNAs shared 83% of RNA targets, suggesting that these five miRNAs may play a central regulatory role in the entire ceRNA network as master RNA (Fig. 3B).
Betweenness centrality and KEGG pathway enrichment analysis of p53-mediated ceRNAs. A: Box plot for comparison of the BC values among lncRNAs, mRNAs and microRNAs. Hsa-miR3620-5p (BC=0.1124), hsa-miR3613-3p (BC=0.0647), hsa-miR6881-3p (BC=0.0583), hsa-miR6087 (BC=0.0582), hsa-miR18a-3p (BC=0.0534), which have the top five BC values were labeled. B: Venn diagram indicating intersection of the number of target RNAs between above the five miRNAs and the remaining miRNAs. C: KEGG pathway enrichment analysis of target genes of miRNAs that have top five highest BC values. The size of the dots represents the number of RNAs that enriched in corresponding pathways. The color indicates the significant level of the enriched pathways. Seven pathways that obviously associated with p53 are labeled with “※”.
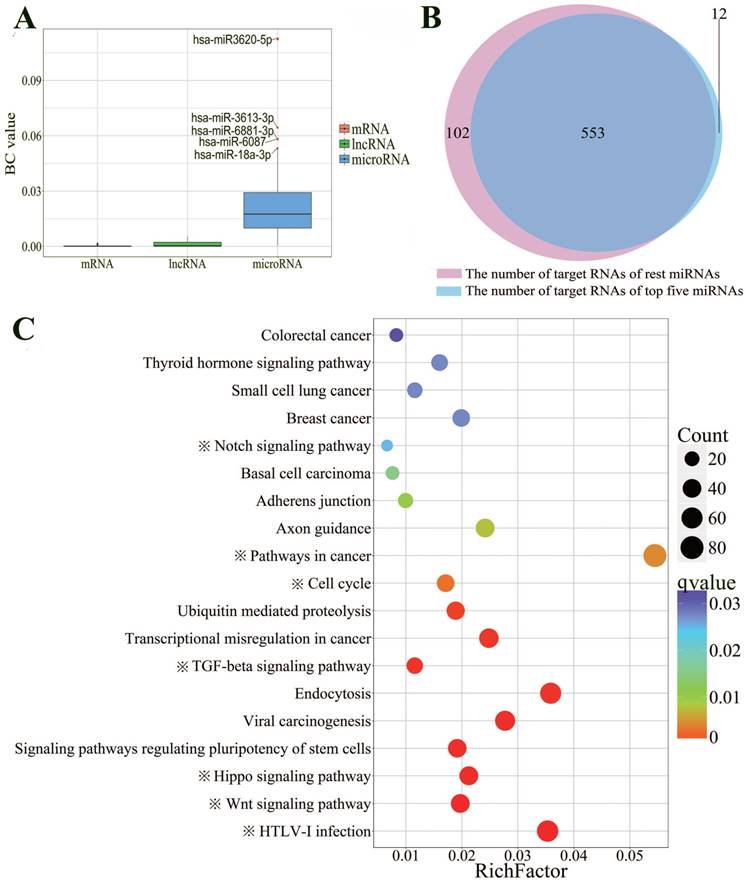
To demonstrate the function of these miRNAs, KEGG pathway enrichment analysis was performed. As expected, the target genes of the miRNAs are highly enriched in 19 cancer-related KEGG signaling pathways (Fig. 3C). Significantly, we found 7 out of 19 pathways obviously enriched in p53-related signaling pathway. For example, p53 has already been proved to be able to arrest cell cycle (q-value=2.82E-3) in different tumor cells [46]. There also were researchers found that p53-members were required for TGF-beta signals pathway (q-value=2.07E-4) to induce apoptosis [48]. Furthermore, it has been proved that Notch could suppress p53 (q-value=2.51E-2) in T-cell lymphoma [49].
Conclusions
In summary, we investigated the ceRNA network composed by a series of differential expressed miRNA, lncRNA, and mRNA after p53 activation based on RNA sequencing in human hepatocellular carcinoma. We integrated the Ago2 binding sites to reduce the false positive of prediction of miRNA binding sites in the process of construction of ceRNA network. The results show that the ceRNAs obviously enriched in cancer-related signaling pathways, such as pathway in cancer, HTLV-I infection and viral carcinogenesis. Furthermore, a ceRNA network that consists of 54 miRNAs, 173 lncRNAs and 494 mRNAs with experimentally confirmed p53 binding sites was explored and we noticed this network highly enriched in the p53 well-known signaling pathways. Finally, we identified five miRNAs, hsa-miR-3620-5p, hsa-miR-3613-3p, hsa-miR-6881-3p, hsa-miR-6087 and hsa-miR-18a-3p may as master miRNAs which previous study described to control the whole p53-mediated ceRNAs network. Taken together, our results provide a new regulatory mechanism of p53 and downstream targets networks for future studies in cancer therapeutics.
Supplementary Material
Additional File 1Figures S1-S3.
Supplementary Table S1.
Supplementary Table S2.
Supplementary Table S3.
Abbreviations
ceRNA, competing endogenous RNA; HCC, hepatocellular carcinoma; mRNA, messenger RNA; lncRNA, long noncoding RNA; miRNA, microRNA; RISC, RNA-induced silencing complex; DMEM, Dulbecco's Modified Eagle Medium; RNA-seq, transcriptome sequencing; KEGG, Kyoto Encyclopedia of Genes and Genomes; BC, betweenness centrality.
Acknowledgements
This work was financially supported by the Program of the Fundamental Research Funds for the Central Universities of China (2682016YXZT04) and National Natural Science Foundation of China (No.31200999).
Author Contributions
Designed and supervised the experiments: Lili Xiong, Zhiun Guo. Performed the experiments: Wenrong Liu, Yalan Yang. Analyzed the data: Yiming Zhang, Ruofan Ding, Ran Kang, Junhua Meng. Drafted the manuscript Qinging Huang, Yiming Zhang, Zhiyun Guo.
Competing Interests
The authors have declared that no competing interest exists.
References
1. Jonas S, Izaurralde E. Towards a molecular understanding of microRNA-mediated gene silencing. Nature Reviews Genetics. 2015;16:421-33
2. Fatica A, Bozzoni I. Long non-coding RNAs: new players in cell differentiation and development. Nature Reviews Genetics. 2014;15:7-21
3. Gramantieri L, Fornari F, Callegari E, Sabbioni S, Lanza G, Croce CM. et al. MicroRNA involvement in hepatocellular carcinoma. Journal of Cellular and Molecular Medicine. 2008;12:2189-204
4. Huang JL, Zheng L, Hu YW, Wang Q. Characteristics of long non-coding RNA and its relation to hepatocellular carcinoma. Carcinogenesis. 2014;35:507-14
5. Poliseno L, Salmena L, Zhang J, Carver B, Haveman WJ, Pandolfi PP. A coding-independent function of gene and pseudogene mRNAs regulates tumour biology. Nature. 2010;465:1033-8
6. Cesana M, Cacchiarelli D, Legnini I, Santini T, Sthandier O, Chinappi M. et al. A Long Noncoding RNA Controls Muscle Differentiation by Functioning as a Competing Endogenous RNA. Cell. 2011;147:358-69
7. Zhang J, Fan D, Jian Z, Chen GG, Lai PB. Cancer Specific Long Noncoding RNAs Show Differential Expression Patterns and Competing Endogenous RNA Potential in Hepatocellular Carcinoma. PLoS One. 2015;10:e0141042
8. Kruse JP, Gu W. Modes of p53 Regulation. Cell. 2009;137:609-22
9. Brooks CL, Gu W. Ubiquitination, phosphorylation and acetylation: the molecular basis for p53 regulation. Curr Opin Cell Biol. 2003;15:164-71
10. Laptenko O, Prives C. Transcriptional regulation by p53: one protein, many possibilities. Cell Death Differ. 2006;13:951-61
11. Tarasov V, Jung P, Verdoodt B, Lodygin D, Epanchintsev A, Menssen A. et al. Differential regulation of microRNAs by p53 revealed by massively parallel sequencing: miR-34a is a p53 target that induces apoptosis and G1-arrest. Cell cycle. 2007;6:1586-93
12. Hermeking H. MicroRNAs in the p53 network: micromanagement of tumour suppression. Nat Rev Cancer. 2012;12:613-26
13. Kim T, Veronese A, Pichiorri F, Lee TJ, Jeon Y-J, Volinia S. et al. p53 regulates epithelial-mesenchymal transition through microRNAs targeting ZEB1 and ZEB2. Journal of Experimental Medicine. 2011;208:875-83
14. He L, He XY, Lim LP, De Stanchina E, Xuan ZY, Liang Y. et al. A microRNA component of the p53 tumour suppressor network. Nature. 2007;447:1130-U16
15. Suzuki HI, Yamagata K, Sugimoto K, Iwamoto T, Kato S, Miyazono K. Modulation of microRNA processing by p53. Nature. 2009;460:529-33
16. Huarte M, Guttman M, Feldser D, Garber M, Koziol MJ, Kenzelmann-Broz D. et al. A large intergenic noncoding RNA induced by p53 mediates global gene repression in the p53 response. Cell. 2010;142:409-19
17. Hung T, Wang YL, Lin MF, Koegel AK, Kotake Y, Grant GD. et al. Extensive and coordinated transcription of noncoding RNAs within cell-cycle promoters. Nature Genet. 2011;43:621-U196
18. Liu Q, Huang J, Zhou N, Zhang Z, Zhang A, Lu Z. et al. LncRNA loc285194 is a p53-regulated tumor suppressor. Nucleic acids research. 2013;41:4976-87
19. Betel D, Wilson M, Gabow A, Marks DS, Sander C. The microRNA. org resource: targets and expression. Nucleic acids research. 2008;36:D149-D53
20. Kim D, Landmead B, Salzberg SL. HISAT: a fast spliced aligner with low memory requirements. Nat Methods. 2015;12:357-U121
21. Trapnell C, Roberts A, Goff L, Pertea G, Kim D, Kelley DR. et al. Differential gene and transcript expression analysis of RNA-seq experiments with TopHat and Cufflinks. Nat Protoc. 2012;7:562-78
22. Benjamini Y, Hochberg Y. Controlling the false discovery rate: a practical and powerful approach to multiple testing. Journal of the royal statistical society Series B (Methodological). 1995:289-300
23. Yang Y, Liu W, Ding R, Xiong L, Dou R, Zhang Y. et al. Comprehensive Expression Profiling and Functional Network Analysis of p53-Regulated MicroRNAs in HepG2 Cells Treated with Doxorubicin. Plos One. 2016:11
24. Andres-Leon E, Nunez-Torres R, Rojas AM. miARma-Seq: a comprehensive tool for miRNA, mRNA and circRNA analysis. Scientific Reports. 2016:6
25. Robinson MD, McCarthy DJ, Smyth GK. edgeR: a Bioconductor package for differential expression analysis of digital gene expression data. Bioinformatics. 2010;26:139-40
26. McCarthy DJ, Chen Y, Smyth GK. Differential expression analysis of multifactor RNA-Seq experiments with respect to biological variation. Nucleic Acids Research. 2012;40:4288-97
27. Calin GA, Croce CM. MicroRNA signatures in human cancers. Nat Rev Cancer. 2006;6:857-66
28. Freeman LC. A set of measures of centrality based on betweenness. Sociometry. 1977:35-41
29. Botcheva K, McCorkle SR, McCombie W, Dunn JJ, Anderson CW. Distinct p53 genomic binding patterns in normal and cancer-derived human cells. Cell cycle. 2011;10:4237-49
30. Zeron-Medina J, Wang X, Repapi E, Campbell MR, Su D, Castro-Giner F. et al. A polymorphic p53 response element in KIT ligand influences cancer risk and has undergone natural selection. Cell. 2013;155:410-22
31. Younger ST, Kenzelmann-Broz D, Jung H, Attardi LD, Rinn JL. Integrative genomic analysis reveals widespread enhancer regulation by p53 in response to DNA damage. Nucleic acids research. 2015 gkv284
32. Menendez D, Nguyen T-A, Freudenberg JM, Mathew VJ, Anderson CW, Jothi R. et al. Diverse stresses dramatically alter genome-wide p53 binding and transactivation landscape in human cancer cells. Nucleic acids research. 2013 gkt504
33. Botcheva K, McCorkle SR. Cell context dependent p53 genome-wide binding patterns and enrichment at repeats. PloS one. 2014;9:e113492
34. Sammons MA, Zhu J, Drake AM, Berger SL. TP53 engagement with the genome occurs in distinct local chromatin environments via pioneer factor activity. Genome research. 2015;25:179-88
35. Harrow J, Frankish A, Gonzalez JM, Tapanari E, Diekhans M, Kokocinski F. et al. GENCODE: the reference human genome annotation for The ENCODE Project. Genome research. 2012;22:1760-74
36. Guo Z, Maki M, Ding R, Yang Y. Genome-wide survey of tissue-specific microRNA and transcription factor regulatory networks in 12 tissues. Scientific reports. 2014:4
37. Levine AJ. p53, the cellular gatekeeper for growth and division. Cell. 1997;88:323-31
38. Matouk IJ, Mezan S, Mizrahi A, Ohana P, Abu-lail R, Fellig Y. et al. The oncofetal H19 RNA connection: hypoxia, p53 and cancer. Biochimica et Biophysica Acta (BBA)-Molecular Cell Research. 2010;1803:443-51
39. Zhai NL, Xia YF, Yin R, Liu JP, Gao FQ. A negative regulation loop of long noncoding RNA HOTAIR and p53 in non-small-cell lung cancer. Oncotargets and Therapy. 2016;9:5713-20
40. Bommer GT, Gerin I, Feng Y, Kaczorowski AJ, Kuick R, Love RE. et al. p53-mediated activation of miRNA34 candidate tumor-suppressor genes. Curr Biol. 2007;17:1298-307
41. Sun L, Zhang Z, Bailey TL, Perkins AC, Tallack MR, Xu Z. et al. Prediction of novel long non-coding RNAs based on RNA-Seq data of mouse Klf1 knockout study. BMC bioinformatics. 2012;13:331
42. Derrien T, Johnson R, Bussotti G, Tanzer A, Djebali S, Tilgner H. et al. The GENCODE v7 catalog of human long noncoding RNAs: analysis of their gene structure, evolution, and expression. Genome research. 2012;22:1775-89
43. Li L, Eichten SR, Shimizu R, Petsch K, Yeh C-T, Wu W. et al. Genome-wide discovery and characterization of maize long non-coding RNAs. Genome biology. 2014;15:R40
44. Pratt AJ, MacRae IJ. The RNA-induced Silencing Complex: A Versatile Gene-silencing Machine. The Journal of Biological Chemistry. 2009;284:17897-901
45. Wang J, Jiang S, Chen X. Dickkopf-1, an inhibitor of the Wnt signaling pathway, is induced by p53. Oncogene. 2000;19:1843
46. Chen J. The cell-cycle arrest and apoptotic functions of p53 in tumor initiation and progression. Cold Spring Harbor perspectives in medicine. 2016;6:a026104
47. Wright DG, Marchal C, Hoang K, Ankney JA, Nguyen ST, Rushing AW. et al. Human T-cell leukemia virus type-1-encoded protein HBZ represses p53 function by inhibiting the acetyltransferase activity of p300/CBP and HBO1. Oncotarget. 2016;7:1687
48. Sun Y, Xia P, Zhang H, Liu B, Shi Y. P53 is required for Doxorubicin-induced apoptosis via the TGF-beta signaling pathway in osteosarcoma-derived cells. American journal of cancer research. 2016;6:114
49. Beverly LJ, Felsher DW, Capobianco AJ. Suppression of p53 by Notch in lymphomagenesis: Implications for initiation and regression. Cancer Research. 2005;65:7159-68
Author contact
![]() Corresponding authors: Lili Xiong, E-mail: lxiongswjtu.edu.cn; Zhiyun Guo, E-mail: zhiyunguoedu.cn
Corresponding authors: Lili Xiong, E-mail: lxiongswjtu.edu.cn; Zhiyun Guo, E-mail: zhiyunguoedu.cn