International Journal of Biological Sciences
ISSN: 1449-2288
10
Impact Factor
ISSN: 1449-2288
- Current Issue
- Volume 21; 2025
- Volume 20; 2024
- Volume 19; 2023
- Volume 18; 2022
- Volume 17; 2021
- Archive
- Advance Articles
- Editorial Board
- Cover Images
- Index & Coverage
- Cover Suggestion
- Special Issues
Top
Introduction
Entropy for coronary heart...
Entropy for hypertension
Entropy for analyzing cardiac...
Conclusion and Future Aspect
Abbreviations
Acknowledgements
References
Introduction
Entropy for coronary heart...
Entropy for hypertension
Entropy for analyzing cardiac...
Conclusion and Future Aspect
Abbreviations
Acknowledgements
References

 Global reach, higher impact
Int J Biol Sci 2017; 13(10):1320-1328. doi:10.7150/ijbs.19462 This issue Cite
Review
Complexity Change in Cardiovascular Disease
Chang Chen1*, Yu Jin1*, Iek Long Lo2, Hansen Zhao3, Baoqing Sun4, Qi Zhao1, Jun Zheng1, Xiaohua Douglas Zhang1 ![]()
1. Faculty of Health Sciences, University of Macau, Taipa, Macau;
2. Department of Geriatrics, Centro Hospital Conde de Sao Januario, Macau;
3. Department of Cardiovascular Diseases, Beijing Hospital of Chinese Medicine, Capital Medical University, Beijing, China;
4. State Key Laboratory of Respiratory Disease, The 1st Affiliated Hospital of Guangzhou Medical University, Guangzhou, China.
* These authors contributed equally.
Received 2017-2-2; Accepted 2017-4-21; Published 2017-10-17
Citation:
Chen C, Jin Y, Lo IL, Zhao H, Sun B, Zhao Q, Zheng J, Zhang XD. Complexity Change in Cardiovascular Disease. Int J Biol Sci 2017; 13(10):1320-1328. doi:10.7150/ijbs.19462. https://www.ijbs.com/v13p1320.htm
Other stylesAbstract

With the fast development of wearable medical device in recent years, it becomes critical to conduct research on continuously measured physiological signals. Entropy is a key metric for quantifying the irregularity and/or complexity contained in human physiological signals. In this review, we focus on exploring how entropy changes in various physiological signals in cardiovascular diseases. Our review concludes that the direction of entropy change relies on the physiological signals under investigation. For heart rate variability and pulse index, the entropy of a healthy person is higher than that of a patient with cardiovascular diseases. For diastolic period variability and diastolic heart sound, the direction of entropy change is reversed. Our conclusion should not only give valuable guidance for further research on the application of entropy in cardiovascular diseases but also provide a foundation for using entropy to analyze the irregularity and/or complexity of physiological signals measured by wearable medical device.
Keywords: entropy, physiological signal, cardiovascular disease, irregularity, complexity.
Introduction
Cardiovascular disease has become a major disease that threats to our human life. Although diabetes, hypertension and other diseases can't immediately lead to death, but the autonomic nervous system disorders caused by them also have a huge threat to our human life. So how to detect cardiovascular disease becomes very important. The commonly used detection methods including dynamic blood pressure detection technology, dynamic electrocardiogram detection technology, cardiovascular ultrasound technology, positron emission computed tomography and so on. Following the fast development of wearable medical device, entropy based on continuously measured physiological signals could become a tool for disease detection because of its capacity of capturing the feature of nonlinear dynamics.
Entropy was proposed by the German physicist Clausius in 1865. Entropy was originally used to describe a state of substance: "energy degradation". It has a wide range of applications in thermodynamics. At that time entropy is only a physical quantity that can be measured by the change of heat and its meaning is not clear. Until the development of the statistical physics and information theory [1], the meaning of entropy was gradually explained clearly: entropy is the "internal chaos" of a system. Now, entropy has important applications in cybernetics [2], probability theory [3], number theory [4], astrophysics [5], life sciences [6] and other fields [7], and it has also been extended to the more specific definition in different specific disciplines. In biological dynamics, entropy can measure the irregularity or complexity of a person's physiological signals. In this area, approximate entropy [8, 9] and sample entropy [6, 10] are the most commonly used although other entropies, such as fuzzy entropy [11], tone entropy [12, 50] and so on, have been proposed for some specific situations. Multi-scale entropy has been proposed to measure the entropy in different levels or scales of data [6].
For research in diseases, entropy is most commonly used to assess the irregularity and/or complexity of heart rate variability (HRV) [13] which is measured by electrocardiogram (ECG) although it can also be used to measure that of magnetocardiography (MCG), pulse, diastolic heart sound and other physiological signals. HRV is the physiological phenomenon of variation in the time interval between heartbeats (i.e., R-R interval) [14]. HRV represents a quantitative measure which uses the mean and standard deviation of a continuous normal R-R interval to reflect the degree and regularity of changes in heart rate. It determines heart rate's effect on cardiovascular activity [15]. At present, the analysis methods of HRV mainly include linear analysis (time domain analysis [16], frequency domain analysis [17]) and nonlinear analysis. The time domain analysis mainly analyzes the mean and standard deviation of the R-R period. Frequency domain analysis mainly uses Fourier transform and automatic regression analysis model to analyze the high frequency band and low frequency band. Nonlinear analysis of HRV is much more complicated. It is under fast development recently. Entropy analysis belongs to the nonlinear analysis.
Currently, there are many researches on the application of entropy in the irregularity or complexity of heart rate. Early research in this area focused on healthy subjects. For example, Ryan et al. [18] used approximate entropy to find that women's heart rate is higher than the men's in the same conditions. Pikkujamsa et al. [19] used approximate entropy to study the impact of age on the heart rate, and concluded that the heart rate complexity of young people is higher than that of the elderly. Costa et al. [20] also summarizes the rule that the heart rate complexity measured by multi-scale sample entropy decreases with the increase of age or with disease. With further development and application of entropy, researchers have applied entropy for disease diagnosis, prognosis and related problems, so that entropy and other nonlinear dynamic indicators can be used as a diagnosis tool in cardiovascular disease, respiratory disease, diabetes mellitus and other disease.
There are many articles applying entropy on cardiovascular diseases, covering a wide range from disease detection, classification to prognosis and so on. They used different physiological signals and different entropy calculation methods. For example, many ECG data and latest entropy articles can be found in the website http://physionet.org/. Although there are many studies in this area, the present review mainly classifies the linear index of HRV [17, 21], introduces the nonlinear index of HRV [22, 23], or focuses the application of entropy for the research of aging and aging related diseases [24]. They don't summarize the application of entropy in cardiovascular disease in detail, especially in terms of disease classification. Our review focuses on the application of entropy for the cardiovascular diseases diagnosis. We aim at addressing the question about how the entropy changes in cardiovascular diseases and come out summarized results in general. Specifically, we focus on three categories: coronary artery disease (CAD), hypertension, and diabetic complications. For different diseases, we discuss whether we can have a general summarized result on the entropy feature of the disease.
For this review, we searched EMBASE, PubMed, and Google Scholar for the application of entropy in cardiovascular disease until January 2017. The key words for searching were entropy, coronary heart disease, hypertension, diabetes, cardiovascular. Then we selected the articles with the disease diagnosis for the review. After duplication removed, a total of 191 potentially relevant articles in the initial database search were identified. Finally, 25 studies met the selection criteria, including 12 studies for CAD, 7 studies for hypotension, 6 studies for diabetes (Figure 1).
Entropy for coronary heart disease
The artery atherosclerotic lesion causes stenosis or obstruction of the blood vessel lumen. It will result in myocardial ischemia, hypoxia or necrosis, which leads to heart disease finally. CAD also includes cardiovascular stenosis or occlusion caused by inflammation, embolism. CAD diagnosis depends on the typical clinical symptoms. Combined with myocardial injury markers and auxiliary examination, the doctors found evidence of myocardial ischemia or coronary artery occlusion and determined whether there is myocardial necrosis. The most commonly used methods of detecting myocardial ischemia include routine ECG [25], ECG loading tests and radionuclide myocardial imaging. The further examination includes coronary angiography, intravascular ultrasound and so on. Entropy and other kinetic parameters can be used as an aid to detect coronary artery disease and surgical prognosis.
Combined with other nonlinear kinetic parameters, entropy can be used to distinguish patients with CAD from healthy people and roughly determine the severity of the disease in the early detection of CAD. Some literatures attempted to use entropy for automatic classification of CAD [26]. Some literatures compared the autonomic function of patients with CAD, diabetes and healthy control group. These literatures found that the patients have more cardiac autonomic neuropathy (CAN) than the healthy control group.
In the distinction between patients with CAD and healthy people, there are many physiological signals and many types of entropy to use (Table 1). From Table 1 we can see that the most frequently measured physiological signal is HRV (mainly measured by ECG). Wang et al. [27], Acharya et al. [28] and Makikallio et al. [29, 30] Pivatelli et al. [31] all used electrocardiogram data to derive heart rate variability and draw relevant conclusion. However, they used different methods to calculate entropy on HRV, where Wang et al. [27] used multi-scale sample entropy, Acharya et al. [28] used sample entropy, and Makikallio et al. [29, 30], Pivatelli et al. [31] used approximate entropy. They all got the conclusion that the entropy of HRV in patients with coronary heart diseases is lower than the healthy people. This trend of change is also displayed in Figure 1 with data extracted from the studies in five articles [17, 28, 29, 30, 31].
Guo Rui et al. [32, 33] measured the pulse of the experimental subjects. Their first article used the sample entropy based on the test pattern decomposition and their second article used the sample entropy based on 45° diagonal distribution's recursive quantitative analysis. They measured the pulse of people with coronary heart disease and those without disease. Their first article directly reached the result that the pulse entropy of patients with coronary heart diseases is less than that of healthy people, thus the pulse irregularity decreased after the illness. In their second article, the sample entropy of patients with coronary heart disease based on diagonal-recursive graph is higher than that of the healthy control group. It means that CAD patients' recursive map entropy has more diagonal structure than that of the control group. They have higher regularity and certainty. It shows that, when the entropy of the physiological system decreased, regularity increased.
Figure 1
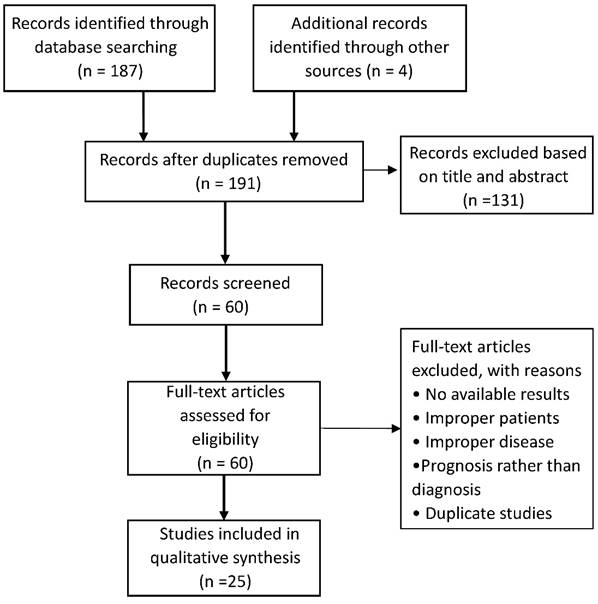
Literature search flow diagram
Table 1
Entropy studies for comparison between healthy people and the patients with coronary artery disease.
| Physiological signal | Entropy method | Study subject | Conclusion |
|---|---|---|---|
| Heart Rate Variability | Sample entropy[28] | 10 patients and 10 healthy people | Healthy people have a higher entropy than patients |
| Approximate entropy [29, 30, 31] | 38 patients and 38 healthy people | ||
| Muti-scale sample entropy[27] | 6 patients and 6 healthy people | ||
| Cardiac Magnetic Field Mapping | Relative entropy[36] | 101 patients and 59 healthy people | Healthy people have a lower entropy than patients |
| Sample entropy[26] | 10 patients, 6 recruit patients | Healthy people have a higher entropy than patients | |
| Pulse of traditional Chinese medicine | Sample entropy[32] Based on Empirical Mode Decomposition | 225 patients and 117 healthy people | Healthy people have a higher entropy than patients |
| Sample entropy[33] Recursive quantitative analysis | 63 patients and 61 healthy people | ||
| Diastolic heart sound | Path length entropy[35] | 15 patients and 16 healthy people | Healthy people have a lower entropy than patients |
| Approximate entropy[34] | 30 patients and 10 healthy people | ||
| Fuzzy Entropy[11] | 28 patients and 30 healthy people |
Ji et al. [11] found that for short-term HRV sequence, entropy can't distinguish healthy people from sick patients well. Consequently he used diastolic period variability (DPV) and refined fuzzy entropy to get the result that the patients with coronary heart diseases have higher DPV entropy. The reason is explained as follows: the increased Fuzzy Entropy of DPV might suggest abnormal beat-to-beat systolic intervals fluctuations in patients with coronary artery stenosis which leads to irregularity in the DPV series. Akay et al. [34] used approximate entropy to measure diastolic heart sound of patients and obtained the conclusion that the entropy of diastolic heart sound in patients with coronary heart diseases is higher than that in healthy people. In fact, the diastolic sound of healthy people should be stable. If the heart sound intensity has a great volatility and high entropy, the heart has the disease. The sensitivity of this method is 77%, indicating that entropy of diastolic heart sound can be used to differentiate healthy subjects from patients with coronary heart disease. Griffel et al. [35] applied the Path Length Entropy to the same measurements, and the same conclusion was reached. They used cardiac diastolic sounds because the diastolic period is much longer than the systolic period in the heartbeat of the cardiac cycle and it is easier to measure.
Gapelyuk et al. [36] used relative entropy [37] to study the myocardial magnetic field localization, and obtained the result that, for the heart magnetic map, the relative entropy of the healthy human is lower than that of the sick person. Since the relative entropy represents the degree of fitting of the two distributions, the distribution of the measured RQS or STT interval waves is closer to the standard normal wave and the relative entropy is lower. This is different from other entropy measurements. They got the results: the relative entropy of healthy people is close to 0, while the relative entropy of the patient is in the vicinity of 0.2. The result is the same as what should come out theoretically. Steinisch et al. [26] also explored the entropy of the magnetic map data, but used sample entropy instead of relative entropy.
It is worth noting that entropy is part of the nonlinear dynamic index. Entropy can be used in a wide range including ECG data, MCG data and so on, but its calculation methods are diverse, such as sample entropy, approximate entropy and so on. Different methods may be suitable for different physiological signals. We also see in the previous literature that it can't directly conclude that low entropy means healthy, so we need a concrete analysis of the situation.
Through our review on the entropy studies, we obtain the following summarized results. For the studies on HRV and pulse, the entropy in a healthy person is higher than that in a patient. For the DPV and diastolic heart sound, the entropy in a healthy person is lower than that of a patient. For the magnetic cardiogram, we need to distinguish the type of entropy: the relative entropy is higher in patients, the sample entropy is higher in healthy people.
Entropy for hypertension
Hypertension is a common chronic disease. It's also the most important risk factors of cardiovascular disease. Hypertension is divided into primary hypertension and secondary hypertension. In this review, we focus on the primary hypertension and its complications. We mainly compared the special populations: pregnant women with hyperthyroidism and their neonatal cardiac entropy. We also compared the entropy of the autonomic dysfunction caused by hypertension.
For hypertension and diabetes, the researchers compared the cardiac entropy in a specific population (pregnant women and their newborns). Park et al. [38] calculated the HRV through approximate entropy and compared with pregnant women with pregnancy-induced hypertension, gestational diabetes mellitus, anemia and healthy pregnant women's heart rate entropy. They found that the heart rate entropy of pregnant women is lower than healthy pregnant women. If the pregnant women bore newborns, the babies' heart rate entropy was also lower than normal. The anemia patients had the lowest cardiac entropy.
Table 2
Entropy studies for comparison between healthy people and the patients with hypertension
| Physiological signal | Entropy method | Study subject | Conclusion |
|---|---|---|---|
| ECG | Maximum entropy power spectrum | 30 middle-aged (aged≤59 years) patients and the 27 elderly (aged≥60 years) patients [42] | The entropy of frequency band is significantly lower in elderly hypertensive patients than in middle-aged patients |
| 31 dipper patients and 31 non-dipper patients [43] | The entropy of frequency band is significantly lower in dipper patients than in non-dipper patients | ||
| 44 the Kazaks patients dipper patients, 47 non-dipper patients [44] | |||
| 53 hospitalized essential hypertensive patients with different left ventricular mass index [45] | Patients with a high left ventricular mass index have lower entropy values than patients with a low left ventricular mass index. Note, high indicates severe cardiovascular disease |
Tejera et al. [39] calculated both approximate entropy and sample entropy of HRV. They compared the cardiac entropy of pregnant women with pregnancy-induced hypertension, congenital eclampsia, and healthy pregnant women. The results confirmed that for pregnant women with the same time of pregnancy, healthy pregnant women have the highest entropy and congenital eclampsia patients have the lowest entropy.
Kul Yum et al. [40] calculated the approximate entropy of HRV in newborns with pulmonary hypertension and normal neonates. The entropy in the newborns with neonatal pulmonary hypertension is lower than that in normal neonates. They associated pulmonary artery pressure with it, and found that pulmonary hypertension induced by left- to-right shunt lesions suppresses both periodic and complex heart rate oscillation. The mean pulmonary artery pressure can be predicted by calculating the approximate entropy of heart rate variability.
For the CAN caused by hypertension, many articles investigated the autonomic nervous function in patients with essential hypertension. They took the R-R interval power spectrum analysis, and used the ECG method to obtain low-frequency band (LFB) and high frequency band (HFB) through the maximum entropy every 10 minutes [41]. The LFB and HFB represent parasympathetic activity, sympathetic nerve activity and parasympathetic activities respectively.
From Table 2, Kohara et al. [42] aimed at middle-aged patients and young patients. Both LFB and HFB were significantly lower in elderly hypertensive patients than that in middle-aged patients. They also aimed at non-dipper patients and dipper patients [43]. The findings indicate that compared with dipper patients, non-dipper hypertensive patients were characterized with a decreased physiological circadian fluctuation on autonomic functions. Kawamura et al. [44] did the same research for Kazak non-dipper patients and dipper patients, and got the same conclusion. Kohara et al. also used maximum entropy power spectrum to compare the patients with essential hypertension relationship between autonomic nervous activity and the left ventricular mass index [45]. The conclusion is that the left ventricular mass index is negatively correlated with the total low frequency and total high frequency.
The general conclusion is: when calculating the HFB and LFB by using the maximum entropy power spectrum, the lower the frequency means the worse the autonomic nerve function. The older people are worse than the young people; the patients with dipper hypertension are worse than the non-dipper patients; patients with a high left ventricular mass index (indicative a severe cardiovascular disease) are worse than those with a low left ventricular mass index.
Entropy for analyzing cardiac autonomic never function damage caused by diabetes
Strictly speaking, diabetes is not a cardiovascular disease. In this review, we mainly focus on one of the most important complications of diabetes: cardiac autonomic nervous system dysfunction. This is related to cardiovascular activity and there are many relevant research literature, so we also discussed it in this review.
The present article mainly uses the diabetes' HRV data to analyze the cardiac autonomic nerve function damage caused by diabetes. From the Table 3, we can see that Souza et al. [46], Marwaha et al. [47], and Li et al. [48] measured the HRV data in diabetic patients and healthy people as experimental and control groups, but they used different entropy: Shannon entropy, improved multiscale sample entropy, approximate entropy, respectively. They got the same conclusion: the HRV entropy of diabetic patients is lower than the healthy control group. Combined as other nonlinear dynamical parameters, entropy can be served as an additional supplemental tool for the conventional autonomic tests. Then Wu et al. [49] and Karmakar et al. [50] focused on diabetic patients with mild and severe diabetes, but they use different entropy and different measurement data. In the end, they got the same conclusion. Wu measured the pulse conduction time. They used multiscale cross-approximate entropy for their analysis, whereas Karmakar measured ECG data by using tone entropy. Their conclusion is: with the increase in the severity of disease, the HRV entropy is significantly lower. Khandoker et al. [51] used sample entropy to calculate the entropy of HRV. They found the same conclusion.
In summary, although the calculation method of entropy is different, the results are similar. That is, for entropy of HRV, higher entropy value means healthier people. We further display this feature by extracting summarized data from the 5 articles [46-50] and drawing a figure (Figure 3). From Figure 3, we can see clearly that no matter what the type of entropy is, the entropy of HRV in a healthy person is higher than that in a patient with diabetes.
Table 3
Entropy studies for comparison between healthy people and the patients with diabetes-induced cardiac autonomic neuropathy (CAN).
| Physiological signal | Entropy method | Study subject | Conclusion |
|---|---|---|---|
| Heart Rate Variability | Shannon entropy | 20 patients with type 1 diabetes mellitus (DM) and 23 healthy people. [46] | Healthy people have a higher entropy than patients |
| Improved multiscale sample entropy | 16 patients with type 2 DM, 15 healthy people [47] | Healthy people have a higher entropy than patients | |
| Approximate entropy | 63 patients with type 2 DM, 29 healthy people [48] | Healthy people have a higher entropy than patients | |
| Sample entropy | 9 diabetic patients with CAN, 8 diabetic patients without CAN [51] | Patients without CAN have a higher entropy than patients with CAN | |
| RR interval Pulse conduction time | Multiscale cross-approximate entropy | 32 young healthy people, 36 healthy upper middle-aged people,31 patients with well controlled type 2 DM, 24 patients with poorly controlled type 2 DM [49] | Healthy people have a higher entropy than patients; Young people have a higher entropy than elderly |
| ECG | Tone entropy | 55 patients alive after 8 years of study, 18 patients with cardiac related mortality [50] | Patients with severe disease have lower entropy than those with mild disease |
Figure 2
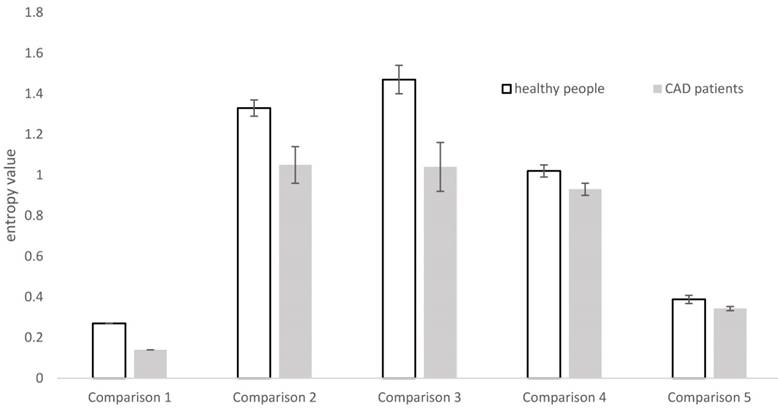
Entropy of heart rate variability in studies for coronary artery disease (CAD). In each bar, the standard error of the mean in each group is represented by the vertical line above the mean. Comparison 1 uses the multiscale sample entropy and doesn't have the data for standard error from the study in article [27]. Comparison 2 uses approximate entropy whereas comparison 3 uses sample entropy; both for the same data in the study in article [28]. Comparison 4 uses approximate entropy for the study in article [29]. Comparison 5 uses approximate entropy for the study in [31].
Figure 3
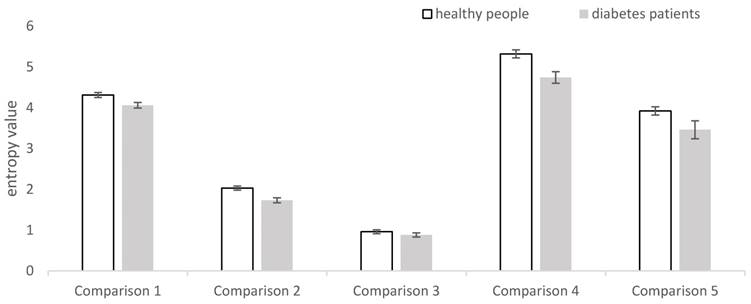
Entropy of heart rate variability in studies for cardiac autonomic nervous system dysfunction of diabetes. In each bar, the standard error of the mean in each group is represented by the vertical line above the mean. Comparison 1 uses the Shannon entropy for the study in [46]. Comparison 2 uses the improved multiscale sample entropy for the study in [47]. Comparison 3 use the approximate entropy for the study in [48]. Comparison 4 use the multiscale cross approximate entropy for the study in [29]. Comparison 5 use the tone entropy for the study in [50]. Comparison 1 is for comparing type 1 diabetes with healthy people, and the remaining pairs are for comparing type 2 diabetes with healthy people.
Conclusion and Future Aspect
For the upcoming era of digital medicine, the continuous monitoring of human's physiological signals and associated entropy analysis are getting more and more critical. Currently, there are many studies for cardiovascular diseases in this area [c.f., 6, 8-12, 24, 26, 27-50]. However, as far as we know, no one has published a sophisticated review specifically on the entropy analysis of cardiovascular diseases. There are key questions to be answered only through reviews on all available relevant studies. For example, one review focusing on the application of entropy for aging and aging related diseases [24] mentions that, for HRV, the entropy of a healthy person is higher than that of a patient with cardiovascular diseases in general? Is it true based on all the major related research in this area? How about the entropy of other physiological signals such as DPV and heart sound? Thus, in this article, we conduct a sophisticated review to address these key questions. Through our review, we obtained the following summarized results based on the available relevant studies that we searched through literature.
For HRV, in the three major disease areas (i.e., coronary heart disease, hypertension, diabetes complications), no matter how the entropy calculation method is used (namely, whether Shannon entropy, sample entropy, approximate entropy, tone entropy or maximum entropy power spectrum is used), the entropy of healthy people is higher than that of the patients and the entropy decreases as the severity of the disease increases (Tables 1-3). For the pulse index, the results on the entropy analysis is the same as those for HRV. For DPV in CAD, the Fuzzy entropy of the healthy people is lower than that of the patients. For diastolic heart sound, the entropy of a healthy person is lower than that of a patient whether the entropy is assessed by approximate entropy or path length entropy. For MCG, whether a healthy person has a higher entropy value than a CAD patient relies on the used entropy. A healthy person has a higher entropy value when using sample entropy but a lower value when using relative entropy than a patient (Table 1).
The explanation for the above summarized results can be complicated. One explanation for a higher entropy of HRV in a healthy person relative to a cardiovascular patient is to use heart autonomic nerve function: higher entropy, better heart autonomic nerve function [13]. One explanation for a lower entropy of DPV in a healthy person relative to a CAD patient is that CAD patients may have abnormal beat-to-beat systolic intervals fluctuations which leads to irregularity in the DPV series [11]. For MCG, the data are high-dimensional, consequently it must go through a process of dimensional reduction before entropy can be calculated. When the data is reduced to one dimension, sample entropy and similar entropy can be calculated. The entropy results are similar to those of HRV. Relative entropy is calculated in the case where the data are reduced to three dimensions as compared to a reference distribution coming from healthy people. If the distribution is similar to the reference distribution, the relative entropy is low. If the two distributions are completely coincident, the entropy is 0. Thus, the relative entropy of a patient should at least no less than that of a healthy person [37]. Therefore, the relative entropy actually measures different things as sample entropy and other regular entropy does. With this in mind, the entropy results for MCG is actually similar to those for HRV.
Multiple studies used entropy to distinguish between a healthy person and an ill person with good performance in some situations [cf. 26, 31, 34-36, 50-51]. For example, Akay et al. [34] used approximate entropy of diastolic heart sounds to distinguish between CAD and non-CAD patients and obtained sensitivity of 77%, a specificity of 80%, and an overall accuracy of 78%. Steinisch et al. [26] used sample entropy of MCG to distinguish between CAD patients and healthy people and obtained good performance: 99% sensitivity, 97% specificity, 98% accuracy, 96% and 99% positive and negative predictive values respectively [26]. To distinguish between CAN and non-CAN patients, Khandoker et al. [51] obtained 82.35% accuracy, 100% sensitivity and 62.5% specificity when using sample entropy of HRV alone and 88.24% accuracy, 100% sensitivity and 75% specificity when using the combination of sample entropy and Poincaré plot.
However, the use of entropy for discrimination and classification does not have a broad utility yet based on all available literature. One reason may be that, although a variety of entropy measures have been proposed, none of them have a broad utility in all the major physiological signals. One of the entropy measures, sample entropy, tends to get more and more popular among all the available entropy measures. However, the calculation of sample entropy requires the adjustment of multiple parameters such as embedding dimension and tolerance and different settings on these parameters may lead to different results. Consequently, entropy alone can hardly be used as a clinically valid diagnosis tool at present. In addition, different entropies may be suitable for different physiological signals. Thus, currently, it is more practical to explore the overall trend of entropy change in different disease statuses as we did in this review. In the future, research can be conducted to explore better and more stable entropy measures with broader usage in various major physiological signals.
In all, through the summarized results coming out of our review on the application of entropy in cardiovascular diseases, we conclude that the direction of entropy change heavily relies on the physiological signals under investigation. We confirmed that, for HRV, the entropy of a healthy person is higher than that of a patient with cardiovascular diseases in all existing literature that we have searched. This is also true for pulse index. However, for DPV and diastolic heart sound, the direction of entropy change is reversed: the entropy of a healthy person is lower than that of a CAD patient. These above results hold regardless of the different types of entropy to be used in the studies. For MCG, a healthy person has a higher entropy value than a CAD patient if using regular entropy such as sample entropy. Our conclusion should not only give valuable guidance for further research on the application of entropy in cardiovascular diseases but also provide a foundation for using entropy to analyze the entropy of physiological signals measured by wearable medical device.
Abbreviations
HRV: heart rate variability; ECG: electrocardiogram; MCG: magnetocardiography; CAD: coronary artery disease; CAN: cardiac autonomic neuropathy; DPV: diastolic period variability; LFB: low-frequency band; HFB: high frequency band; CCM: complex correlation measure; DM: diabetes mellitus.
Acknowledgements
This work was supported by the Start-up Research Grant (SRG2016-00083-FHS) at University of Macau.
Competing Interests
The authors have declared that no competing interest exists.
References
1. Shannon CE, Weaver W. The Mathematical Theory of Information. Mathematical Gazette. 1949;97:170-80
2. Cibert C. Entropy and information in flagellar axoneme cybernetics: a radial spokes integrative function. Cell Motility & the Cytoskeleton. 2003;54:296-316
3. Dan V. The Analogues of Entropy and of Fisher's Information Measure in Free Probability Theory: VI. Liberation and Mutual Free Information. Communications in Mathematical Physics. 1993;155:71-92
4. Maslov VP, Maslova TV. Main axiom of thermodynamics and entropy of number theory: Tunnel and ultrasecond quantization. Mathematical Notes. 2011;90:385-97
5. Miller F P, Vandome A F, Mcbrewster J. Entropy (astrophysics). California,USA: Alphascript Publishing. 2010
6. Costa M, Goldberger AL, Peng CK. Multiscale entropy analysis of biological signals. Physical review E, Statistical, nonlinear, and soft matter physics. 2005;71:021906
7. Niu H, Wang J. Quantifying complexity of financial short-term time series by composite multiscale entropy measure. Communications in Nonlinear Science & Numerical Simulation. 2015;22:375-82
8. Pincus SM. Approximate entropy as a measure of system complexity. Proceedings of the National Academy of Sciences of the United States of America. 1991;88:2297-301
9. Kaplan DT, Furman MI, Pincus SM, Ryan SM, Lipsitz LA, Goldberger AL. Aging and the complexity of cardiovascular dynamics. Biophysical journal. 1991;59:945-9
10. Richman JS, Moorman JR. Physiological time-series analysis using approximate entropy and sample entropy. Ajp Heart & Circulatory Physiology. 2000;278:H2039
11. Ji L, Li P, Li K, Wang X, Liu C. Analysis of short-term heart rate and diastolic period variability using a refined fuzzy entropy method. Biomedical engineering online. 2015;14:64
12. Jelinek HF, Md Imam H, Al-Aubaidy H, Khandoker AH. Association of cardiovascular risk using non-linear heart rate variability measures with the framingham risk score in a rural population. Frontiers in physiology. 2013;4:186
13. Malik M. Heart Rate Variability: Standards of Measurement, Physiological Interpretation, and Clinical Use: Task Force of The European Society of Cardiology and the North American Society for Pacing and Electrophysiology. Genes Chromosomes & Cancer. 1996;17:354
14. Richman JS, Moorman JR. Physiological time-series analysis using approximate entropy and sample entropy. Ajp Heart & Circulatory Physiology. 2000;278:H2039-H49
15. Akselrod S, Gordon D, Ubel FA, Shannon DC, Barger AC, Cohen RJ. Power Spectrum Analysis of Heart Rate Fluctuation: A Quantitative Probe of Beat-To-Beat Cardiovascular Control. Science (New York, NY). 1981;213:220-2
16. Balocchi R, Cantini F, Varanini M, Raimondi G, Legramante JM, Macerata A. Revisiting the potential of time-domain indexes in short-term HRV analysis. Biomedizinische Technik Biomedical Engineering. 2006;51:190-3
17. Acharya UR, Joseph KP, Kannathal N, Lim CM, Suri JS. Heart rate variability: a review. Medical & biological engineering & computing. 2006;44:1031-51
18. Ryan SM, Goldberger AL, Pincus SM, Mietus J, Lipsitz LA. Gender- and age-related differences in heart rate dynamics: are women more complex than men? Journal of the American College of Cardiology. 1994;24:1700-7
19. Pikkujamsa SM, Makikallio TH, Sourander LB, Raiha IJ, Puukka P, Skytta J. et al. Cardiac interbeat interval dynamics from childhood to senescence: comparison of conventional and new measures based on fractals and chaos theory. Circulation. 1999;100:393-9
20. Costa MD, Goldberger AL. Generalized Multiscale Entropy Analysis: Application to Quantifying the Complex Volatility of Human Heartbeat Time Series. Entropy (Basel, Switzerland). 2015;17:1197-203
21. Melillo P, Formisano C, Bracale U, Pecchia L. Classification tree for real-life stress detection using linear Heart Rate Variability analysis. Case study: students under stress due to university examination. Ifmbe Proceedings. 2013;39:477-80
22. Voss A, Schulz S, Schroeder R, Baumert M, Caminal P. Methods derived from nonlinear dynamics for analysing heart rate variability. Philosophical Transactions. 2009;367:277-96
23. Stein PK, Reddy A. Non-Linear Heart Rate Variability and Risk Stratification in Cardiovascular Disease. Indian Pacing & Electrophysiology Journal. 2005;5:210-20
24. Blokh D, Stambler I. The application of information theory for the research of aging and aging-related diseases. Progress in neurobiology. 2016 DOI: 10.1016/j.pneurobio.2016.03.005 [Epub ahead of print]
25. Linderholm H, Osterman G, Teien D. Detection of coronary artery disease by means of exercise ECG in patients with aortic stenosis. Journal of Internal Medicine. 1985;218:181-8
26. Steinisch M, Torke PR, Haueisen J, Hailer B, Gronemeyer D, Van Leeuwen P. et al. Early detection of coronary artery disease in patients studied with magnetocardiography: an automatic classification system based on signal entropy. Computers in biology and medicine. 2013;43:144-53
27. Wang J, Ning X, Li J, Ma Q, Xu Y, Bian C. Multiscale entropy analysis of electrocardiogram. Journal of biomedical engineering. 2007;24:978-80
28. Acharya UR, Faust O, Sree V, Swapna G, Martis RJ, Kadri NA. et al. Linear and nonlinear analysis of normal and CAD-affected heart rate signals. Computer methods and programs in biomedicine. 2014;113:55-68
29. Makikallio TH, Ristimae T, Airaksinen KE, Peng CK, Goldberger AL, Huikuri HV. Heart rate dynamics in patients with stable angina pectoris and utility of fractal and complexity measures. The American journal of cardiology. 1998;81:27-31
30. Makikallio TH, Seppanen T, Niemela M, Airaksinen KE, Tulppo M, Huikuri HV. Abnormalities in beat to beat complexity of heart rate dynamics in patients with a previous myocardial infarction. Journal of the American College of Cardiology. 1996;28:1005-11
31. Pivatelli FC, Dos Santos MA, Fernandes GB, Gatti M, de Abreu LC, Valenti VE. et al. Sensitivity, specificity and predictive values of linear and nonlinear indices of heart rate variability in stable angina patients. International archives of medicine. 2012;5:31
32. Guo R, Wang Y, Yan H, Yan J, Yuan F, Xu Z. et al. Analysis and Recognition of Traditional Chinese Medicine Pulse Based on the Hilbert-Huang Transform and Random Forest in Patients with Coronary Heart Disease. Evidence-based complementary and alternative medicine: eCAM. 2015;2015:895749
33. Guo R, Wang YQ, Yan JJ, Yan HX, Yang YC. Study of traditional Chinese medicine pulse signals in patients with coronary heart disease based on recurrence quantification analysis. Journal of Chinese integrative medicine. 2011;9:1226-33
34. Akay M, Akay YM, Gauthier D, Paden RG, Pavlicek W, Fortuin FD. et al. Dynamics of diastolic sounds caused by partially occluded coronary arteries. IEEE transactions on bio-medical engineering. 2009;56:513-7
35. Griffel B, Zia MK, Fridman V, Saponieri C, Semmlow JL. Path length entropy analysis of diastolic heart sounds. Computers in biology and medicine. 2013;43:1154-66
36. Gapelyuk A, Schirdewan A, Fischer R, Wessel N. Cardiac magnetic field mapping quantified by Kullback-Leibler entropy detects patients with coronary artery disease. Physiological measurement. 2010;31:1345-54
37. Vedral V. The Role of Relative Entropy in Quantum Information Theory. Review of Modern Physics. 2001;74:197-234
38. Park YS, Hoh JK. Complex and irregular heart rate dynamics in fetuses compromised by maternal anemia as a high-risk pregnancy. Journal of perinatal medicine. 2015;43:741-8
39. Tejera E, Areias MJ, Rodrigues AI, Nieto-Villar JM, Rebelo I. Blood pressure and heart rate variability complexity analysis in pregnant women with hypertension. Hypertension in pregnancy. 2012;31:91-106
40. Kul Yum M, Su Kim N. Change of complex and periodic heart rate dynamics with change of pulmonary artery pressure in infants with left-to-right shunt lesion. International journal of cardiology. 1997;60:143-50
41. Ulrych TJ. Maximum entropy power spectrum of truncated sinusoids. Journal of Geophysical Research Atmospheres. 1972;77:1396-400
42. Kohara K, Igase M, Maguchi M, Fukuoka T, Kitami Y, Hiwada K. Autonomic nervous function in essential hypertension in the elderly. Evaluation by power spectral analysis of heart rate variability. American journal of hypertension. 1996;9:1084-9
43. Kohara K, Nishida W, Maguchi M, Hiwada K. Autonomic nervous function in non-dipper essential hypertensive subjects. Evaluation by power spectral analysis of heart rate variability. Hypertension (Dallas, Tex: 1979). 1995;26:808-14
44. Kawamura H, Ozawa Y, Izumi Y, Kasamaki Y, Nakayama T, Mitsubayashi H. et al. Non-dipping blood pressure variations in adult Kazakhs are derived from decreased daytime physical activity and increased nighttime sympathetic activity. Clinical and experimental hypertension (New York, NY: 1993). 2016;38:194-202
45. Kohara K, Hara-Nakamura N, Hiwada K. Left ventricular mass index negatively correlates with heart rate variability in essential hypertension. American journal of hypertension. 1995;8:183-8
46. Souza NM, Giacon TR, Pacagnelli FL, Barbosa MP, Valenti VE, Vanderlei LC. Dynamics of heart rate variability analysed through nonlinear and linear dynamics is already impaired in young type 1 diabetic subjects. Cardiology in the young. 2016;26:1383-90
47. Marwaha P, Sunkaria RK. Exploring total cardiac variability in healthy and pathophysiological subjects using improved refined multiscale entropy. Medical & biological engineering & computing. 2017;55:191-205
48. Li X, Yu S, Chen H, Lu C, Zhang K, Li F. Cardiovascular autonomic function analysis using approximate entropy from 24-h heart rate variability and its frequency components in patients with type 2 diabetes. Journal of diabetes investigation. 2015;6:227-35
49. Wu HT, Liu CC, Lo MT, Hsu PC, Liu AB, Chang KY. et al. Multiscale cross-approximate entropy analysis as a measure of complexity among the aged and diabetic. Computational and mathematical methods in medicine. 2013;2013:324325
50. Karmakar C, Jelinek H, Khandoker A, Tulppo M, Makikallio T, Kiviniemi A. et al. Identifying increased risk of post-infarct people with diabetes using multi-lag Tone-Entropy analysis. Conference proceedings: Annual International Conference of the IEEE Engineering in Medicine and Biology Society IEEE Engineering in Medicine and Biology Society Annual Conference. 2012;2012:25-8
51. Khandoker AH, Jelinek HF, Palaniswami M. Identifying diabetic patients with cardiac autonomic neuropathy by heart rate complexity analysis. Biomedical engineering online. 2009;8:3
Author contact
![]() Corresponding author: Email: douglaszhangmo
Corresponding author: Email: douglaszhangmo
Citation styles
APA
Chen, C., Jin, Y., Lo, I.L., Zhao, H., Sun, B., Zhao, Q., Zheng, J., Zhang, X.D. (2017). Complexity Change in Cardiovascular Disease. International Journal of Biological Sciences, 13(10), 1320-1328. https://doi.org/10.7150/ijbs.19462.
ACS
Chen, C.; Jin, Y.; Lo, I.L.; Zhao, H.; Sun, B.; Zhao, Q.; Zheng, J.; Zhang, X.D. Complexity Change in Cardiovascular Disease. Int. J. Biol. Sci. 2017, 13 (10), 1320-1328. DOI: 10.7150/ijbs.19462.
NLM
Chen C, Jin Y, Lo IL, Zhao H, Sun B, Zhao Q, Zheng J, Zhang XD. Complexity Change in Cardiovascular Disease. Int J Biol Sci 2017; 13(10):1320-1328. doi:10.7150/ijbs.19462. https://www.ijbs.com/v13p1320.htm
CSE
Chen C, Jin Y, Lo IL, Zhao H, Sun B, Zhao Q, Zheng J, Zhang XD. 2017. Complexity Change in Cardiovascular Disease. Int J Biol Sci. 13(10):1320-1328.
This is an open access article distributed under the terms of the Creative Commons Attribution (CC BY-NC) license (https://creativecommons.org/licenses/by-nc/4.0/). See http://ivyspring.com/terms for full terms and conditions.