Impact Factor ISSN: 1449-2288
- Issue 9; 2026
- Issue 8; 2026
- Issue 7; 2026
- Issue 6; 2026
- Issue 5; 2026
- Volume 22; 2026
- Past Issues
- Advance Articles
- Editorial Board
- Cover Images
- Index & Coverage
- Cover Suggestion
- Special Issues
Introduction
Materials and Methods
Results
Discussion
Supplementary Material
Acknowledgements
References

 Global reach, higher impact
Int J Biol Sci 2017; 13(11):1361-1372. doi:10.7150/ijbs.21657 This issue Cite
Research Paper
Co-expression network analysis identified FCER1G in association with progression and prognosis in human clear cell renal cell carcinoma
Liang Chen1, Lushun Yuan1, Yongzhi Wang1, Gang Wang1, Yuan Zhu1,2, Rui Cao1, Guofeng Qian3, Conghua Xie4, Xuefeng Liu5, Yu Xiao1,2,6 ![]() , Xinghuan Wang1
, Xinghuan Wang1 ![]()
1. Department of Urology, Zhongnan Hospital of Wuhan University, Wuhan, China
2. Laboratory of Precision Medicine, Zhongnan Hospital of Wuhan University, Wuhan, China
3. Department of Endocrinology, The First Affiliated Hospital of Zhejiang University, Hangzhou, China
4. Department of Radiation and Medical Oncology, Zhongnan Hospital of Wuhan University, Wuhan, China
5. Department of Pathology, Lombardi Comprehensive Cancer Center, Georgetown University Medical School, Washington DC, USA
6. Department of Biological Repositories, Zhongnan Hospital of Wuhan University, Wuhan, China
Received 2017-6-28; Accepted 2017-9-4; Published 2017-11-1
Abstract

Clear cell renal cell carcinoma (ccRCC) is the most common solid lesion within kidney, and its prognostic is influenced by the progression covering a complex network of gene interactions. In current study, the microarray data GSE66272 containing ccRCC and adjacent normal tissues was analyzed to identify 4042 differentially expressed genes, on which weighted gene co-expression network analysis was performed. Then 12 co-expressed gene modules were identified. The highest association was found between blue module and pathological stage (r = -0.77) by Pearson's correlation analysis. Functional enrichment analysis revealed that biological processes of blue module focused on inflammatory response, immune response, chemotaxis (all p < 1e-10). In the significant module, a total of 38 network hub genes were identified, FCER1G exhibited the highest correlation (r = 0.95) with ccRCC progression. In addition, FCER1G was hub node in the protein-protein interaction network of the genes in blue module as well. Thus, FCER1G was subsequently selected for validation. In the test set GSE53757 and RNA-sequencing data, FCER1G expression was also positively correlated with four stages of ccRCC progression (p < 0.001). Receiver operating characteristic (ROC) curve indicated that FCER1G could distinguish localized (pathological stage I, II) from non-localized (pathological stage III, IV) ccRCC (AUC=0.74, p < 0.001). Besides, FCER1G could be a prognostic gene in clinical practice as well, revealed by survival analysis based on RNA-sequencing data (p < 0.05). In conclusion, using weighted gene co-expression analysis, FCER1G was identified and validated in association with ccRCC progression and prognosis, which might improve the prognosis by influencing immune-related pathways.
Keywords: clear cell renal cell carcinoma (ccRCC), weighted gene co-expression network analysis (WGCNA), FCER1G, prognosis, pathological stage, Receiver operating characteristic (ROC).
Introduction
Renal cancer is one of the ten most common cancers in the west, with an annual incidence of 2 % to 4 % [1]. Approximately 90% of renal cancers are renal cell carcinoma (RCC), most of which (70 % - 85 %) are clear cells subtype (ccRCC) [2]. According to tumor size, the extent of invasion outside of the kidney, lymph node involvement and tumor metastasis, RCC can be classified into four different pathological stages , including stage I, stage II, stage III, stage IV [3]. The higher pathological stage leads to lower survival rate of the patients with RCC and the five-year survival rates of the four stages are 95%, 88%, 59% and 20%, respectively [4]. Localized renal cell carcinoma can be cured by surgery treatment, however, the survival rate of patients sharply declined once the disease became metastatic. ccRCC is usually resistant to chemotherapy, targeted therapies have been exploited for their target specificity and low toxicity, so they can be the best choice of non-surgical treatments [5]. Many of them have been approved for clinical use such as multi-kinase inhibitors, anti-VEGF antibodies and mTOR [6]. Survival of patients indeed have been improved by the new therapies, however, median progression-free and overall survival are nearly 2 years, most patients eventually become resistance and surrender [5]. Therefore, more effective biomarkers and therapeutic targets are urgent needed.
At present, with the development of high-throughput microarray technology, gene expression profiles have been used to identify genes associated with progression of renal cancer [7-9]. However, most studies focused on the screening of differentially expressed genes and ignored the high degree of interconnection between genes, although genes with similar expression patterns may be functionally related [10]. Weighted gene co-expression network analysis (WGCNA) has been used to investigate the associations between gene sets and clinical charactaristics by constructing scale free gene co-expression networks [11]. Recently, many studies have performed WGCNA using microarray or RNA sequencing data to screen hub genes and modules related with clinical characteristics such as tumor stage, grade and metastasis among different tumor types including papillary renal cell carcinoma [12] and hepatocellular carcinoma [13]. Thus, we attempt to construct a co-expression network of relationships between genes through a systematic biology method based on a weighted genome expression network (WGCNA) and to identify network-centric genes associated with different stages of disease progression of renal cancer [14-16].
Materials and Methods
Data collection
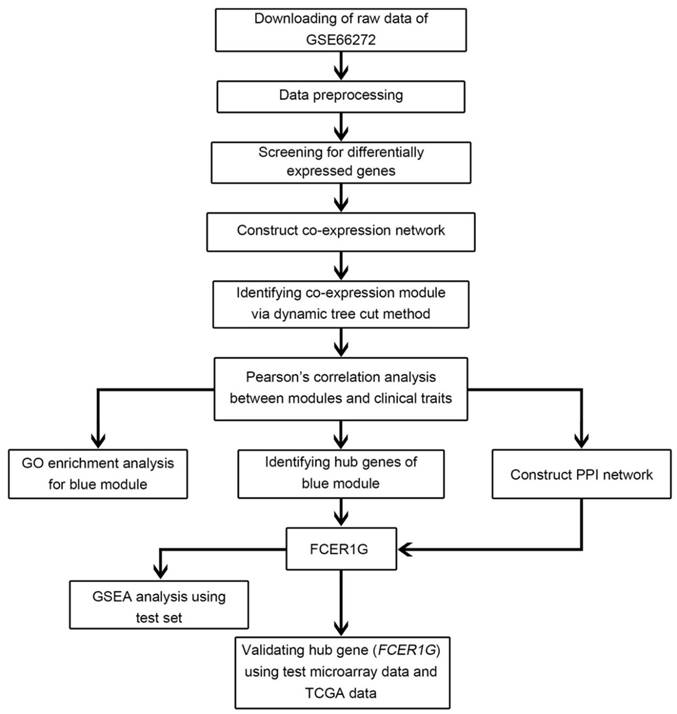
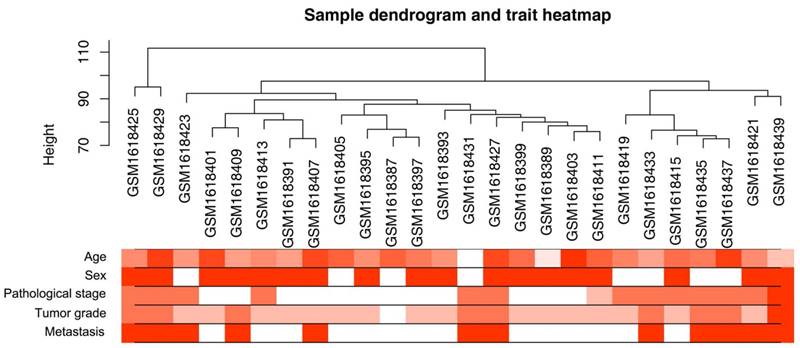
A workflow of the study was shown in Figure 1. Microarray dataset of clear cell renal cell carcinoma was downloaded from Gene Expression Omnibus (GEO) database (http://www.ncbi.nlm.nih.gov/geo/). Dataset GSE66272 [17] performed on Affymetrix Human Genome U133 Plus 2.0 Array (Affymetrix, Santa Clara, CA, USA) was used to construct co-expression networks and identify hub genes in this study. This dataset included 27 normal kidney tissues and 26 ccRCC tissues with different pathological stages (I - IV), tumor grades (grade 1 - 4) and metastasis (yes or no) (Figure 2). One sarcoma sample GSM1618417 was removed from the subsequent analysis in the GSE66272. Another independent dataset of GSE53757 [18] was also downloaded from GEO and used as a test set to verify our results. This dataset included 72 normal kidney tissues and 72 ccRCC tissues with different tumor stages (1-4). Moreover, RNA-sequencing data sets and clinical information were downloaded from The Cancer Genome Atlas (TCGA) database (https://genome-cancer.ucsc.edu/) to further verify our results. The gene expression data were based on the RNA-sequencing technology of IlluminaHiseq. The detailed information of the training dataset and the two testing datasets was shown in Supplementary Table 1.
Flow chart of data preparation, processing, analysis and validation in this study.
Clustering dendrogram of 26 tumor samples and the clinical traits. The clustering was based on the expression data of differentially expressed genes between tumor samples and non-tumor samples in ccRCC. The red color represented metastasis and female. The color intensity was proportional to older age as well as higher pathological stage and tumor grade.
Data preprocessing
Raw microarray data were performed RMA background correction and log2 transformed then normalized by quantile normalization. Median-polish probesets were summarized by using the “Affy” R package [19]. At last, probes were annotated by the Affymetrix annotation files. Microarray quality was assessed by sample clustering according to the distance between different samples in Pearson's correlation matrices and average linkage.
Differentially expressed genes (DEGs) screening
The “limma” [20]R package was used to screen the DEGs between normal kidney and ccRCC tissues in the expressing data. The SAM (significance analysis of microarrays) with FDR (false discovery rate) < 0.05 and |log2 fold change (FC)| > 1 were applied to select genes further considered in the network construction.
Co-expression network construction
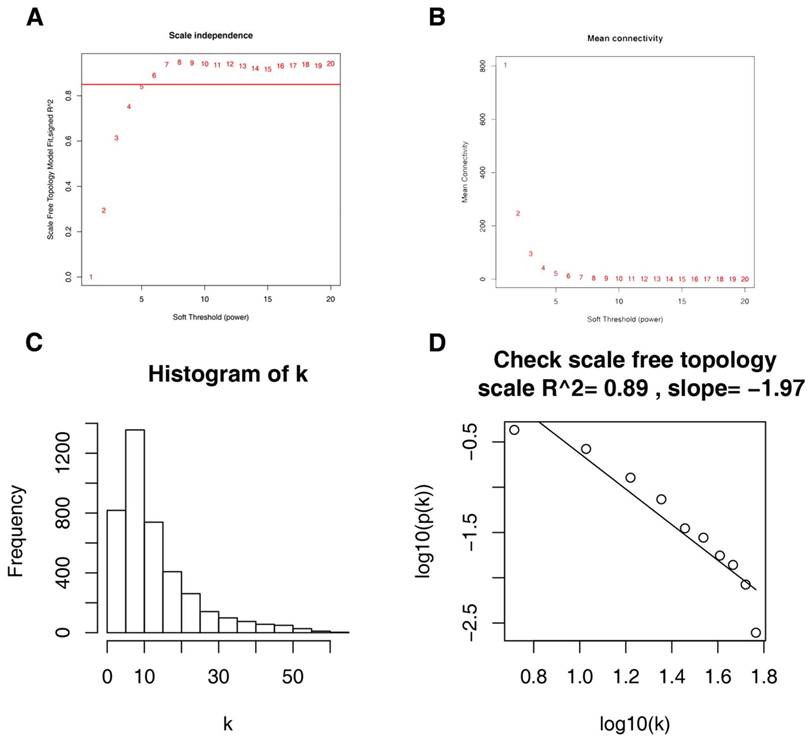
Firstly, expression data profile of DEGs was tested to check if they were the good samples and good genes. Then, we used the “WGCNA” package in R to construct co-expression network for the DEGs [21, 22]. At first, the Pearson's correlation matrices were both performed for all pair-wise genes. Then, a weighted adjacency matrix was constructed using a power function amn = |cmn|β (cmn = Pearson's correlation between gene m and gene n; amn = adjacency between gene m and gene n). β was a soft-thresholding parameter that could emphasize strong correlations between genes and penalize weak correlations. Here, the power of β = 6 (scale free R2 = 0.85) was selected to ensure a scale-free net-work (Figure 3). Next, the adjacency was transformed into topological overlap matrix (TOM), which could measure the network connectivity of a gene defined as the sum of its adjacency with all other genes for network generation [23]. To classify genes with similar expression profiles into gene modules, average linkage hierarchical clustering was conducted according to the TOM-based dissimilarity measure with a minimum size (gene group) of 30 for the genes dendrogram [24]. To further analyze the module, we calculated the dissimilarity of module eigengenes, chose a cut line for module dendrogram and merged some module.
Determination of soft-thresholding power in the weighted gene co-expression network analysis (WGCNA). (A) Analysis of the scale-free fit index for various soft-thresholding powers (β). (B) Analysis of the mean connectivity for various soft-thresholding powers. (C) Histogram of connectivity distribution when β = 6. (D) Checking the scale free topology when β = 6.
Identification of clinical significant modules and functional annotation
Two approaches were used to identify modules related with the progression of ccRCC. First, Gene significance (GS) was defined as the log10 transformation of the P value (GS = lgP) in the linear regression between gene expression and pathological stage. In addition, module significance (MS) was defined as the average GS for all the genes in a module. In general, the module with the absolute MS ranked first or second among all the selected modules was considered as the one related with clinical trait. Module eigengenes (MEs) were considered as the major component in the principal component analysis for each gene module and the expression patterns of all genes could be summarized into a single characteristic expression profile within a given module. In addition, we calculated the correlation between MEs and clinical trait to identify the relevant module. In order to explore the potential mechanism of how module genes impact correlative clinical feature, we uploaded all genes in blue module into the DAVID database and performed GO functional enrichment analysis [25, 26]. False discovery rate (FDR) < 0.01 was set as the cutoff criteria.
Identification of hub genes
Hub genes, highly interconnected with nodes in a module, have been shown to be functionally significant. In our study, we chose an interesting module, and hub genes were defined by module connectivity, measured by absolute value of the Pearson's correlation (cor.geneModuleMembership > 0.8) and clinical trait relationship, measured by absolute value of the Pearson's correlation (cor.geneTraitSignificance > 0.2) [21, 27]. Hub genes in the module were defined as highly correlated with certain clinical trait. Furthermore, protein-protein interaction (PPI) network was constructed by uploading all genes in the hub module to the STRING (Search Tool for the Retrieval of Interacting Genes) [28, 29]. A combined score of ≥ 0.8 was regard as positive interaction between genes and a connectivity degree of ≥ 15 was defined as hub genes in PPI network. The common hub genes in both co-expression network and PPI network were regarded as “real” hub genes for further analyses.
Survival analysis and efficacy evaluation
The test set of GSE53757 was analyzed and a linear regression analysis was performed to calculate the relationship between the hub genes expressions and the pathological stages of ccRCC. Besides, RNA-sequencing data sets including 539 ccRCC samples were analyzed to compare expression of FCER1G between different pathological stages of ccRCC.
For survival analysis, 539 patients were dichotomized into two groups according to FCER1G expression (high vs. low). Then we used R package “survival” to implement log-rank tests and generate Kaplan-Meier survival curve [30]. ROC curve was plotted and AUC was calculated with “ROCR” package [31]. When AUC value was greater than 0.7, the hub gene was considered capable of distinguishing localized (pathological stage I/II) and nonlocalized (pathological stage III/IV) ccRCC with excellent specificity and sensitivity. In addition, another two databases including Oncomine (http://www.oncomine.org), The Human Protein Atlas (http://www.proteinatlas.org) [32] were used to validate candidate gene expression.
Gene set enrichment analysis (GSEA)
539 ccRCC samples from RNA-sequencing data were divided into two groups (high vs. low) according to the expression level of FCER1G and median expression value was used as the cut-off point. In order to figure out potential function of FCER1G, GSEA (http://software.broadinstitute.org/gsea/index.jsp) [33] was performed between the two groups. Annotated gene sets c2.cp.kegg.v5.2.symbols.gmt was chosen as the reference gene sets. FDR < 0.05, |enrichment score (ES) | > 0.6 and gene size ≥ 100 were set as the cut-off criteria.
Results
DEGs screening
A workflow of the study was shown in Figure 1. After data preprocessing and quality assessment, the expression matrices were obtained from the 54 samples in training set GSE66272. Under the threshold of FDR< 0.05 and |log2FC| > 1, a total of 4042 DEGs (2134 up-regulated and 1908 down-regulated) were screened out and selected for subsequent analysis.
Weighted co-expression network construction and key modules identification
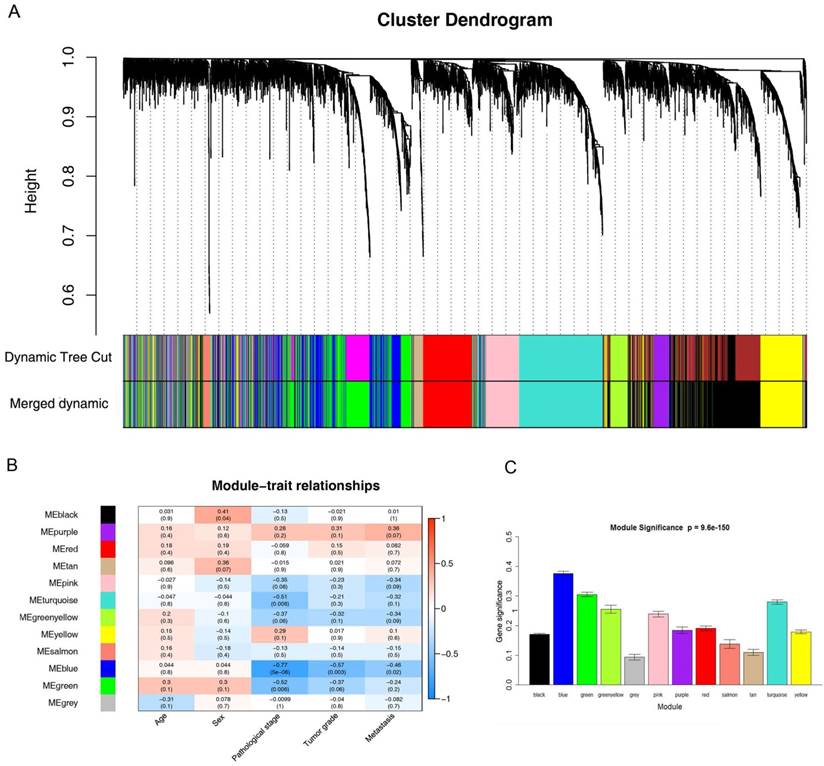
26 ccRCC samples with complete clinical data were included in co-expression analysis (Figure 2). We used “WGCNA” package in R to put the DEGs with similar expression patterns into modules by average linkage clustering. In current study, the power of β = 6 (scale free R2 = 0.85) was selected as the soft-thresholding to ensure a scale-free network (Figure 3), and a total of 12 modules were identified (Figure 4A). Identifying modules most significantly associated with clinical features had great biological significance. The highest association in the Module-feature relationship was found between blue module and pathological stage (r = -0.77, p = 5e-6; Figure 4B), which were selected as module of interest and clinical feature to be studied in subsequent analyses. The module of interest was also associated with tumor grade and metastasis.
Identification of modules associated with the clinical traits of ccRCC. (A) Dendrogram of all differentially expressed genes clustered based on a dissimilarity measure (1-TOM). (B) Heatmap of the correlation between module eigengenes and clinical traits of ccRCC. (C) Distribution of average gene significance and errors in the modules associated with pathological stage of ccRCC.
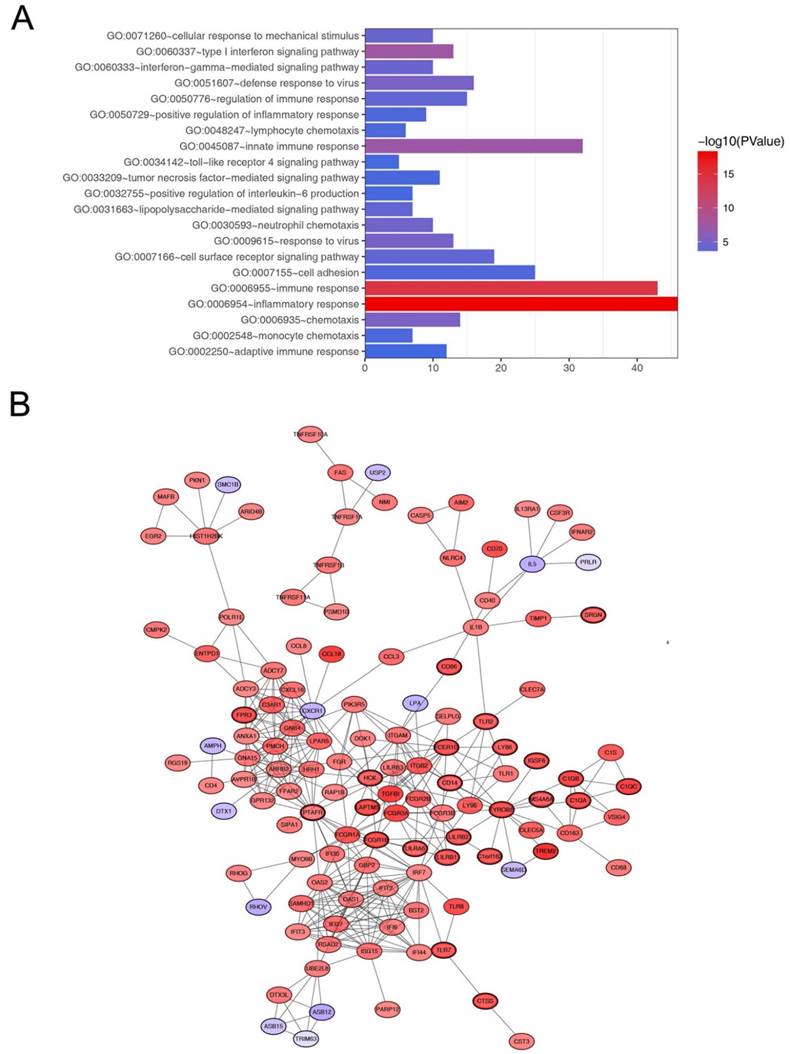
In order to explore biological relevance of blue module, 544 genes in blue module were enriched using DAVID database for Gene Ontology (GO) analyses. Biological processes of blue module were suggested to focus on inflammatory response (p = 5.293e-19), immune response (p = 5.262e-15), innate immune response (p = 6.072e-08) and chemotaxis (p = 7.844e-06, Figure 5A).
Go functional enrichment and protein-protein interaction network of genes in the blue module. (A) Go functional enrichment of genes in the blue module. The x-axis shows the number of genes and the y-axis shows the GO terms. The -log10 (P-value) of each term is colored according to the legend. (B) Protein-protein interaction network of genes in the blue module. The color intensity in each node was proportional to variation of expression in comparison to non-tumor samples (up-regulation in red and down-regulation in purple). The nodes with bold circle represented network hub genes identified by WGCNA.
Hub gene identification
Defined by module connectivity, measured by absolute value of the Pearson's correlation (cor.geneModuleMembership > 0.8) and clinical trait relationship, measured by absolute value of the Pearson's correlation (cor.geneTraitSignificance > 0.2). In this study, 38 genes with the high connectivity in blue module were taken as hub genes (Table 1). Moreover, we also constructed a network of protein-protein interaction (PPI) for all genes in blue module by Cytoscape according to the STRING database (https://string-db.org/) and genes connected with more than 15 nodes were identified as hub genes in the PPI network (Figure 5B). The three common hub genes (FCER1G, TYROBP and PTAFR) in both co-expression network and PPI network were regarded as“real” hub genes for further validation (Table 1).
Hub genes in the module related with pathological stage.
| Gene | Probe | Co-expression analysis (cor.geneModuleMembership) | Hub gene in PPI network | DEG analysis | |
|---|---|---|---|---|---|
| logFC | FDR | ||||
| FCER1G | 204232_at | 0.955 | YES | 3.29 | 3.98E-20 |
| TYROBP | 204122_at | 0.921 | YES | 3.43 | 3.98E-20 |
| PTAFR | 227184_at | 0.878 | YES | 1.52 | 2.26E-13 |
| LAPTM5 | 201720_s_at | 0.936 | NO | 3.53 | 4.40E-21 |
| LAIR1 | 208071_s_at | 0.932 | NO | 3.33 | 5.05E-21 |
| C1QC | 225353_s_at | 0.910 | NO | 4.10 | 5.05E-21 |
| CD86 | 205685_at | 0.845 | NO | 3.16 | 7.26E-21 |
| FCGR3A | 204006_s_at | 0.859 | NO | 4.07 | 4.87E-20 |
| FCGR1A | 216950_s_at | 0.898 | NO | 3.33 | 2.19E-18 |
| TNFSF13B | 223501_at | 0.839 | NO | 2.84 | 3.65E-18 |
| CTSS | 232617_at | 0.860 | NO | 3.09 | 4.66E-18 |
| CD14 | 201743_at | 0.848 | NO | 2.53 | 1.03E-17 |
| MS4A7 | 223343_at | 0.829 | NO | 3.52 | 2.05E-17 |
| FPR3 | 230422_at | 0.820 | NO | 3.35 | 3.38E-17 |
| EVI2A | 204774_at | 0.821 | NO | 2.97 | 5.35E-17 |
| TM6SF1 | 219892_at | 0.829 | NO | 3.00 | 1.47E-16 |
| C1orf162 | 228532_at | 0.824 | NO | 3.04 | 1.76E-16 |
| FCGR1B | 214511_x_at | 0.898 | NO | 3.33 | 2.19E-18 |
| HCK | 208018_s_at | 0.913 | NO | 2.49 | 1.96E-16 |
| LILRB1 | 211336_x_at | 0.848 | NO | 3.06 | 3.12E-16 |
| PLEK | 212146_at | 0.834 | NO | 2.73 | 6.28E-16 |
| TLR2 | 204924_at | 0.803 | NO | 2.78 | 7.86E-16 |
| TLR7 | 220146_at | 0.809 | NO | 3.01 | 4.03E-15 |
| LILRB2 | 207697_x_at | 0.842 | NO | 3.04 | 1.85E-14 |
| SLC15A3 | 219593_at | 0.871 | NO | 2.78 | 2.09E-14 |
| CD300LF | 1553043_a_at | 0.814 | NO | 3.90 | 4.83E-14 |
| TBXAS1 | 208130_s_at | 0.825 | NO | 1.88 | 2.21E-13 |
| LY86 | 1553428_at | 0.834 | NO | 2.70 | 1.64E-19 |
| MS4A6A | 219666_at | 0.830 | NO | 2.75 | 3.70E-19 |
| C1QA | 218232_at | 0.896 | NO | 3.66 | 4.08E-19 |
| C1QB | 202953_at | 0.899 | NO | 3.78 | 5.20E-19 |
| TREM2 | 219725_at | 0.833 | NO | 5.06 | 6.32E-19 |
| SRGN | 1554676_at | 0.843 | NO | 2.38 | 1.22E-18 |
Hub gene validation
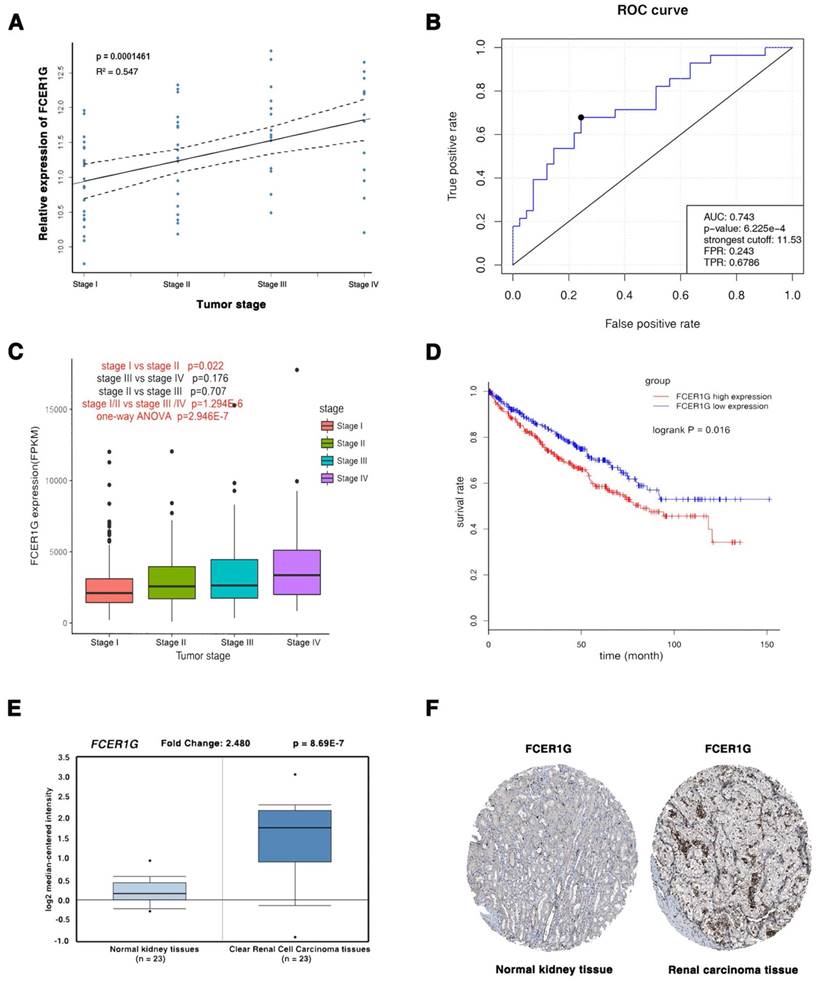
The three common hub genes (FCER1G, TYROBP and PTAFR) were selected for validation. In training set GSE66272, FCER1G had a higher correlation (r = 0.955) with the disease progression than another two genes (r = 0.921 and 0.878, Table 1). Therefore, FCER1G was chosen as the candidate gene for further validation. In the test set GSE53757, linear regression analyses were conducted to validate FCER1G, showing that FCER1G expression had a strong positive correlation with four ccRCC stages (p = 0.000146, Figure 6A). ROC curve validated that FCER1G could distinguish localized (pathological stage I, II) from non-localized (pathological stage III, IV) ccRCC (p < 0.001, AUC = 0.743). In addition, based on RNA-sequencing data, one-way ANOVA and an independent sample t test were performed and suggesting that expression of FCER1G could also effectively distinguish localized ccRCC (pathological stage I or II) from non-localized ccRCC (pathological stage III or IV) (Figure 6C). Also based on RNA-sequencing data, patients with higher expression of FCER1G showed significantly shorter overall survival time, indicating that FCER1G was also a prognosis biomarker of ccRCC (Figure 6D). Moreover, FCER1G was suggested to be correlated with clinical parameters in ccRcc (Supplementary Table 2). In addition, FCER1G mRNA and protein expression were both significantly higher in ccRCC tissue compared with normal kidney tissues (Figure 6E-F, Supplementary Figure 1B-C), which was suggested by the two testing datasets: Oncomine database and The Human Protein Atlas database.
Validation of FCER1G. (A) The correlation of FCER1G expression with the pathological stage of ccRCC (based on microarray data of GSE53757). (B) Receiver operating characteristic (ROC) curves and area under the curve (AUC) statistics to evaluate the diagnostic efficiency of the FCER1G in GSE53757 data to distinguish between localized and non-localized ccRCC. (C) Boxplots of FCER1G across different pathological stages in the TCGA data set. The boxplots show the medians and dispersions of the samples of different pathological stages for FCER1G, where the scattered black spots represent the expression level of the FCER1G. P-values are the results of independent sample T-test between pathological stage I and II, pathological stage III and IV, pathological stage II and III, pathological stage I/II and III/IV and one-way ANOVA for different pathological stages. (D) Survival analyses of FCER1G in the TCGA data set. (E) FCER1G mRNA expression was significantly higher in ccRCC tissues compared with normal kidney tissues based on Oncomine database. (F) FCER1G protein was strongly up-regulatedin renal carcinoma tissues compared with normal kidney based on The Human Protein Atlas database. The normal kidney tissue was from a male, aged 16 (patient ID: 1767; staining: low; intensity: moderate; quantity: < 25%; location: nuclear) and the kidney carcinoma tissue was from a female, aged 70 (patient ID: 1498; staining: medium; intensity: moderate; quantity: > 75%; location: nuclear).
Gene set enrichment analysis
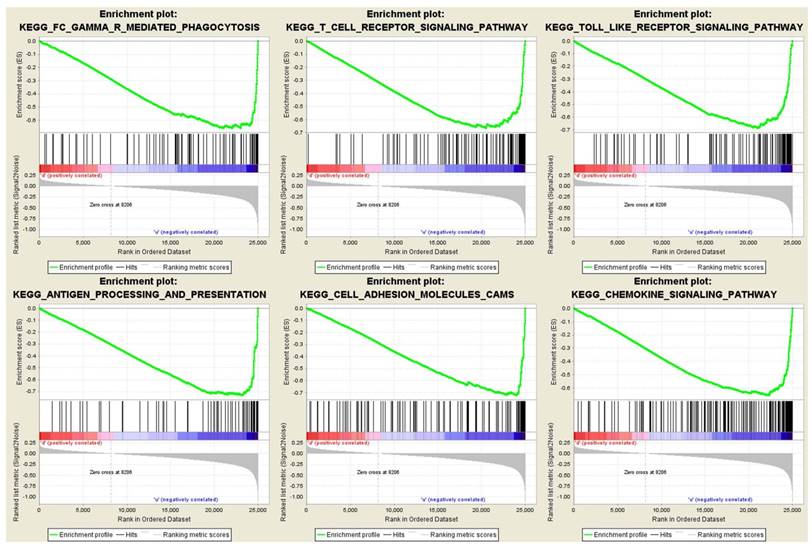
To obtain further insight into the function of the hub gene, GSEA was conducted to map into KEGG (Kyoto Encyclopedia of Genes and Genomes) pathways database. Under the cut-off criteria FDR < 0.05, |enrichment score (ES) | > 0.6 and gene size ≥ 100, a total of 12 functional gene sets were enriched, and most of the gene sets focused on immune related pathways. Six representative pathways were “Antigen processing and presentation”, “Cell adhesion molecules cams”, “Chemokine signaling pathway”, “FC gamma r mediated phagocytosis”, “T cell receptor signaling pathway” and “Toll like receptor signaling pathway” (Figure 7).
Gene set enrichment analysis (GSEA). Only listed the six representative functional gene sets enriched in clear cell renal cell carcinoma with FCER1G highly expressed.
Discussion
FCER1G, also known as FcRγ, is a key molecule involved in allergic reactions [34]. Currently only a few studies reported the function role of FCER1G. Pauline A. et al reported that FCER1G was essential for tumor development and squamous carcinogenesis by activating FCER1G that was required for establishing chronic inflammatory programs [35]. Yutaka K. et al suggested that FCER1G acted as an important role in death-activating signal then induced cell apoptosis [36].
WGCNA constructed a gene co-expression network to provide a global interpretation of gene expression information based on the similarity of the expression profiles in the sample. Many of the articles related to WGCNA had been published in well-known journals in the field of biological information and systems biology [11, 37, 38]. The WGCNA algorithm had been used to identify complex disease-related genes, biological pathways and tumor therapy targets such as familial combination of hyperlipidemia [39], Alzheimer's disease [40] and osteoporosis [41]. To the best of our knowledge, this is the first attempt to use WGCNA to identify hub gene as biomarkers capable of distinguishing localized from non-localized ccRCC.
In this study, WGCNA was performed to identify gene co-expression modules related with the progression of ccRCC. The blue module was identified, and 38 hub genes were screened from the module. Further analysis was preformed and three common hub genes (FCER1G, TYROBP and PTAFR) in both co-expression network and PPI network were regarded as “real” hub genes for further validation, indicating that the three hub genes had high connection with clinical trait as well as vital biological processes.
In the training set, TYROBP and PTAFR showed a moderate correlation with the progression of ccRCC, and only FCER1G was highly correlated with the clinical trait estimated by log rank test (p < 0.001). In the test set, FCER1G was positively correlated with the pathological malignant of renal cell carcinoma (Figure 6A). Additionally, ROC curve indicated that FCER1G exhibited excellent diagnostic efficiency for localized and non-localized ccRCC (AUC > 0.7, Figure 6B). One-way ANOVA and an independent sample t test were performed using RNA-sequencing data suggested that expression of FCER1G could effectively distinguish localized ccRCC (pathological stage I or II) from non-localized ccRCC (pathological stage III or IV). Recent studies have implied that the prognosis of nonlocalized RCC was significantly lower than that of localized RCC [42]. Therefore, genes related to pathological stage were supposed to be associated with prognosis. We then performed survival analysis to validate if FCER1G was associated with patient prognosis, revealing FCER1G expression was significantly associated with prognosis (p < 0.05).
Besides, through the Oncomine database and the two testing datasets, we could also find a significant higher expression of FCER1G in ccRCC tissues than normal kidney tissues. Immunohistochemistry staining of FCER1G protein was also significantly higher in renal carcinoma compared with normal kidney, revealed by the Human Protein Atlas database. Considering the functional role of FCER1G, it showed a simulative role in carcinogenesis mainly by correlating with immune reactions. As mentioned above, FCER1G was essential in chronic inflammatory programs and acted as an important role in death-activating signal then induced cell apoptosis. Meanwhile, in gene set enrichment analysis, we also found that the gene sets associated with immune-related pathways were enriched in the samples with FCER1G highly expressed. There was currently no relative reports concerning the association between FCER1G and carcinoma, however, it was generally conceded that chronic inflammatory was closely related to oncogenesis. Therefore, we might assume that overexpressed FCR1G regulated immune-related pathways to tumorigenesis.Some limitations of this study should be mentioned. In the present study, several risk factor such as age, gender, pathological stage, tumor grade and metastasis were included for analysis in patients with ccRCC, However, other major established risk factors for RCC contained excess body weight, hypertension and cigarette smoking [4], were not included for analysis due to limitation during data collection. Besides, a large number of clinical samples are required to validate our findings and elucidate the underlying mechanisms of how FCER1G impact on pathological stage.
In summary, our study used systems biology-based WGCNA to construct a gene co-expression network, identify and validate network hub genes associated with the progression of ccRCC. Eventually, FCER1G was identified and validated in association with the progression of ccRCC, which was also capable of distinguishing localized from non-localized ccRCC. These results are of great clinical significance and will contribute to personalized therapy.
Supplementary Material
Supplementary figures and tables.
Acknowledgements
The excellent technical assistance of Shanshan Zhang and Danni Shan is gratefully acknowledged. This study was supported in part by grants from Zhongnan Hospital of Wuhan University Science, Technology and Innovation Seed Fund (cxpy20160010) and Natural Sciences Foundation of Hubei Province (2014CFA006). The funders had no role in study design, data collection and analysis, decision to publish, or preparation of the manuscript.
Competing Interests
The authors have declared that no competing interest exists.
References
1. Siegel RL, Miller KD, Jemal A. Cancer statistics. CA Cancer J Clin. 2015;65:5-29
2. Cairns P. Renal cell carcinoma. Cancer Biomark. 2010;9:461-73
3. Motzer RJ, Jonasch E, Agarwal N, Beard C, Bhayani S, Bolger GB. et al. Kidney cancer, version 3.2015. J Natl Compr Canc Ne. 2015;13:151-9
4. Hsieh JJ, Purdue MP, Signoretti S, Swanton C, Albiges L, Schmidinger M. et al. Renal cell carcinoma. Nat Rev Dis Primers. 2017;3:17009
5. Vera-Badillo FE, Templeton AJ, Duran I, Ocana A, de Gouveia P, Aneja P. et al. Systemic therapy for non-clear cell renal cell carcinomas: a systematic review and meta-analysis. Eur Urol. 2015;67:740-9
6. Heng DY, Mackenzie MJ, Vaishampayan UN, Bjarnason GA, Knox JJ, Tan MH. et al. Primary anti-vascular endothelial growth factor (VEGF)-refractory metastatic renal cell carcinoma: clinical characteristics, risk factors, and subsequent therapy. Ann Oncol. 2012;23:1549-55
7. Dahinden C, Ingold B, Wild P, Boysen G, Luu VD, Montani M. et al. Mining tissue microarray data to uncover combinations of biomarker expression patterns that improve intermediate staging and grading of clear cell renal cell cancer. Clin Cancer Res. 2010;16:88-98
8. Gerlinger M, Horswell S, Larkin J, Rowan AJ, Salm MP, Varela I. et al. Genomic architecture and evolution of clear cell renal cell carcinomas defined by multiregion sequencing. Nat Genet. 2014;46:225-33
9. Eckl J, Buchner A, Prinz PU, Riesenberg R, Siegert SI, Kammerer R. et al. Transcript signature predicts tissue NK cell content and defines renal cell carcinoma subgroups independent of TNM staging. J Mol Med. 2012;90:55-66
10. Tavazoie S, Hughes JD, Campbell MJ, Cho RJ, Church GM. Systematic determination of genetic network architecture. Nat Genet. 1999;22:281-5
11. Langfelder P, Horvath S. WGCNA: an R package for weighted correlation network analysis. BMC Bioinformatics. 2008;9:559
12. He Z, Sun M, Ke Y, Lin R, Xiao Y, Zhou S. et al. Identifying biomarkers of papillary renal cell carcinoma associated with pathological stage by weighted gene co-expression network analysis. Oncotarget. 2017;8:27904-14
13. Chen P, Wang F, Feng J, Zhou R, Chang Y, Liu J. et al. Co-expression network analysis identified six hub genes in association with metastasis risk and prognosis in hepatocellular carcinoma. Oncotarget. 2017;8:48948-58
14. Chou WC, Cheng AL, Brotto M, Chuang CY. Visual gene-network analysis reveals the cancer gene co-expression in human endometrial cancer. BMC Genomics. 2014;15:300
15. Wang F, Chang Y, Li J, Wang H, Zhou R, Qi J. et al. Strong correlation between ASPM gene expression and HCV cirrhosis progression identified by co-expression analysis. Dig Liver Dis. 2017;49:70-6
16. Clarke C, Madden SF, Doolan P, Aherne ST, Joyce H, O'Driscoll L. et al. Correlating transcriptional networks to breast cancer survival: a large-scale coexpression analysis. Carcinogenesis. 2013;34:2300-8
17. Wotschofsky Z, Gummlich L, Liep J, Stephan C, Kilic E, Jung K. et al. Integrated microRNA and mRNA Signature Associated with the Transition from the Locally Confined to the Metastasized Clear Cell Renal Cell Carcinoma Exemplified by miR-146-5p. PLoS One. 2016;11:e0148746
18. von Roemeling CA, Radisky DC, Marlow LA, Cooper SJ, Grebe SK, Anastasiadis PZ. et al. Neuronal pentraxin 2 supports clear cell renal cell carcinoma by activating the AMPA-selective glutamate receptor-4. Cancer Res. 2014;74:4796-810
19. Gautier L, Cope L, Bolstad BM, Irizarry RA. affy-analysis of Affymetrix GeneChip data at the probe level. Bioinformatics. 2004;20:307-15
20. Ritchie ME, Phipson B, Wu D, Hu Y, Law CW, Shi W. et al. limma powers differential expression analyses for RNA-sequencing and microarray studies. Nucleic Acids Res. 2015;43:e47
21. Horvath S, Dong J. Geometric interpretation of gene coexpression network analysis. PLoS Comput Biol. 2008;4:e1000117
22. Mason MJ, Fan G, Plath K, Zhou Q, Horvath S. Signed weighted gene co-expression network analysis of transcriptional regulation in murine embryonic stem cells. BMC Genomics. 2009;10:327
23. Yip AM, Horvath S. Gene network interconnectedness and the generalized topological overlap measure. BMC Bioinformatics. 2007;8:22
24. Ravasz E, Somera AL, Mongru DA, Oltvai ZN, Barabasi AL. Hierarchical organization of modularity in metabolic networks. Science. 2002;297:1551-5
25. Huang da W, Sherman BT, Lempicki RA. Bioinformatics enrichment tools: paths toward the comprehensive functional analysis of large gene lists. Nucleic Acids Res. 2009;37:1-13
26. Huang da W, Sherman BT, Lempicki RA. Systematic and integrative analysis of large gene lists using DAVID bioinformatics resources. Nat Protoc. 2009;4:44-57
27. Presson AP, Sobel EM, Papp JC, Suarez CJ, Whistler T, Rajeevan MS. et al. Integrated weighted gene co-expression network analysis with an application to chronic fatigue syndrome. BMC Syst Biol. 2008;2:95
28. Szklarczyk D, Franceschini A, Wyder S, Forslund K, Heller D, Huerta-Cepas J. et al. STRING v10: protein-protein interaction networks, integrated over the tree of life. Nucleic Acids Res. 2015;43:D447-52
29. Franceschini A, Lin J, von Mering C, Jensen LJ. SVD-phy: improved prediction of protein functional associations through singular value decomposition of phylogenetic profiles. Bioinformatics. 2016;32:1085-7
30. Goel MK, Khanna P, Kishore J. Understanding survival analysis: Kaplan-Meier estimate. Int J Ayurveda Res. 2010;1:274-8
31. Sing T, Sander O, Beerenwinkel N, Lengauer T. ROCR: visualizing classifier performance in R. Bioinformatics. 2005;21:3940-1
32. Uhlen M, Fagerberg L, Hallstrom BM, Lindskog C, Oksvold P, Mardinoglu A. et al. Proteomics. Tissue-based map of the human proteome. Science. 2015;347:1260419
33. Subramanian A, Tamayo P, Mootha VK, Mukherjee S, Ebert BL, Gillette MA. et al. Gene set enrichment analysis: a knowledge-based approach for interpreting genome-wide expression profiles. Proc Natl Acad Sci U S A. 2005;102:15545-50
34. Tsuji M, Ezumi Y, Arai M, Takayama H. A novel association of Fc receptor gamma-chain with glycoprotein VI and their co-expression as a collagen receptor in human platelets. J Biol Chem. 1997;272:23528-31
35. Andreu P, Johansson M, Affara NI, Pucci F, Tan T, Junankar S. et al. FcRgamma activation regulates inflammation-associated squamous carcinogenesis. Cancer Cell. 2010;17:121-34
36. Kanamaru Y, Tamouza H, Pfirsch S, El-Mehdi D, Guerin-Marchand C, Pretolani M. et al. IgA Fc receptor I signals apoptosis through the FcRgamma ITAM and affects tumor growth. Blood. 2007;109:203-11
37. Luo Y, Coskun V, Liang A, Yu J, Cheng L, Ge W. et al. Single-cell transcriptome analyses reveal signals to activate dormant neural stem cells. Cell. 2015;161:1175-86
38. Kunowska N, Rotival M, Yu L, Choudhary J, Dillon N. Identification of protein complexes that bind to histone H3 combinatorial modifications using super-SILAC and weighted correlation network analysis. Nucleic Acids Res. 2015;43:1418-32
39. Plaisier CL, Horvath S, Huertas-Vazquez A, Cruz-Bautista I, Herrera MF, Tusie-Luna T. et al. A systems genetics approach implicates USF1, FADS3, and other causal candidate genes for familial combined hyperlipidemia. PLoS Genet. 2009;5:e1000642
40. Miller JA, Horvath S, Geschwind DH. Divergence of human and mouse brain transcriptome highlights Alzheimer disease pathways. Proc Natl Acad Sci U S A. 2010;107:12698-703
41. Farber CR. Identification of a gene module associated with BMD through the integration of network analysis and genome-wide association data. J Bone Miner Res. 2010;25:2359-67
42. Ma Y, Lin D, Sun W, Xiao T, Yuan J, Han N. et al. Expression of targeting protein for xklp2 associated with both malignant transformation of respiratory epithelium and progression of squamous cell lung cancer. Clin Cancer Res. 2006;12:1121-7
Author contact
![]() Corresponding authors: Dr. Yu Xiao, Email: yu.xiaoedu.cn, Tel. +86-27-6781-2689, Fax: +86-27-6781-2892; and Dr. Xinghuan Wang, Email: wangxinghuanedu.cn, Tel. +86-27-6781-3104, Fax: +86-27-6781-2892.
Corresponding authors: Dr. Yu Xiao, Email: yu.xiaoedu.cn, Tel. +86-27-6781-2689, Fax: +86-27-6781-2892; and Dr. Xinghuan Wang, Email: wangxinghuanedu.cn, Tel. +86-27-6781-3104, Fax: +86-27-6781-2892.