Impact Factor ISSN: 1449-2288

 Global reach, higher impact
Int J Biol Sci 2018; 14(14):2012-2022. doi:10.7150/ijbs.28249 This issue Cite
Research Paper
Seven Genes Based Novel Signature Predicts Clinical Outcome and Platinum Sensitivity of High Grade IIIc Serous Ovarian Carcinoma
Gang Liu1*, Lihua Chen2*, He Ren1*, Fei Liu2*, Chuanpeng Dong3, Aosen Wu1, Zhenhao Liu1, Yu Zheng1, Xi Cheng2 ![]() , Lei Liu1
, Lei Liu1 ![]()
1. Shanghai Public Health Clinical Center, Department of Medical System Biology, School of Basic Medical Sciences and Institutes of Biomedical Sciences, Fudan University, 200032, Shanghai, P.R.China.
2. Department of Gynecology Oncology, Fudan University Shanghai Cancer Centre, Fudan University, 200032, Shanghai, P.R.China.
3. Department of BioHealth Informatics, School of Informatics and Computing, Indiana University, Indianapolis, IN, US.
*These authors contributed equally to this work.
Received 2018-7-2; Accepted 2018-8-30; Published 2018-11-3
Abstract

Background: As a major subtype of ovarian cancer, high grade FIGO stage IIIc serous ovarian carcinoma (HG3cSOC), has various prognosis due to genetic heterogeneity.
Methods: The transcriptome of 401 primary FIGO IIIc serous ovarian samples was screened, seven genes based prognostic model was developed. The prognostic valueof risk score in four different cohorts (TCGA-cohort, Poland-cohort, Japan-cohort and USA-cohort) was validated. The relationship between risk score and other clinical indicators were analyzed. The guide value of risk score for platinum-taxol chemotherapy was also assayed. Tissue microenvironment difference among samples with different risk scores was investigated.
Results: High-risk group (N=200, median survival months: 39.6, 95% CI: 35.9-46.3 months) had a significantly worse prognosis than low-risk group (N=201, median survival months: 52.6, 95% CI: 45.2-64.9 months;). The risk score's performance was validated in Japan-cohort (N=90, Poland-cohort (N=48) and USA-cohort (N=84). The risk score is independent from age, primary tumor size, grade and treatment methods and the performance of risk score is uniform in subgroups. Furthermore, the risk score predicted the response of HG3cSOC to platinum-based regimen after surgery, and this finding was further validated in newly collected China-cohort (N=102). Gene Set Enrichment Analysis (GSEA) and tumor infiltration analysis revealed that risk score reflected the immune infiltration and cell-cell interaction status, and the migration function of candidate genes were also verified.
Conclusions: The optimized seven genes-based model is a valuable and robust model in predicting the survival of HG3cSOC, and served as a valuable marker for the response to platinum-based chemotherapy.
Keywords: High grade FIGO IIIc serous ovarian carcinoma, prognosis, model, transcriptome, chemotherapy, microenvironment.
Background
Ovarian cancer is one of the most lethal cancers in women, with 52,100 new case and 22,500 related deaths reported in China, 2015[1]. Among the subtypes of ovarian cancer, high grade serous carcinoma is the most prevalent, of which FIGO Stage IIIc is the majority. However, due to genetic heterogeneity and lack of personalized treatment, the prognosis of FIGO stage IIIc patients varies even after optimal cytoreductive surgery and combined platinum-based chemotherapy [2].
During the past years, prognostic biomarkers were discovered in ovarian cancer. High expression of NQO1 was reported to be up-regulated in serous ovarian carcinoma and predicts a poor prognosis[3] using immunohistochemical staining. Similarly, MMSET expression is positively associated with aggressiveness and poor clinical outcome[4]. Elevated expression of 3-Phosphoinositide-dependent protein kinase-1 (PDK1) was also shown to be correlated with improved survival[5]. In addition, miRNAs associated with ovarian serous carcinoma were also identified[6]. Another report revealed AXL to be a therapeutic target of the aggressive OSE-derived SOC[7]. However, due to the heterogeneity of serous ovarian cancer[8, 9], single molecular biomarker is usually not robust in across datasets. On the other hand, models integrating multiple genes were highlighted in the past years to evaluate prognosis in many cancer types[10-14]. “Mammaprint” was developed with 70 genes expression to predict the survival and guide the necessity of adjuvant therapy[15]. Another model, OncotypeDX, was also shown a good performance for predicting prognosis and adjuvant therapy choice in several cancers[16]. Nevertheless, multiple gene based prognostic model for high grade FIGO IIIc serous ovarian carcinoma (HG3cSOC) has not reported yet. In this work, we developed a new model to predict the clinical outcome of HG3cSOC, verified its role in prognosis and treatment choice, and investigated the potential mechanisms.
Methods
Sample enrollment
The FIGO IIIc ovarian serous carcinoma samples were obtained with approval of an independent ethical committee/institutional review board at FUSCC, Shanghai Cancer Center Ethical Committee (Shanghai, P.R. China), and written informed consents have been obtained from patients involved. Thee enrollment criteria listed as below: (i) The samples were high grade FIGO stage of IIIc primary serous ovarian carcinoma samples. (ii) The samples were diagnosed by at least two expertise pathologists. (iii) The tissues were preserved in RNA later since surgery. (iv) The proportion of tumor cells was no less than 80% in the tissue. (v) The median follow-up time is no less than 48 months. (vi) no previous adjuvant treatment or targeted drugs were used prior to surgery. (vii) All the patients started platinum-based chemotherapy in two months after surgery. The clinical characteristics of the samples were summarized in supplementary Table 1. For the publicly released datasets, the samples diagnosed as not high grade FIGO stage IIIc serous ovarian carcinoma after surgery were excluded from each dataset. Afterwards, samples without chemotherapy treatment or drug records were also excluded.
Cell proliferation and migration assay
Cell culture and siRNA transfection protocols were described in the supplementary material and methods. For migration assay, Transwell filter champers (Costar, Corning, NY) were used according to the manufacturers' instructions. 4.0 x 10⁴ cells of OVCA433 or 3.0 x 10⁴ cells of SKOV3 were added in upper chamber in serum free DMEM medium and allowed to incubate at 37℃ for 36 hours (OVCA433) or 20 hours (SKOV3). Five random high magnification fields were counted for each group, and these experiments were repeated at least 3 independent times. The siRNA sequences were shown in supplementary Table 2.
Cells in experimental and control cells (1 x 10³ cells/well) were seeded in 100 µL of growth medium in 96-well plates for cell proliferation assay. Cell proliferation was evaluated by measuring cell viability with the Cell Counting Kit 8 assay (Dojindo Laboratories, Kumamoto, Japan) according to manufacturer's instructions.
RT-PCR and Real-Time PCR
Total RNA from different cell lines were isolated using Trizol reagent (Invitrogen, CA) following manufacturer's instructions and total RNA from ovarian cancer samples were extracted using RNA/DNA Co-Extraction Kit. The purity and quantity of the total RNA were measured by a NanoDrop 2000 spectrophotometer (Thermo Fisher Scientific). When the A260/A280 ratio was between 1.9 and 2.1, the extracted RNA was determined to be pure enough and was used in subsequent experiments. First-strand cDNA was synthesized from 1μg of total RNA using RT Master Mix (Applied Takara, Japan). Real-time PCR was performed according to the SYBR Green Kit (Applied Takara, Japan) in an ABI PRISM 7900 sequence detector (Applied Biosystems, Carlsbad, CA) with β-actin as the endogenous control. The relative mRNA levels were calculated based on the Ct values relative to the β-actin expression. The primers used in this study were shown in the supplementary Table 3.
Data acquisition and preprocessing
The raw microarray data was acquired from GEO (https://www.ncbi.nlm.nih.gov/geo) and arrayexpress (http://www.ebi.ac.uk/arrayexpress/) according to the accession number provided (GSE32062 for Japan-cohort in GEO, GSE63885 for Poland-cohort in GEO, and E-MTAB-386 for USA-cohort in arrayexpress). Background correction, normalization and log 2 transformation were implemented with the manufacture provided R packages. The probes in each dataset were matched to gene names according to annotation file provided in the R packages. If a single gene matches several probes, probe with max mean intensity was retained. Gene expression data and clinical information of TCGA dataset was downloaded from UCSC Xena (http://xena.ucsc.edu/public-hubs/), and the data was transformed to log 2 RSEM values. Gene expression values were z-score transformed to eliminate the platform bias and batch effect.
Gene selection and model development
Univariate Cox regression was implemented on both TCGA and GSE32062 dataset. Genes significantly associated with survival (p<0.05) in both datasets were retained. Random forest variable hunting was carried out (parameter:100 iterations, 100 replications, 1000 trees per iteration/replication, and other default parameter[17]) to optimize the panel, and genes with the highest frequency were used for model development. Cox multivariate regression model was implemented using the selected genes. The risk score was calculated as the following formula:

Where βi indicates the coefficient and xi refers to the relative expression value of corresponding gene.
Statistical analysis
All analyses involved in this study were performed with R and R packages. Survival analysis, univariate Cox regression and multivariate regression was implemented with R package “survival”. The five-year survival nomogram using clinical information and risk score was plotted with R package “rms”. The three-year survival ROC and AUC was calculated with R package “pROC”[18]. Random forest variable hunting was carried out using R package “RandomforestSRC”[19, 20]. Gene Set Enrichment Analysis (GSEA)[21] was implemented using a java software (http://software.broadinstitute.org/gsea/index.jsp), and gene expression file and phenotype file (high/low-risk group) were prepared according to the guideline of GSEA. The parameters were set as: 1000 permutations, at least 5 genes in a single pathway, and used KEGG pathway as reference. Immune cell proportion of TCGA primary ovarian serous carcinoma samples was analyzed with TIMER[22] using provided protocol with default parameters (http://liulab.dfci.harvard.edu/).
Results
Gene selection and model development
The workflow of this article is described in Fig. S1a. Correlation analysis was implemented on TCGA dataset (N=401) and GSE32062 (N=90) to evaluate the association between gene expression and overall survival using univariate Cox regression. Genes significantly (p<0.05) associated with overall survival in both datasets were reserved for further analysis, and 11 genes retained. Random forest variable hunting was implemented to optimize gene combination and narrow down the panel. Seven genes were selected to develop the model (supplementary Table 4, Figure S1b). The model performed better than the 1000 randomized combinations (supplementary Table 5). Using overall survival information and expression profile of these genes, a multivariate Cox proportional hazards model was developed, and the risk score was calculated as the following: Risks score = (-0.1074*CD3D) + (-0.2262*RAB36) + (-0.1740*GADD45G) + (-0.1017*CXCL13) + (-0.1197*TSPAN13) + (-0.1933*CXCL9) + (-0.0706*IL2RG), where gene name refers to the pre-processed relative expression value of corresponding gene (Fig. S1c).
Prognostic value of risk score in TCGA cohort
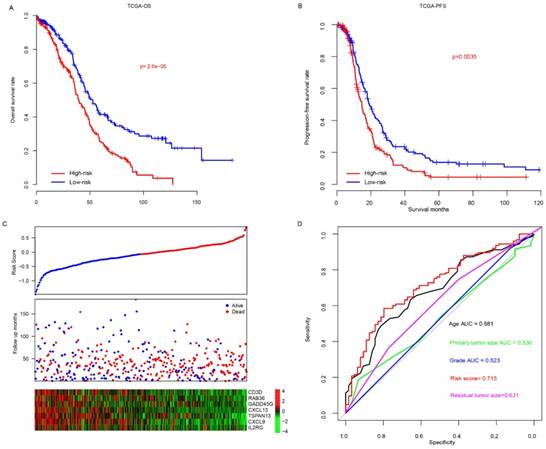
The risk scores of patients enrolled TCGA datasets were calculated using the aforementioned formula. The patients were divided into high-risk and low-risk group using median risk score value as cutoff, and overall survival difference between these groups was compared (Fig. 1a). Overall, patients in high-risk group (N=200, median survival months: 39.6, 95% CI: 35.9-46.3 months) had a significantly poor prognosis than that in low-risk group (N=201, median survival months: 52.6, 95% CI: 45.2-64.9 months; p<0.0001). In addition, progression-free survival difference between high/low-risk group was also compared (Fig. 1b), and the result indicates that progression-free survival in low-risk group (median survival months: 20.1, 95% CI: 17.8-23.8 months) is also significantly better (p<0.001) than the high-risk group (median survival months: 14.7, 95% CI: 12.5-17.2). The detailed survival information, risk score and gene expression profile were shown as Fig. 1c, and high expression of oncogene and low expression of tumor suppressor gene was observed in high-risk score samples. The three-year survival receiving operating characteristic (ROC) curve using risk score and other clinical indicators was calculated to evaluate prognostic value of the clinical information (Fig. 1d). The area under curve (AUC) of age, primary tumor size, grade, residual tumor size and risk score were 0.681, 0.530, 0.523, 0.631 and 0.715, respectively, indicating that risk score is an important indicator for survival.
The performance of risk score in TCGA dataset. The overall survival (A) and progression-free survival (B) difference between low-risk and high-risk group. Detailed survival information, risk score and gene expression pattern in TCGA dataset (C), and three-year survival ROC using risk score and other clinical indicators (D).
Prognostic value validation
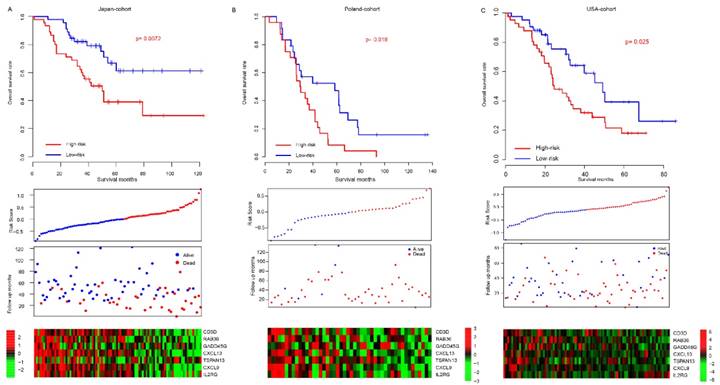
Considering the model was developed based on the seven gene expression in TCGA dataset and that the good performance of risk score may result from the over-fitness, independent datasets were employed to validate the prognostic effect of risk score. After locking the coefficients for seven genes, the risk score of each patient in each dataset was evaluated, and median risk score value was used as cutoff to discriminate the high/low-risk group. The patients in high-risk group (median survival months: 50) of the Japan-cohort (N=90) had a poorer survival than those in low-risk group (median survival month: 74) (p=0.0072, Fig, 2a). Since the candidate gene selection is partly based on Japan-cohort, over-fitness may also exist. Another two totally independent datasets, Poland-cohort (N=48) and USA-cohort (N=84) were used for further validation. As expected, survival of patients in low-risk group was significantly better than the high-risk groups (Fig. 2b-c). The progression-free survival profile resembles the overall survival pattern. In addition, the gene expression profile in the low/high-risk group in all these datasets resembles that in the training dataset (TCGA). Collectively, these results indicate that the risk score model is robust in evaluating the survival of HG3cSOC.
The performance of risk score in validate dataset. The survival difference between high-risk and low-risk group in Japan-cohort (A), Poland-cohort (B), USA-cohort (C). The detailed risk score, survival time and expression pattern was shown in the bottom panel.
Relationship between clinical indicators and risk score
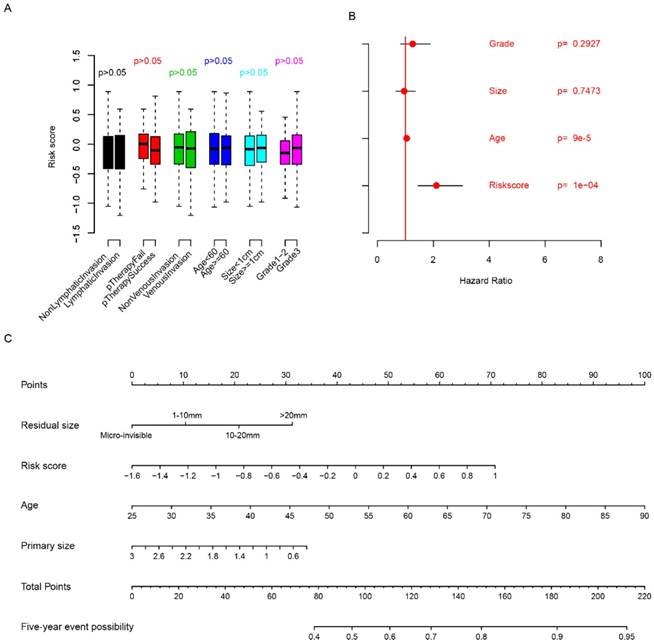
The relationship between clinicopathologic indicators and risk score was evaluated. The risk score is independent from age, grade, venous invasion, lymphatic invasion, primary treatment outcome and primary tumor size (Fig. 3a, p>0.05). Multivariate Cox regression considering risk score, primary tumor size, age and grade showed that risk score is an important clinical indicator for FIGO stage IIIc survival prediction (Fig. 3b), while grade and primary tumor size were not statistically significantly associated with survival. In order to facilitate the utilization of risk score and evaluate the importance of risk score, a nomogram using clinicopathological indicators including age, primary tumor size, residual size and risk score was plotted (Fig. 3c) to predict the five-year overall survival. According to the nomogram, risk score was an important indicator for predicting the survival of HG3cSOC. Also, correlation analysis between BRCA1/2 mutation and risk score revealed that they were independent indicators (Fig. S2). All these results above indicate that risk score is an important indicator for HG3cSOC.
Relationship between risk score and clinical indicators. The relationship between risk score and other clinical indicators were evaluated using student's t-test (A), multivariate cox regression (B), and five-year survival nomogram (C).
Prognostic value of risk score in subgroups
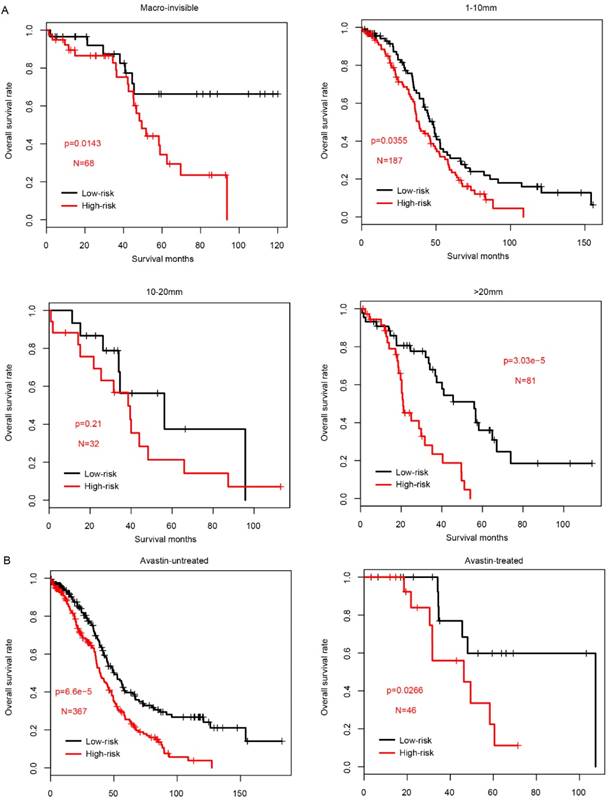
Since the clinical outcome of FIGO IIIC serous ovarian carcinoma is influenced by multiple processes, including surgery (residual tumor size) and following adjuvant therapy (drugs used in chemotherapy), the prognostic value of risk score was evaluated in each subcategory according to the treatment methods. Firstly, we divided the samples in TCGA into four subcategories according to the residual tumor size, Macro-invisible, 1-10mm, 10-20mm and >20mm. In consistent with previous results, high-risk samples had a significantly worse survival in macro-invisible, 1-10mm and >20mm subcategories (Fig. 4a), while not in 10-20mm subgroup due to the small sample size (N=32).
The performance of risk score in sub-categories divided by treatment. The survival difference between high-risk and low-risk group was significantly different in almost all subcategories, including residual tumor size (A, left to right, Macro-invisible, 1-10mm, 10-20mm and >20mm) and the tested drugs Avastin (B, left: untreated; right: treated).
Chemotherapy is the most common method for FIGO stage IIIc ovarian serous carcinoma, and the drugs includes carboplatin, paclitaxel, cisplatin and doxil, etc. Next, in order to measure the prognostic effect of risk score in predicting the patients underwent chemotherapy with these drugs, the samples were divided into pharmacy-taken group and pharmacy-depleted group according to the cacography provided in TCGA dataset. In each sub-group, samples were further divided into high-risk and low-risk group according to the median risk score value, as usual. As shown in Fig. S3, the prognostic effect of risk score is valuable in most subgroups, except for patients without carboplatin therapy (p=0.089), which may due to the limited sample size, in contrast to the other subgroups.
In addition to the classical chemotherapy drugs, as a targeted drug, Avastin (also known as bevacizumab) was widely used in in serous FIGO IIIC ovarian cancer. The risk score performance was also evaluated in the samples underwent Avastin treatment or not. As expected, both subgroups exhibited a similar pattern, and high-risk score group had a significantly worse survival (Fig. 4b). Collectively, all these results above indicate that prognostic effect of the risk score is robust and independent of drugs used in chemotherapy and targeted drugs.
Risk score predicted the platinum sensitivity of HG3cSOC
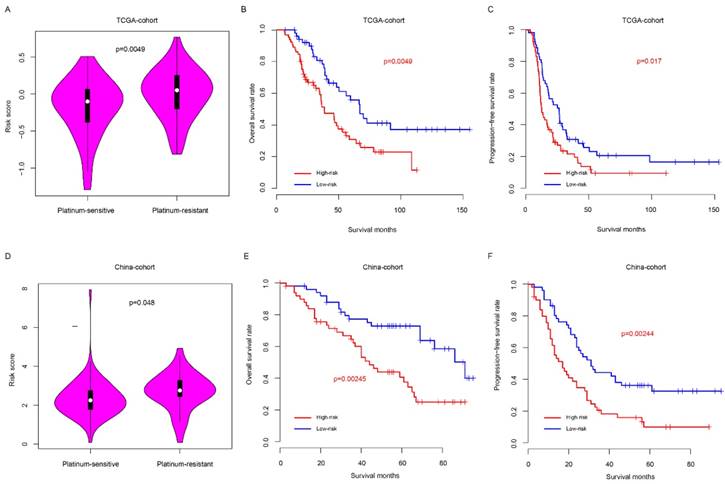
Clinically, platinum-based chemotherapy is the first-line therapy method for HG3cSOC. However, drug resistance was observed in a proportion of patients, which affect the survival. Thus, we next seek to assay whether the risk score could predict the response to taxol-platinum chemotherapy. Samples received platinum-based chemotherapy in two months after surgery was enrolled in TCGA cohort, and these samples were further divided into platinum-sensitive and platinum-resistant subgroups according to the progression-free survival time from the last therapy time of first chemotherapy round (cPFS) to the progression time period (patients with cPFS>6 month were defined as platinum-sensitive group, while patients with cPFS<6 month were defined as platinum-resistant group), the platinum-sensitive group had a significantly lower risk score value that the platinum-resistant group (Fig. 5a), and the overall and progression-free survival time of low-risk is significantly better, compared to the high-risk group (Fig. 5b-c). To validate this discovery, a new cohort (China-cohort) was collected. In consistent with previous result, the patients in the platinum-resistant group have high risk score values than these in platinum-sensitive group (Fig. 5d) In addition, the overall survival and progression-free survival of high-risk is significantly worse than the low-risk group (Fig. 5e-f). In addition, the risk score also could predict the progression-free survival of patients in both platinum-sensitive and non-sensitive group (Fig. S4a-b). Collectively, these results indicate that the risk score is a valuable indicator to predict the HG3cSOC patients' response to the platinum-based chemotherapy.
Risk score predicted the platinum-based chemotherapy response of HG3cSOC. The risk score difference between high/low risk groups in TCGA (A) group. Overall survival (B) and progression-free survival (C) of taxol-platinum treated samples in low/high-risk groups were compared. The corresponding profile was similar in China-cohort (D-F).
Risk score reflected the microenvironment and cell motility status
Gene Set Enrichment Analysis was carried out to compare the transcriptomic difference between high-risk and low-risk groups by identifying the significantly enriched signaling pathways in TCGA cohort. As expected, immune pathways were significantly enriched (Fig. 6a), including cell adhesion molecules CAM pathway (Fig. 6b), gamma mediated phagocytosis (Fig. 6c), nature killer cell mediated cytotoxicity (Fig. 6d), suggesting that the risk score also reflected the status of cell-cell adhesion and migration.
KEGG pathways associated with risk score. The significantly associated KEGG pathways were shown between low-risk and high-risk groups using GSEA. The enrichment score and log 10 transformed p values (A), and cell adhesion molecules cams (B), FC gamma mediated phagocytosis (C), natural killer cell mediated cytotoxicity (D) were noticed. Correlation analyses indicated that the risk score was significantly associated immune cell infiltration (D).
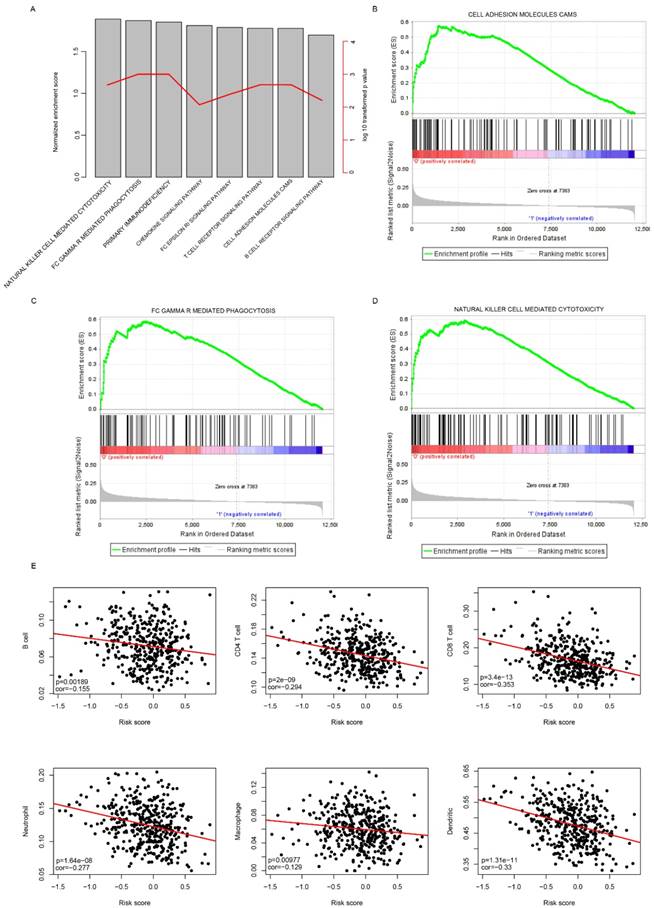
In addition, it was noticed that immune cell infiltration was significantly enriched, in combination with the fact that these seven candidate genes includes three immune cell biomarkers (CD3D, CXCL13 and IL2RG)[23, 24], we suspected the risk score may have reflected the immune cell infiltration. To further investigate the correlation between risk score and immune cell types, the proportion of immune cells (B cell, CD4+ T cell, CD8+ T cell, neutrophil, macrophage and Dendritic cells) of primary tumor samples in the TCGA cohort was analyzed using the TIMER[22], a software calculating the proportion of cell types. The correlation between risk score and immune cell infiltration was determined. As expected, the proportion of all these six cells types was significantly and negatively correlated with risk score (Fig. 6e). Taken together, these results indicate that the risk score reflected the microenvironment of serous ovarian carcinoma, especially immune cell infiltration.
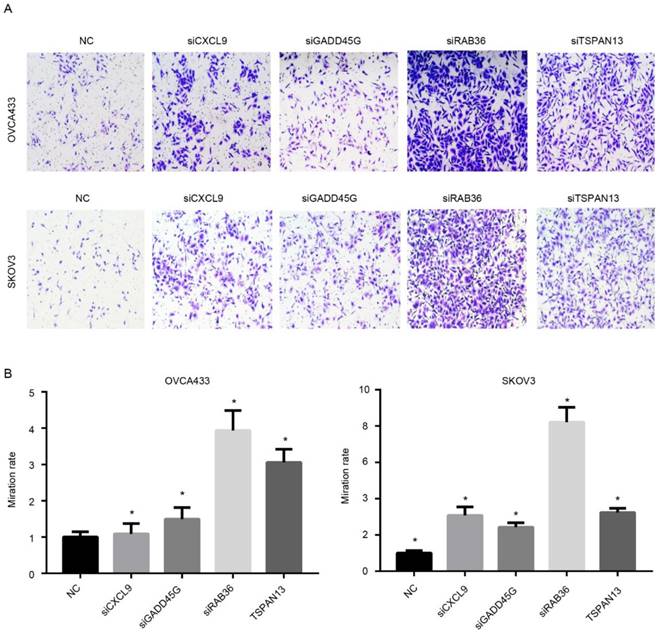
Since the risk score was calculated based on the expression of candidate genes, the effectiveness of the model relies on the function of these genes. Therefore, the functional assays of the other four genes, RAB36, GADD45G, TSPAN13 and CXCL9 were implemented. Migration nd proliferation assays were carried out following knock down of these genes using siRNAs using two cell lines (Fig. S5), OVCA433 and SKOV3, which were serous ovarian carcinoma cell lines. As expected, the migration ability of was significantly increased after knock down of any of these four genes compared to the control group (Fig.7A-B), which is consistent with our previous result that the coefficients of these four genes were all negative. However, the proliferation rate was not significantly altered following RNAi of these genes (Not shown). Collectively, these results indicate that the genes selected in the model is functional active for migration instead of proliferation, and thus predicts survival in serous ovarian carcinoma.
Functional assay of the candidate genes. After knocking down of these genes, The migration ability of serous ovarian carcinoma cells was up-regulated. A showed the image and B is the statistical data.
Discussion
The various prognoses of high grade FIGO stage IIIc serous ovarian carcinoma (HG3cSOC) are due to many factors, including tissue-of-origin, satisfactory debulking surgery [25] (for example: R0/R1/R2 surgery), adjuvant therapy method (chemotherapy or other treatment methods), and biological heterogeneity of cancer. For example, Dapeng et al., discovered that different tissue-of-origin had different impact on survival and therapeutic effect[7]. Surgery type and therapy method are controllable during therapy, while biological heterogeneity is not. The transcriptome reflected the heterogeneity of ovarian cancer[26, 27], thus it was used to develop a prognostic model. Our risk score model is significantly associated with immune signaling pathways, suggesting that the risk score reflected the immune infiltration status, and thus associated with survival of HG3cSOC across datasets, which is consistent with previous results[28-30]. In addition, the risk score effectively forecasted the clinical outcome of patients treated with platinum-based chemotherapy.
We used collected tumor tissues to verify the predictive value of the risk score and found that it can predict the prognosis and chemotherapy sensitivity of platinum drugs. Then we used GSEA enrichment analysis to look for possible signaling pathways for candidate genes to play a role, and found that candidate genes are associated with immune infiltration and cell adhesion. Therefore, we performed a cell migration assay and found that the ability to metastasize cells was significantly increased after knocking down the four candidate genes. This explained that the risk score predicting prognosis may be due to invasion and metastasis of candidate genes. Our next step is to further study the molecular mechanisms behind risk scores, as immunological invasion has not been discussed in depth.
Although single biomarker for prognosis has been widely reported, the robustness is a major concern. For example, none of the genes tested was significantly associated with survival in over three datasets involved this study. Among the genes used in the model, CD3D was reported highly associated with APOBEC3H across cancers, which correlates with T cell infiltration and predicts a good survival in high grade serous ovarian carcinoma[23], which is consistent with the GSEA results. Despite that the prognostic effect and molecular mechanism of RAB36 was still unknown, the gene is a member of RAS superfamily, which has been reported as a prognostic gene in serous ovarian carcinoma[31]. The role of GADD45G was not reported in ovarian cancer yet, while aberrant expression and methylation of GADD45G was associated with poor prognosis in various cancer types[32-34]. CXCL13 and CXCL9 was shown to predict a better survival in ovarian cancer and associated with immune evasion[35, 36], while TSPAN13 was investigated as a prognostic gene in prostate cancer[37]. Our results also indicated that knocking down of RAB36, GADD45G, TSPAN13 and CXCL9 significantly enhanced the migration ability, suggesting that these genes, especially RAB36, may be served as potential therapy targets.
Although it is noticed that similar work in this area has not been reported yet, high grade serous ovarian carcinoma classifications based on multiple omics data were reported[38, 39], survival difference between subgroups was observed. Nevertheless, the drawbacks of these studies are obvious. Multiple -omics data-based study comprehensively integrated the genetic information of samples, but the clinical utilization is still a huge challenge. Another defect of these studies is lack of validation from independent cohorts. Our study used only transcription abundance of seven genes, and the results was validated in cohorts from four different countries. More importantly, the platform for abundance estimation were RNA-seq, microarray and Q-RTPCR, indicating that it is independent from platforms.
Limits of this study exist. Firstly, it is a retrospective study, for some of the cohorts used, important clinical indicators including surgery type, time to recurrence and metastasis is not available due to the loss of patients and even if there are strict standards, information bias is likely to appear. Secondly, the cutoff in each dataset was different (using median risk score in each dataset as cutoff). But the absolute value of the risk score is approximately equal (from 0 to -0.1). Another flaw of this study is that the sample size is limited in evaluating the guide value of the risk score for platinum-based therapy (sample sizes were 119 and 102 in TCGA and China-cohort, respectively) due to the unrecorded therapy regiment in Poland and Japan-cohort. Further multi-centered validation is still needed before this model is clinically used. The third limitation of this study is that data of different cohorts generates different model. Thus, the current model is probably not the best one. Our approach is using the largest cohorts for gene selection and model development, to reduce the effect as more as possible.
Altogether, the optimized seven genes-based model is a valuable and robust model in predicting the survival of HG3cSOC, and served as a valuable marker for the response to platinum-based chemotherapy.
Abbreviations
GSEA: Gene Set Enrichment Analysis; 95% CI: 95% confidence interval; ROC: receiving operating characteristic curve; AUC: area under curve; HG3cSOC: high grade FIGO IIIc serous ovarian carcinoma.
Supplementary Material
Supplementary figures and tables.
Acknowledgements
Knowledge Database for Precision Medicine of Disease 2016YFC0901900.
Competing Interests
The authors have declared that no competing interest exists.
References
1. Chen W, Zheng R, Baade PD, Zhang S, Zeng H, Bray F. et al. Cancer statistics in China, 2015. CA: a cancer journal for clinicians. 2016;66:115-32
2. Bakkar R, Gershenson D, Fox P, Vu K, Zenali M, Silva E. Stage IIIC ovarian/peritoneal serous carcinoma: a heterogeneous group of patients with different prognoses. International journal of gynecological pathology: official journal of the International Society of Gynecological Pathologists. 2014;33:302-8
3. Cui X, Li L, Yan G, Meng K, Lin Z, Nan Y. et al. High expression of NQO1 is associated with poor prognosis in serous ovarian carcinoma. BMC cancer. 2015;15:244
4. Yang S, Zhang Y, Meng F, Liu Y, Xia B, Xiao M. et al. Overexpression of multiple myeloma SET domain (MMSET) is associated with advanced tumor aggressiveness and poor prognosis in serous ovarian carcinoma. Biomarkers: biochemical indicators of exposure, response, and susceptibility to chemicals. 2013;18:257-63
5. Lohneis P, Darb-Esfahani S, Dietel M, Braicu I, Sehouli J, Arsenic R. PDK1 is Expressed in Ovarian Serous Carcinoma and Correlates with Improved Survival in High-grade Tumors. Anticancer research. 2015;35:6329-34
6. Nam EJ, Yoon H, Kim SW, Kim H, Kim YT, Kim JH. et al. MicroRNA expression profiles in serous ovarian carcinoma. Clinical cancer research: an official journal of the American Association for Cancer Research. 2008;14:2690-5
7. Hao D, Li J, Jia S, Meng Y, Zhang C, Wang L. et al. Integrated Analysis Reveals Tubal- and Ovarian-Originated Serous Ovarian Cancer and Predicts Differential Therapeutic Responses. Clinical cancer research: an official journal of the American Association for Cancer Research. 2017;23:7400-11
8. Schwarz RF, Ng CK, Cooke SL, Newman S, Temple J, Piskorz AM. et al. Spatial and temporal heterogeneity in high-grade serous ovarian cancer: a phylogenetic analysis. PLoS medicine. 2015;12:e1001789
9. Abdallah BY, Horne SD, Kurkinen M, Stevens JB, Liu G, Ye CJ. et al. Ovarian cancer evolution through stochastic genome alterations: defining the genomic role in ovarian cancer. Systems biology in reproductive medicine. 2014;60:2-13
10. Chang W, Gao X, Han Y, Du Y, Liu Q, Wang L. et al. Gene expression profiling-derived immunohistochemistry signature with high prognostic value in colorectal carcinoma. Gut. 2014;63:1457-67
11. Bou Samra E, Klein B, Commes T, Moreaux J. Identification of a 20-gene expression-based risk score as a predictor of clinical outcome in chronic lymphocytic leukemia patients. BioMed research international. 2014;2014:423174
12. Kim SK, Kim SY, Kim JH, Roh SA, Cho DH, Kim YS. et al. A nineteen gene-based risk score classifier predicts prognosis of colorectal cancer patients. Molecular oncology. 2014;8:1653-66
13. Zhang ZL, Zhao LJ, Chai L, Zhou SH, Wang F, Wei Y. et al. Seven LncRNA-mRNA based risk score predicts the survival of head and neck squamous cell carcinoma. Scientific reports. 2017;7:309
14. Gray RG, Quirke P, Handley K, Lopatin M, Magill L, Baehner FL. et al. Validation study of a quantitative multigene reverse transcriptase-polymerase chain reaction assay for assessment of recurrence risk in patients with stage II colon cancer. Journal of clinical oncology: official journal of the American Society of Clinical Oncology. 2011;29:4611-9
15. Cardoso F, van't Veer LJ, Bogaerts J, Slaets L, Viale G, Delaloge S. et al. 70-Gene Signature as an Aid to Treatment Decisions in Early-Stage Breast Cancer. The New England journal of medicine. 2016;375:717-29
16. Toole MJ, Kidwell KM, Van Poznak C. Oncotype dx results in multiple primary breast cancers. Breast cancer: basic and clinical research. 2014;8:1-6
17. Ishwaran H, Kogalur UB, Blackstone EH, Lauer MS. Random survival forests. The Annals of Applied Statistics. 2008;2(3):841-860
18. Robin X, Turck N, Hainard A, Tiberti N, Lisacek F, Sanchez JC. et al. pROC: an open-source package for R and S+ to analyze and compare ROC curves. BMC bioinformatics. 2011;12:77
19. Ishwaran H, Kogalur UB. Consistency of Random Survival Forests. Statistics & probability letters. 2010;80:1056-64
20. Ishwaran H, Gerds TA, Kogalur UB, Moore RD, Gange SJ, Lau BM. Random survival forests for competing risks. Biostatistics (Oxford, England). 2014;15:757-73
21. Subramanian A, Tamayo P, Mootha VK, Mukherjee S, Ebert BL, Gillette MA. et al. Gene set enrichment analysis: a knowledge-based approach for interpreting genome-wide expression profiles. Proceedings of the National Academy of Sciences of the United States of America. 2005;102:15545-50
22. Li B, Severson E, Pignon JC, Zhao H, Li T, Novak J. et al. Comprehensive analyses of tumor immunity: implications for cancer immunotherapy. Genome biology. 2016;17:174
23. Leonard B, Starrett GJ, Maurer MJ, Oberg AL, Van Bockstal M, Van Dorpe J. et al. APOBEC3G Expression Correlates with T-Cell Infiltration and Improved Clinical Outcomes in High-grade Serous Ovarian Carcinoma. Clinical cancer research: an official journal of the American Association for Cancer Research. 2016;22:4746-55
24. Gu-Trantien C, Migliori E, Buisseret L, de Wind A, Brohee S, Garaud S. et al. CXCL13-producing TFH cells link immune suppression and adaptive memory in human breast cancer. JCI insight. 2017:2
25. Hofstetter G, Concin N, Braicu I, Chekerov R, Sehouli J, Cadron I. et al. The time interval from surgery to start of chemotherapy significantly impacts prognosis in patients with advanced serous ovarian carcinoma - analysis of patient data in the prospective OVCAD study. Gynecologic oncology. 2013;131:15-20
26. Zhang W, Liu Y, Sun N, Wang D, Boyd-Kirkup J, Dou X. et al. Integrating genomic, epigenomic, and transcriptomic features reveals modular signatures underlying poor prognosis in ovarian cancer. Cell reports. 2013;4:542-53
27. Hoogstraat M, de Pagter MS, Cirkel GA, van Roosmalen MJ, Harkins TT, Duran K. et al. Genomic and transcriptomic plasticity in treatment-naive ovarian cancer. Genome research. 2014;24:200-11
28. Auer K, Bachmayr-Heyda A, Sukhbaatar N, Aust S, Schmetterer KG, Meier SM. et al. Role of the immune system in the peritoneal tumor spread of high grade serous ovarian cancer. Oncotarget. 2016;7:61336-54
29. Townsend KN, Spowart JE, Huwait H, Eshragh S, West NR, Elrick MA. et al. Markers of T cell infiltration and function associate with favorable outcome in vascularized high-grade serous ovarian carcinoma. PloS one. 2013;8:e82406
30. Wouters MC, Komdeur FL, Workel HH, Klip HG, Plat A, Kooi NM. et al. Treatment Regimen, Surgical Outcome, and T-cell Differentiation Influence Prognostic Benefit of Tumor-Infiltrating Lymphocytes in High-Grade Serous Ovarian Cancer. Clinical cancer research: an official journal of the American Association for Cancer Research. 2016;22:714-24
31. Emmanuel C, Chiew YE, George J, Etemadmoghadam D, Anglesio MS, Sharma R. et al. Genomic classification of serous ovarian cancer with adjacent borderline differentiates RAS pathway and TP53-mutant tumors and identifies NRAS as an oncogenic driver. Clinical cancer research: an official journal of the American Association for Cancer Research. 2014;20:6618-30
32. Guo W, Zhu T, Dong Z, Cui L, Zhang M, Kuang G. Decreased expression and aberrant methylation of Gadd45G is associated with tumor progression and poor prognosis in esophageal squamous cell carcinoma. Clinical & experimental metastasis. 2013;30:977-92
33. Xu G, Zhang L, Ma A, Qian Y, Ding Q, Liu Y. et al. SIP1 is a downstream effector of GADD45G in senescence induction and growth inhibition of liver tumor cells. Oncotarget. 2015;6:33636-47
34. Guo W, Dong Z, Guo Y, Chen Z, Kuang G, Yang Z. Methylation-mediated repression of GADD45A and GADD45G expression in gastric cardia adenocarcinoma. International journal of cancer. 2013;133:2043-53
35. Rachidi SM, Qin T, Sun S, Zheng WJ, Li Z. Molecular profiling of multiple human cancers defines an inflammatory cancer-associated molecular pattern and uncovers KPNA2 as a uniform poor prognostic cancer marker. PloS one. 2013;8:e57911
36. Bronger H, Singer J, Windmuller C, Reuning U, Zech D, Delbridge C. et al. CXCL9 and CXCL10 predict survival and are regulated by cyclooxygenase inhibition in advanced serous ovarian cancer. British journal of cancer. 2016;115:553-63
37. Arencibia JM, Martin S, Perez-Rodriguez FJ, Bonnin A. Gene expression profiling reveals overexpression of TSPAN13 in prostate cancer. International journal of oncology. 2009;34:457-63
38. Verhaak RG, Tamayo P, Yang JY, Hubbard D, Zhang H, Creighton CJ. et al. Prognostically relevant gene signatures of high-grade serous ovarian carcinoma. The Journal of clinical investigation. 2013;123:517-25
39. Konecny GE, Wang C, Hamidi H, Winterhoff B, Kalli KR, Dering J. et al. Prognostic and therapeutic relevance of molecular subtypes in high-grade serous ovarian cancer. Journal of the National Cancer Institute. 2014:106
Author contact
![]() Corresponding author: Lei Liu, ph.D, No.131 Dong'an Rd, 200032 Shanghai, Phone/Fax: 86-021-54237007 liulei_sibscom; Xi Cheng, MD No.270, Dong'an Rd. 200032, Shanghai, Phone/Fax 86-021-64174774 cheng_xi1com
Corresponding author: Lei Liu, ph.D, No.131 Dong'an Rd, 200032 Shanghai, Phone/Fax: 86-021-54237007 liulei_sibscom; Xi Cheng, MD No.270, Dong'an Rd. 200032, Shanghai, Phone/Fax 86-021-64174774 cheng_xi1com