Impact Factor ISSN: 1449-2288
- Issue 12; 2026
- Issue 11; 2026
- Issue 10; 2026
- Issue 9; 2026
- Issue 8; 2026
- Volume 22; 2026
- Past Issues
- Advance Articles
- Editorial Board
- Cover Images
- Index & Coverage
- Cover Suggestion
- Special Issues
Introduction
Materials and Methods
Results
Discussion
Abbreviations
Supplementary Material
Acknowledgements
References

 Global reach, higher impact
Int J Biol Sci 2019; 15(1):93-104. doi:10.7150/ijbs.28642 This issue Cite
Research Paper
Crosstalk between Epigenetic Modulations in Valproic Acid Deactivated Hepatic Stellate Cells: An Integrated Protein and miRNA Profiling Study
Peng Lu1*, Min Yan1*, Li He1, Jing Li1, Yuhua Ji2 ![]() , Juling Ji1
, Juling Ji1 ![]()
1. Department of Pathology, Medical School of Nantong University, Nantong, China
2. Key Laboratory of Neuroregeneration, Nantong University, Nantong, China
*These authors contributed equally to this work.
Received 2018-7-19; Accepted 2018-10-27; Published 2019-1-6
Abstract

Reverting activated hepatic stellate cells (HSCs) to less activation or quiescent status is a promising strategy for liver fibrosis. Histone deacetylase inhibitor (HDACI) could suppress HSCs activation. Our previous study demonstrated a critical role of miRNAs in HSCs activation. Here, we explored the involvement of miRNAs in HDACI induced HSCs deactivation. Human cell line LX2 that resembled activated HSCs was treated with an HDACI - valproic acid (VPA). The effects of VPA on the protein and miRNA profile of LX2 were comprehensively analyzed by iTraq quantitative proteomics and miRNA microarray. The interaction between miRNA and proteins was investigated systematically. The biofunctions of differentially expressed proteins and miRNA targeted proteins were annotated. VPA treatment attenuated the activation phenotype of LX2. In VPA treated LX2, among 1548 quantified proteins, only 86 proteins were differentially expressed (VPA-proteins). While among 282 high-abundance miRNAs, 123 were differentially expressed (VPA-miRNAs), with 104 down-regulated and 19 up-regulated. The top biofunctions of VPA-proteins were closely related to HSCs activation, including cell death and survival, cell movement, cellular growth and proliferation. Furthermore, 22 out of the 36 VPA-proteins involved in cell death and survival, and 19 out of the 30 VPA-proteins involved in cellular movement were predicted targets of VPA-miRNAs. A direct regulatory effect of histone acetylation on miRNA expression was also established. In conclusion, our data provided the molecular mechanisms for VPA induced HSCs deactivation at the protein level and suggested crosstalk between histone acetylation and miRNAs in the inhibitory effects of HDACI on HSCs activation.
Keywords: hepatic stellate cell, histone deacetylase inhibitor, valproic acid, miRNA, proteomics
Introduction
Hepatic stellate cells (HSCs) are pericyte-like cells resident in the space of Disse, maintaining the balance of extracellular matrix (ECM), storing vitamin A, secreting cytokines and modulating the diameter of hepatic sinusoid [1, 2]. Upon liver injury, HSCs are activated and transdifferentiate into myofibroblasts, producing excessive ECM which leads to liver fibrosis and cirrhosis. It is well accepted that these cells are the main contributors to liver fibrosis [3, 4]. Removing activated HSCs or reverting activated HSC to less activation status could be a promising strategy for liver fibrosis [5].
Recent studies demonstrated that multiple epigenetic mechanisms are involved in HSCs activation, including histone acetylation [6-9]. Histone deacetylase inhibitors (HDACIs), which constrain the activity of histone deacetylase, will increase the extent of acetylation of histones and transcription factors, and regulate gene transcription[10]. In the past decades, HDACIs were proved to be able to inhibit cellular growth, promote differentiation and apoptosis of tumor cells, thus were considered as promising anti-cancer agents and had been applied in clinical medication [11-14]. Geerts A et al. found that several HDACIs, including valproic acid (VPA), could inhibit the activation of cultured HSCs and CCl4 induced mouse liver fibrosis, but the TGF-β pathway, a classical pathway for HSCs activation, was not involved [7, 15]. Despite the growing evidence for the suppression of HSCs by HDACIs, the underlying mechanism is still a pending problem.
MicroRNA (miRNA) is a family of endogenous small non-coding RNAs that functions in RNA silencing and post-transcriptional regulation and represents an essential epigenetic mechanism in control of many fundamental cellular and physiological processes [16]. Our previous study showed a critical role of miRNAs in HSCs activation which has also been confirmed by other groups [8, 9]. Considering the role of HDACI in protein-encoding gene regulation, we wondered if HDACI could also regulate miRNA expression and suppress HSCs activation through a miRNA dependent mechanism.
To explore the molecular mechanisms and the crosstalk between epigenetic modulations involved in the suppressive effect of HDACI on HSCs activation, VPA was chosen as the HDACI studied in the present study [7, 15]. Human hepatic stellate cell line LX2 was used as activated HSCs [17]. Because of the extensive role of HDACI in gene regulation, the diversity of known miRNAs and multiple target sites of a single miRNA, systems biology approach based on isobaric tags for relative and absolute quantitation (iTraq) labeling quantitative proteomics and miRNA microarray studies were performed to examine the effects of VPA on protein-encoding gene and miRNA expression comprehensively. The potential role of miRNAs in VPA induced gene regulation in HSC was further analyzed bioinformatically.
Materials and Methods
Cell culture and determination of the minimal effective concentration of VPA
Human hepatic stellate cell line LX2 was maintained in Dulbecco's modified Eagle's medium (Gibco, Carlsbad, USA) with 10% fetal bovine serum (Invitrogen Co, USA) in an atmosphere of 5% CO2 at 37°C. Cells were serially passaged at a dilution of 1:3 when the cell confluence reached 70% [17]. To determine the minimal effective concentration of VPA used in the present experiments, the cytotoxicity of VPA was assessed by Cell Counting Kit-8 (CCK8, Beyotime, Nantong, China). Details were provided in the supplementary materials and methods.
Cell proliferation and migration assay
Cell proliferation was measured by 5-ethynyl-2'-deoxyuridine (EdU) incorporation assay by EdU assay kit (RiboBio, Guangzhou, China) according to the manufacturers' instructions. For migration assay, LX2 cells treated with 2.5mM VPA for 24 hr and resuspended in serum-free DMEM were plated in the upper chambers (Millicell, 0.8 μm; Millipore, Bedford, MA), DMEM medium containing 2.5% FBS was added as a chemoattractant in the lower chambers. Details were provided in the supplementary materials and methods.
Western blotting
For western blot analysis, LX2 cells were incubated with complete DMEM with or without 2.5 mM VPA respectively for 48 hr; whole cellular proteins were extracted by RIPA lysis buffer (Beyotime) according to the manufacturer's instructions. Details were provided in the supplementary materials and methods.
Quantitative proteomic analysis
Whole cellular proteins for quantitative proteomic analyses were prepared as for the western blot analyses described above. Global protein expression profile of VPA treated or untreated LX2 cells were obtained by a high-throughput comparative proteomic analysis based on isobaric tags for iTraq labeling combined with online two-dimensional nanoscale liquid chromatography and tandem mass spectrometry (2D nano-LC-MS/MS). iTraq reagents were from Applied Biosystems (Foster City, CA). iTraq labeling and 2D nano-LC-MS/MS analysis of proteins from VPA treated or untreated LX2 cells were carried out as previously reported [2]. Proteins from VPA treated LX2 cells were labeled with 115 or 117, and proteins from untreated control were labeled with 114 or 116. For protein identification and quantification, all MS/MS spectra were searched against the International Protein Index (IPI) human sequence database (V3.83) using ProteinpilotTM3.0.1 (Applied Biosystem). Corresponding SwissProt accession for each protein was annotated by PICR (Protein Identifier Cross-Reference, http://www.ebi.ac.uk/Tools/picr/).
miRNA microarray experiments and quantitative reverse-transcription polymerase chain reaction (qRT-PCR)
LX2 cells were incubated with complete DMEM with or without 2.5 mM VPA respectively for 24 hr. Total RNAs were extracted from VPA treated or untreated LX2 cells using TRIzol reagent (Invitrogen, Carlsbad, CA) according to the manufacturer's instructions. miRNA microarray experiments using TaqMan™ Array Human MicroRNA A+B Cards Set v3.0 (Applied Biosystems, Foster City, CA) were performed according to the standard protocol, each with a biological replica. Raw Ct values of the miRNA microarray for VPA treated LX2 cells and untreated control LX2 cells were normalized to an endogenous control U6 snRNA[18].
The RNAs from VPA treated or untreated LX2 cells were reverse-transcripted with Thermoscript RT-PCR system (Invitrogen) or NCode miRNA First-Strand cDNA Synthesis kits (Invitrogen). For quantitative detection of mRNAs and mature miRNAs, the templates and specific gene primers (Table S1) were mixed with SYBR Premix ExTaq (Takara, Tokyo, Japan), and q-PCR was performed using Rotor-Gene Q thermocycler (QIAGEN, Germany). The relative expressions of mRNAs and miRNAs were calculated as 2-ΔCt values, normalized to housekeeping gene β-actin or U6snRNA respectively.
Bioinformatic analysis
Biological functions of differentially expressed proteins in VPA treated LX2 cells, as well as the potential miRNA targets among differentially expressed proteins, were explored by Ingenuity Pathways Analysis (IPA, Ingenuity Systems, Redwood City, CA; http://www.ingenuity. com).
siRNA transfection
LX2 cells were seeded into 6-well culture plates and transfected with small interfering RNAs (siRNAs) against HDAC2 and HDAC3 (siHDAC2, siHDAC3) (RiboBio) using SuperFectin II in vitro DNA transfection reagent (Pufei Biotech, Shanghai, China) according to the manufacturers' instructions. Cy3 labeled siRNA transfection control (Cy3-siTC, RiboBio) was used to optimize siRNA concentration for transfection, and non-targeting siRNA was used as negative control (siNC, RiboBio). Knockdown efficiency was determined by qRT-PCR.
Plasmid construction and Luciferase assay
The putative miR-103a-3p anchor element from 1168 to 1194 of HMGA1 mRNA was termed as miR-103a recognition element (MRE103a), and the putative miR-195-5p anchor element from 1007 to 1034 of HMGA1 mRNA 3'UTR was termed as miR-195 recognition element (MRE195). As previously reported, the synthesized HMGA1 3' UTR fragment containing three copies of MRE103a or MRE195 were annealed and ligated into the psiCHECK-2 Vector (Promega, Madison, WI, USA), resulting in single insertion as psiCHECK-2/ HMGA1MRE103a×3 or psiCHECK-2/HMGA1MRE195×3 [8]. In these vectors, the post-transcriptional regulation of renilla luciferase was potentially regulated by HMGA1MRE103a or HMGA1MRE195 fragment respectively. The activity of renilla luciferase was normalized by the internal firefly luciferase activity. The nucleotide sequences of constructed plasmids were confirmed by DNA sequencing (Invitrogen). The luciferase assays for psiCHECK-2/HMGA1MRE103a×3 reporter plasmid /miR-103 mimic and psiCHECK-2/HMGA1MRE195×3 reporter plasmid / miR-195 mimic were carried out as previously reported [8]. Details were provided in the supplementary materials and methods.
Statistical analysis
Values were expressed as means ± standard deviation (SD). Statistical analyses were carried out using Student's t-test or one-way ANOVA analysis (GraphPad Prism 5.0). When IPA was used, the statistical data were generated by the software. All P-values were two-sided, and the statistical significance was defined as P < 0.05. Unless otherwise specified, all assays were performed in triplicate.
Results
VPA treatment attenuated human HSCs activation
Human hepatic stellate cell line LX2 which resembled activated HSCs [17] were exposed to different concentrations of VPA ranging from 0 mM to 20 mM for 0 hr, 24 hr, 36 hr, 48 hr or 72 hr. According to the inhibition rate, the minimal effective concentration of 2.5 mM was selected and was used in the following experiments (Figure S1). The mRNA and protein expressions of two widely recognized markers for HSCs activation, α-SMA, and collagen I, were examined in VPA treated LX2 cells by qRT-PCR and western blots. Both mRNA transcription and protein translation of α-SMA and collagen I decreased in LX2 cells treated with 2.5mM VPA for 48 hr (Figure 1A).
VPA inhibits the proliferation and migration of LX2 cells. (A) The mRNA and protein expression of α-SMA and collagen I in LX2 cells treated by 2.5mM VPA for 24h or 48h were detected by qRT-PCR and western blot respectively, (B) The effects of VPA on LX2 cells proliferation were examined by EDU incorporation analyses. (C) Migration assay for VPA pretreated LX2 cells, ×200. *** P < 0.001, ** P< 0.01.
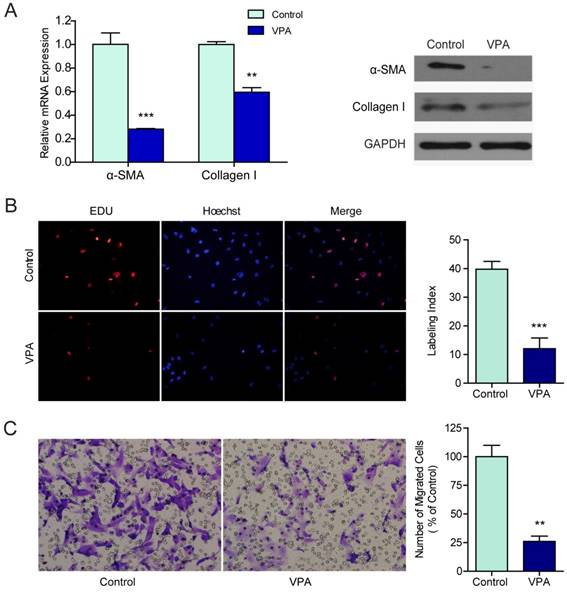
To evaluate the effects of VPA on the biological behaviors that characterizing HSC activation, the proliferation and motility of VPA treated LX2 cells were examined by EdU incorporation assay and migration assay. Compared to untreated control, the proliferation (Figure 1B) and migration (Figure 1C) of LX2 cells were both suppressed significantly when treated with 2.5 mM VPA. These findings verified that VPA could efficiently inhibit HSCs activation.
Comparative proteomic analyses revealed the molecular basis of VPA induced deactivation of human HSCs
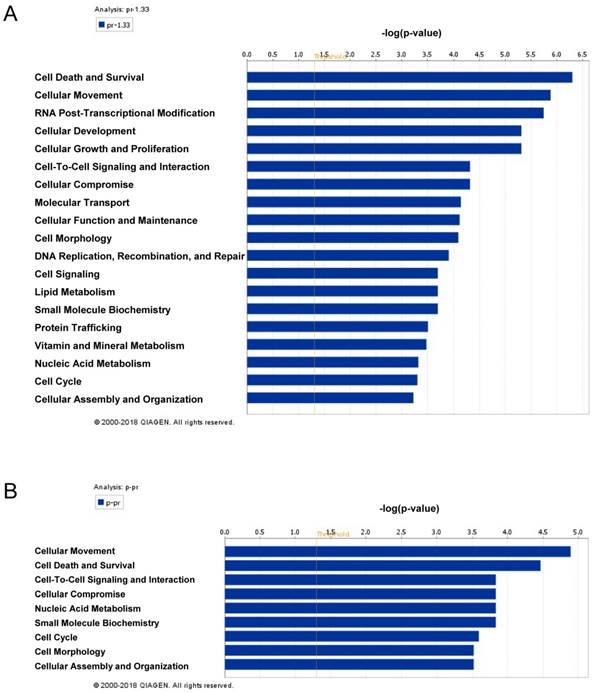
The global protein expression profiles between VPA treated and untreated LX2 cells were conducted by iTraq based proteomic analysis, each with two biological replications. In the present study, 1549 non-redundant proteins were identified with unique accession number (score ≥ 2.67, i.e., confidence ≥ 95%), among which 1548 were quantified (Table S2) (Figure S2A). To examine the biological reproducibility, linear regression analyses were performed on ln-transformed 115/114 (Sample1) and 117/116 (Sample2). The Pearson correlation coefficients between samples 1 and 2 were 0.6468 (P < 0.001) (Figure S2B). Based on the expression ratio (VPA/Control) of housekeeping proteins such as β-actin (ACTB, 115/114 = 1.010, 117/116 = 1.053) , tubulin β chain (TUBB, 115/114 = 1.008, 117/116 = 0.839 ) and glyceraldehyde-3-phosphate dehydrogenase (GAPDH, 115/114 = 0.894, 117/116 = 1.107) , a differential protein expression ratio of 1.333 was selected as significant threshold in the present study. Thus 86 (5.56%) proteins were differentially expressed and were named as VPA-proteins. Of these 86 VPA-proteins, 54 (62.79%) were up-regulated and 31(36.09%) were down-regulated (Table S2). A heat map including these up- or down-regulated proteins were shown in Figure 2A. Ingenuity Pathways Analysis (IPA) combined with literature search was used to analyze the biological function of these VPA- proteins. The top biological functions of VPA-proteins consisted of cell death and survival, cell movement, RNA post-transcriptional modification, cellular development, cellular growth and proliferation (Figure 3A, Table S3). The biological functions of these differentially expressed proteins were coherent with the inhibitory effects of VPA on the proliferation and migration of HSCs. The proteins involved were listed in Table S3.
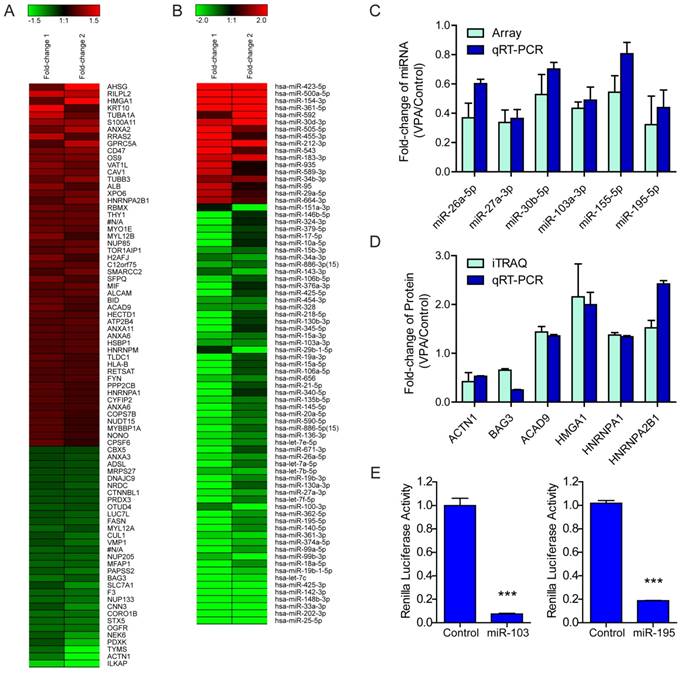
Regulation of VPA on LX2 miRNA and protein expression (A) Heatmap representation of the deregulated proteins in 2.5mM VPA treated versus untreated LX2 cells. Only differentially expressed proteins pass Avg VPA/Control filtering (V/C ≥ 1.333) were included. Red: up-regulated; Green: down-regulated. (B) Heatmap representation of the deregulated miRNAs in 2.5mM VPA treated versus untreated LX2 cells. Only differentially expressed miRNAs passing fold change filtering (fold change ≥ 2.0) were included. (C) Comparison of expression levels of 6 miRNAs in VPA treated LX2 cells by microarray and qRT-PCR assay. The correlation coefficient r = 0.8772, P value (two-tail) = 0.0217. (D) Comparison of expression levels of 6 proteins and encoding genes in VPA treated LX2 cells by iTraq and qRT-PCR assay respectively. The correlation coefficient r = 0.8469, P value (two-tail) = 0.0334. (E) Relative renilla luciferase activity of psiCHECK-2/HMGA1MRE103a×3 or psiCHECK-2/HMGA1MRE195×3 in the presence of miR-103a mimic or miR-195 mimic in 293T cells, the 293T cells co-transfected with miR-neg served as control, normalized to firefly luciferase activity. *** P < 0.001.
The biofunctional analyses of differentially expressed proteins (A) and paired miRNA targets in differentially expressed proteins (B) in VPA treated LX2 cells. The column chart represents the main biofunctions of differentially expressed miRNAs, proteins or paired miRNA targets in differentially expressed proteins respectively. The data were analyzed by IPA; statistical data were generated by the software using Fisher's exact T-test, the x-axis represents a negative logarithm of the P value.
The impacts of VPA on miRNA expression in human HSCs
The miRNA expression profiles of VPA treated or untreated LX2 cells were obtained by miRNA microarray experiments with biological repeats. The miRNA expression data have been deposited in a publicly accessible database (ArrayExpress, http://www.ebi.ac.uk/arrayexpress/, accession number E-MTAB-6752).
Raw Ct values for 754 miRNAs were filtered to discard low-abundance miRNAs by requiring the Ct value of miRNA from either group ≤ 35 (233 and 269 miRNAs from each sample passing filter, totally 282 miRNAs) (Figure S2C). Linear regression and Pearson correlation coefficients analyses were performed to examine the biological reproducibility (Figure S2D). The Pearson correlation coefficients between samples 1 and 2 were 0.3111 (P < 0.001), indicating acceptable biological reproducibility of miRNAs expression in VPA treated LX2 cells.
To identify miRNAs that were either up- or down-regulated in VPA treated HSCs, the expression of miRNAs was normalized to U6 snRNA[18], an endogenous control that stably expressed in VPA treated or untreated HSCs. The fold-change of miRNAs identified in two independent miRNA microarray analyses were averaged. The threshold values that set for significant up- and down-regulated miRNAs in the present study were ≥ 1.5 or ≤ 0.6667 (≥ 1.5-fold). Out of the 282 high-abundance miRNAs, 123 (43.62%) miRNAs were differentially expressed and were named as VPA-miRNAs. Among these 123 VPA-miRNAs, 104 (84.55%) miRNAs were down-regulated, while only 19 (15.45%) miRNAs were up-regulated (Table S4). In the context, a heat map including 17 and 59 miRNAs that up- or down-regulated for more than 2.0 folds as shown in Figure 2B.
miRNAs were involved in the gene regulation by VPA in human HSCs
We were interested to know whether and to what extent that VPA regulates protein-encoding gene expression via miRNA. The potential miRNA targets among differentially expressed proteins were explored by miRNA-target pairing analyses using IPA software, based on the predicted or experimentally observed miRNA targets and reverse changes. Among the 86 VPA-proteins, 82 proteins were annotated, of them, 47 protein-encoding genes (57.32%) were predicted targets of 62 differentially expressed VPA-miRNAs (50.41%) (Table 1). Of these 47 proteins, 38 (80.85%) were up-regulated, while only 9 (19.15%) were down-regulated. The above findings showed that in VPA treated LX2 cells, the majority of differentially expressed miRNAs decreased, while more differentially expressed proteins were increased. The global changes of miRNA and protein were coordinated, with down-regulation of miRNAs resulted in increased expression of their target genes at the protein level.
List of the potential miRNA targets among differentially expressed proteins in VPA treated LX2 cells.
| Symbol | Entrez Gene Name | Location | Type(s) | Fold- Change | Number of miRNAs | Targeted by miRNAs |
|---|---|---|---|---|---|---|
| AHSG | alpha 2-HS glycoprotein | Extracellular Space | other | 2.4862 | 3 | hsa-miR-100-3p, hsa-miR-27a-3p, hsa-miR-335-5p |
| ALB | albumin | Extracellular Space | transporter | 1.5721 | 2 | hsa-miR-100-3p, hsa-miR-143-3p |
| ALCAM | activated leukocyte cell adhesion molecule | Plasma Membrane | other | 1.4458 | 7 | hsa-miR-148b-3p, hsa-miR-18a-5p, hsa-miR-27a-3p, hsa-miR-34a-5p, hsa-miR-376c, hsa-miR-192-5p, hsa-miR-532-3p |
| ANXA11 | annexin A11 | Nucleus | other | 1.4247 | 3 | hsa-miR-99b-3p, hsa-miR-195-5p, hsa-miR-7-5p |
| ANXA2 | annexin A2 | Plasma Membrane | other | 1.8081 | 3 | hsa-miR-425-5p, hsa-miR-29a-3p, hsa-miR-1275 |
| ANXA6 | annexin A6 | Plasma Membrane | ion channel | 1.4183 | 1 | hsa-miR-324-3p |
| ATP2B4 | ATPase plasma membrane Ca2+ transporting 4 | Plasma Membrane | transporter | 1.4283 | 6 | hsa-miR-148b-3p, hsa-let-7c, hsa-miR-99b-3p, hsa-miR-99a-5p, hsa-miR-135b-5p, hsa-miR-29a-3p |
| BAG3 | BCL2 associated athanogene 3 | Cytoplasm | other | 0.6526 | 1 | hsa-miR-29a-5p |
| BID | BH3 interacting domain death agonist | Cytoplasm | other | 1.4442 | 1 | hsa-miR-26a-5p |
| C12orf75 | chromosome 12 open reading frame 75 | Other | other | 1.4737 | 4 | hsa-miR-130a-3p, hsa-miR-136-3p, hsa-miR-656, hsa-miR-1275 |
| CD47 | CD47 molecule | Plasma Membrane | transmembrane receptor | 1.6693 | 6 | hsa-miR-15a-3p, hsa-miR-376a-3p, hsa-miR-15b-3p, hsa-miR-34a-5p, hsa-miR-155-5p, hsa-miR-376c |
| COPS7B | COP9 signalosome subunit 7B | Cytoplasm | other | 1.3612 | 3 | hsa-miR-195-5p, hsa-miR-34a-5p, hsa-miR-27a-5p |
| CUL1 | cullin 1 | Nucleus | enzyme | 0.6838 | 1 | hsa-miR-500a-5p |
| GPRC5A | G protein-coupled receptor class C group 5 member A | Plasma Membrane | G-protein coupled receptor | 1.7744 | 4 | hsa-miR-148b-3p, hsa-miR-143-3p, hsa-miR-31-5p, hsa-miR-532-3p |
| HECTD1 | HECT domain E3 ubiquitin protein ligase 1 | Other | enzyme | 1.4358 | 4 | hsa-miR-142-3p, hsa-miR-195-5p, hsa-miR-130a-3p, hsa-miR-532-3p |
| HLA-B | major histocompatibility complex, class I, B | Plasma Membrane | transmembrane receptor | 1.3912 | 2 | hsa-miR-148b-3p, hsa-miR-222-5p |
| HMGA1 | high mobility group AT-hook 1 | Nucleus | transcription regulator | 2.1562 | 8 | hsa-miR-25-5p, hsa-miR-142-3p, hsa-let-7c, hsa-miR-195-5p, hsa-miR-26a-5p, hsa-miR-103a-3p, hsa-miR-1275, hsa-miR-197-3p |
| HNRNPA1 | heterogeneous nuclear ribonucleoprotein A1 | Nucleus | enzyme | 1.3736 | 10 | hsa-miR-195-5p, hsa-miR-27a-3p, hsa-miR-135b-5p, hsa-miR-218-5p, hsa-miR-34a-5p, hsa-miR-30b-5p, hsa-miR-411-5p, hsa-miR-616-3p, hsa-miR-149-5p, hsa-miR-532-3p |
| HNRNPA2B1 | heterogeneous nuclear ribonucleoprotein A2/B1 | Nucleus | other | 1.5216 | 5 | hsa-miR-103a-3p, hsa-miR-186-5p, hsa-miR-195-5p, hsa-miR-30b-5p, hsa-miR-335-5p |
| HNRNPM | heterogeneous nuclear ribonucleoprotein M | Nucleus | other | 1.4076 | 1 | hsa-miR-30b-5p |
| HSBP1 | heat shock factor binding protein 1 | Nucleus | other | 1.4140 | 2 | hsa-miR-374a-5p, hsa-miR-145-5p |
| KRT10 | keratin 10 | Cytoplasm | other | 2.0699 | 1 | hsa-miR-142-3p |
| LUC7L | LUC7 like | Nucleus | other | 0.6989 | 1 | hsa-miR-361-5p |
| MFAP1 | microfibril associated protein 1 | Extracellular Space | other | 0.6611 | 1 | hsa-miR-589-3p |
| MYL12A | myosin light chain 12A | Cytoplasm | other | 0.6875 | 1 | hsa-miR-154-3p |
| MYL12B | myosin light chain 12B | Cytoplasm | other | 1.4995 | 3 | hsa-miR-27a-5p, hsa-miR-1275, hsa-miR-7-5p |
| MYO1E | myosin IE | Cytoplasm | enzyme | 1.5002 | 2 | hsa-miR-324-3p, hsa-miR-155-5p |
| NUDT15 | nudix hydrolase 15 | Cytoplasm | phosphatase | 1.3561 | 5 | hsa-miR-25-5p, hsa-miR-425-3p, hsa-let-7c, hsa-miR-192-5p, hsa-miR-1275 |
| NUP133 | nucleoporin 133 | Nucleus | transporter | 0.6376 | 1 | hsa-miR-935 |
| NUP85 | nucleoporin 85 | Cytoplasm | other | 1.4921 | 1 | hsa-miR-218-5p |
| OS9 | OS9, endoplasmic reticulum lectin | Nucleus | other | 1.6336 | 3 | hsa-miR-145-5p, hsa-miR-103a-3p, hsa-miR-328 |
| PPP2CB | protein phosphatase 2 catalytic subunit beta | Cytoplasm | phosphatase | 1.3771 | 6 | hsa-miR-218-5p, hsa-miR-425-5p, hsa-miR-143-3p, hsa-miR-151a-3p, hsa-miR-376c, hsa-miR-192-5p |
| PRDX3 | peroxiredoxin 3 | Cytoplasm | enzyme | 0.7113 | 1 | hsa-miR-543 |
| RETSAT | retinol saturase | Cytoplasm | enzyme | 1.3905 | 1 | hsa-miR-370 |
| RILPL2 | Rab interacting lysosomal protein like 2 | Cytoplasm | other | 2.2425 | 1 | hsa-miR-197-3p |
| RRAS2 | RAS related 2 | Plasma Membrane | enzyme | 1.7745 | 1 | hsa-miR-143-3p |
| S100A11 | S100 calcium binding protein A11 | Cytoplasm | other | 1.8678 | 1 | hsa-miR-143-3p |
| SLC7A1 | solute carrier family 7 member 1 | Plasma Membrane | transporter | 0.6433 | 1 | hsa-miR-592 |
| SMARCC2 | SWI/SNF related, matrix associated, actin dependent regulator of chromatin subfamily c member 2 | Nucleus | transcription regulator | 1.4708 | 5 | hsa-miR-18a-5p, hsa-miR-99b-3p, hsa-miR-140-5p, hsa-miR-199a-3p, hsa-miR-1275 |
| THY1 | Thy-1 cell surface antigen | Plasma Membrane | other | 1.5111 | 3 | hsa-miR-143-3p, hsa-miR-193a-5p, hsa-miR-1275 |
| TLDC1 | TBC/LysM-associated domain containing 1 | Cytoplasm | other | 1.3989 | 2 | hsa-miR-202-3p, hsa-miR-135b-5p |
| TOR1AIP1 | torsin 1A interacting protein 1 | Nucleus | other | 1.4865 | 2 | hsa-miR-29b-1-5p, hsa-miR-192-5p |
| TUBA1A | tubulin alpha 1a | Cytoplasm | other | 1.8922 | 3 | hsa-miR-195-5p, hsa-miR-221-3p, hsa-miR-193a-5p |
| TUBB3 | tubulin beta 3 class III | Cytoplasm | other | 1.6204 | 1 | hsa-miR-15a-3p |
| TYMS | thymidylate synthetase | Nucleus | enzyme | 0.4859 | 1 | hsa-miR-935 |
| VAT1L | vesicle amine transport 1 like | Other | enzyme | 1.6315 | 5 | hsa-miR-18a-5p, hsa-miR-27a-3p, hsa-miR-671-3p, hsa-miR-30b-5p, hsa-miR-31-5p |
| XPO6 | exportin 6 | Cytoplasm | transporter | 1.5541 | 1 | hsa-miR-324-3p |
By bioinformatic analyses, we found that VPA-miRNAs targeted proteins were mostly involved in cellular movement as well as cell death and survival (Figure 3B Table S5). These biological functions were consistent with the inhibitory effect of VPA on HSCs activation. Furthermore, among the 36 VPA-proteins involved in cell death and survival, 22 proteins (61.11%) were predicted targets of VPA-miRNAs, of the 30 proteins involved in cellular movement, 19 proteins (63.33%) were predicted targets of VPA-miRNAs (Table S3, Table S5).
The functional importance of potential VPA-miRNA targets in VPA induced deactivation of HSCs
To further explore the functional importance, we searched the potential VPA-miRNA targets in our previous proteomics data from quiescent and activated primary rat HSCs [2]. Twenty-four out of the 46 potential VPA-miRNA targets among VPA-proteins have been detected in primary HSCs. Of this 24 proteins, 14 proteins showed opposite trend of expression in VPA treated HSCs compared to activated HSCs (Table 2). VPA treatment decreased the expression of 5 proteins (BAG3, LUC7L, MFAP1, NUP133, PRDX3) that increased in activated HSCs, and increased the expression of 9 proteins (ALB, ALCAM, ANXA11, BID, HMGA1, HNRNPA2B1, KRT10, RAP2B, SMARCC2) that decreased in activated HSCs, as listed in Table 2.
The expression of potential miRNA targets among VPA-proteins in primary culture activated HSCs.
| Symbol | A/Q sample1 | A/Q sample2 | A/Q sample3 | Avg Fold-Change (A/Q) | VPA/Control sample1 | VPA/Control sample2 | Avg Fold-Change (VPA/Control) |
|---|---|---|---|---|---|---|---|
| ALB* | 0.3467 | 0.3565 | 0.2355 | 0.3129 | 1.7670 | 1.3773 | 1.5721 |
| ALCAM* | 0.9550 | 0.6252 | 0.5649 | 0.7150 | 1.4134 | 1.4783 | 1.4458 |
| ANXA11* | 0.2938 | 0.3436 | 0.3664 | 0.3346 | 1.4344 | 1.4150 | 1.4247 |
| ANXA2 | 3.2211 | 4.8306 | 2.9376 | 3.6631 | 1.5408 | 2.0755 | 1.8081 |
| ANXA6 | 2.6546 | 1.5849 | 1.2246 | 1.8214 | 1.4260 | 1.4105 | 1.4183 |
| BAG3* | 29.6483 | 25.5859 | 19.9526 | 25.0623 | 0.6223 | 0.6830 | 0.6526 |
| BID* | 0.7727 | 0.7112 | 0.7047 | 0.7295 | 1.5109 | 1.3775 | 1.4442 |
| HMGA1* | 0.4656 | 0.3565 | 0.3048 | 0.3756 | 1.4812 | 2.8312 | 2.1562 |
| HNRNPA1 | 3.1333 | 0.9817 | 0.9638 | 1.6930 | 1.4239 | 1.3234 | 1.3736 |
| HNRNPA2B1* | 0.4446 | 0.4786 | 0.3802 | 0.4345 | 1.3695 | 1.6737 | 1.5216 |
| HSBP1 | 0.9908 | 2.8054 | 3.1046 | 2.3003 | 1.4016 | 1.4265 | 1.4140 |
| KRT10* | 0.6730 | 0.4055 | 0.6026 | 0.5603 | 2.7639 | 1.3759 | 2.0699 |
| LUC7L* | 1.1588 | 1.1588 | 0.7219 | 0.6758 | 0.6989 | ||
| MFAP1* | 1.2706 | 1.0765 | 1.0765 | 1.1412 | 0.6562 | 0.6659 | 0.6611 |
| NUP133* | 1.1272 | 1.1272 | 0.6554 | 0.6198 | 0.6376 | ||
| OS9 | 1.1482 | 1.1482 | 1.6046 | 1.6625 | 1.6336 | ||
| PPP2CB | 1.3062 | 1.3428 | 1.3305 | 1.3265 | 1.4420 | 1.3123 | 1.3771 |
| PRDX3* | 2.3121 | 2.5351 | 1.4723 | 2.1065 | 0.7178 | 0.7048 | 0.7113 |
| RRAS2* | 0.9638 | 0.6918 | 0.8278 | 2.1579 | 1.3911 | 1.7745 | |
| S100A11 | 20.8930 | 18.8799 | 1.5276 | 13.7668 | 1.8765 | 1.8591 | 1.8678 |
| SMARCC2* | 0.6730 | 0.6918 | 0.6546 | 0.6731 | 1.3328 | 1.6087 | 1.4708 |
| THY1 | 20.3236 | 11.1686 | 10.2802 | 13.9241 | 1.4926 | 1.5295 | 1.5111 |
| TOR1AIP1 | 1.0280 | 0.9727 | 1.0000 | 1.0003 | 1.4073 | 1.5658 | 1.4865 |
| TUBB3 | 19.2309 | 19.2309 | 1.4740 | 1.7668 | 1.6204 |
This table contains 24 out of the 46 potential miRNA targets among differentially expressed proteins in VPA treated LX2 cells that have been detected in primary HSCs. A/Q, fold-change of protein expression in primary culture activated rat HSCs (A) compared to quiescent rat HSCs (Q), with 3 biological repeats; VPA/Control, fold-change of protein expression in VPA treated LX2 cells (VPA) compared to untreated LX2 cells (Control), with 2 biological repeats.The protein expression data for primary culture activated HSCs were from a previous proteomics study [2].* Proteins showed opposite trend of expression in VPA treated HSCs compared to activated HSCs.
Several of these proteins have been proved to be functionally important to HSCs activation and/or liver fibrosis, including BAG3 (BCL2 associated athanogene 3) and HMGA1 (high mobility group AT-hook 1). Compared to quiescent HSCs, the expression of BAG3 increased for more than 25-fold and were among the top 20 up-regulated proteins in activated HSCs [2], while the expression of BAG3 reduced by 0.6526-fold in VPA treated HSCs. Knockdown of BAG3 by siRNA significantly inhibited the adhesion and migration of activated HSCs, and suppressed the proliferation as well [2]. Another relevant protein was HMGA1, a senescence marker [19], which decreased by 0.3756-fold in activated HSCs, but remarkably increased in VPA treated HSCs by 2.1562-fold, and was the fourth highest up-regulated protein in VPA treated HSCs. HMGA1 was also recognized as a senescence marker for activated HSCs [20]. Increased expression of HMGA1 represented enhanced senescence of activated stellate cells. Senescent activated stellate cells exhibited gene expression profile consistent with cell-cycle exit, reduced secretion of extracellular matrix components, enhanced secretion of extracellular matrix-degrading enzymes [21]. Therefore, increased senescence of activated stellate cells helped to limit the fibrogenic response to liver injury [21,21].The bio-function of other VPA-proteins involved merited further investigation.
Validation of miRNA and protein profiling data, and the interaction between VPA-miRNAs and VPA-proteins
The differential expression of miRNAs and protein-encoding genes were validated by qRT-PCR. Based on the relative abundance and the miRNA-protein pairing analyses, 6 miRNAs and 6 protein-encoding genes were selected (Figure 2C, 2D). Among them, HMGA1 is the target of miR-103a-3p, miR-195-5p and miR-26a-5p; HNRNPA1 is the target of miR-27a-3p, miR-30b-5p and miR-195-5p, HNRNPA2B1 is the target of miR-103a-3p, miR-30b-5p and miR-195-5p.
According to the miRNA-protein pairing analyses, and based on the abundance and fold-change, two down-regulated miRNAs (miR-103a-3p and miR-195-5p) and their predicted common target (HMGA1) were selected for further validation of the regulatory role of VPA-miRNAs on target genes. The 3'UTR of human HMGA1 mRNA containing MRE103a or MRE195 was subcloned after the renilla luciferase coding sequence, and co-transfected with miR-103a-3p or miR-195-5p mimic into human embryonic kidney 293T cells which are widely used in cell biology research for many years because of their stable growth and propensity for transfection[8]. Both miR-103a-3p and miR-195-5p mimic significantly inhibited the renilla luciferase activity via the 3'UTR of HMGA1 mRNA. Renilla luciferase activity decreased by 92.56% (*** P <0.001) and 81.47% (*** P<0.001) in cells co-transfected with miR-103a or miR-195 mimic and corresponding HMGA1 3'UTR reporter vector (Figure 2E).
Direct histone acetylation regulated miRNA expression
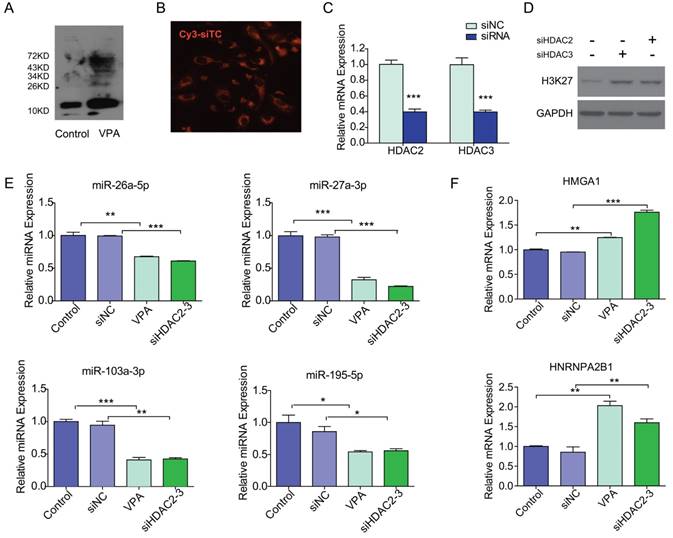
As shown in Figure 4A, VPA efficiently reduced the deacetylation activity which resulted in increasing histone acetylation in VPA treated LX2 cells. We then tested if VPA-miRNAs could be regulated by direct histone acetylation. In the present study, HDAC2 and HDAC3 were inhibited by co-transfection of siHDAC2 and siHDAC3 to simulate the effect of VPA on histone acetylation. The optimal siRNA concentration of 50 nM was determined by Cy3 labeled siRNA transfection control (Figure 4B). The transfection of siHDAC2 and siHDAC3 efficiently decreased the mRNA expression of HDAC2 and HDAC3 respectively (Figure 4C), and histone acetylation increased in siHDAC2 or 3 transfected LX2 cells (Figure 4D). The expressions of miRNAs and target proteins in siHDAC2 and 3 co-transfected LX2 cells were consistent with the observations in VPA treated LX2 cells (Figure 4E, F), comparing to negative control. Direct modification of histone acetylation could regulate the expression of miRNAs and their target protein-encoding genes.
VPA regulated miRNA expression through increased histone acetylation. (A) VPA treatment increased the global protein acetylation of LX2 cells as detected by western blot using an antibody against pan acetyl-lysine, the band for histone was about 15KD. (B) The transfection condition for LX2 cells was optimized by Cy3 labeled siRNA transfection control (Cy3-siTC), and a minimal concentration of 50nM was used in the present study according to transfection efficiency, ×200. (C) The expression of HDAC2 or 3 mRNA in siHDAC2 or 3 transfected LX2 cells was detected by qRT-PCR. (D) Knockdown of HDAC2 and HDAC3 by siRNAs enhanced the acetylation of Histone H3, detected by western blot using an antibody against acetylated lysine (K) 27 of histone H3 (AcH3K27). (E, F) The expression of VPA-miRNAs (E) and mRNAs of VPA-protein-encoding genes (F) in siHDAC2 and 3 co-transfected LX2 cells was detected by qRT-PCR, all expressions were compared to untreated control or non-targeting siRNA negative control (siNC), *** P < 0.001, ** P< 0.01, *P < 0.05.
Discussion
Focusing on the crosstalk of histone acetylation and miRNAs in human carcinogenesis and chronic diseases could give in-depth insights into new 'druggable' targets and provide evidence for further development of therapeutic approaches. While many target genes of histone acetylation and miRNAs are known, even less information exists as to how these mechanisms cooperate and how they may regulate each other in a specific pathological context.
HDACI epigenetically modulates gene transcription or increases protein acetylation. It leads to the inhibition of cellular growth, promotion of differentiation and apoptosis. In the present study, we explored the miRNA mechanism underlying the therapeutic effects of HDACI for liver fibrosis.
VPA is a short chain fatty acid HDACI. It not only suppressed HSCs activation [7], but also selectively inhibited the proliferation of hepatocellular carcinoma cells without injuring normal hepatocytes [22]. Furthermore, it is one of the most widely prescribed antiepileptic drugs worldwide, and has been proved to be well tolerated by the majority of patients[23], which made it easy for translational medicine. It has been included in some phase II clinical trials for cancer therapy [13, 24], and it could also be a promising medication for reducing liver fibrosis, or even preventing HCC development from cirrhosis liver. Therefore, VPA was chosen as the HDACI used in the present study.
It was widely acknowledged that miRNAs mostly result in suppressed gene expression at both the level of mRNA stability by conducting mRNA degradation and the level of translation by inhibiting protein translation through binding complementarily to 3'UTR of the target mRNAs. In consideration of these features of miRNA mediated posttranscriptional regulation, we directly compared the global protein expression profiles between VPA treated and untreated LX2 cells by iTraq based proteomic analysis.
Global protein expression profiles of VPA treated and untreated LX2 cells were obtained by iTraq based proteomic analyses. We noticed that in VPA treated HSCs, only 86 (5.56%) proteins were differentially expressed, with 54 (62.79%) up-regulated and 31(36.09%) down-regulated at a differential expression ratio of 1.333, only 5 proteins increased and 3 proteins reduced for more than 2-fold (Table S3). But in our previous primary HSCs study [2], 519 (21.47%) proteins were differentially expressed for more than 3.0-fold upon HSCs activation, among them 319 and 200 proteins were found to be up- or down-regulated. Considering the number of proteins affected and the extent of alteration, the change of protein expression in VPA treated LX2 cells was relatively mild (Table S2), but still effectively suppressed HSCs activation.
The biofunctions of proteins which increased or decreased by more than 1.333-fold were analyzed by IPA. The top biofunctions of these differentially expressed proteins well reflected the suppressive effect of VPA on HSCs proliferation and migration. The proteins involved were provided in Table S3 which should be helpful to understand the molecular basis of VPA induced suppression of human HSCs activation at the protein level.
By miRNA microarray analyses, we found that VPA had a wide range of impact on miRNA expression. In VPA treated LX2 cells, 43.62% miRNAs showed differential expression, with more down-regulated miRNAs (104, 84.55%) than up-regulated miRNAs (19, 15.45%) (Table S4). Similar effects of HDACI on miRNA expression have been reported by Scott GK et al. In HDACI LAQ824 treated breast cancer cell line, significant changes were measured in 40% miRNA species, with 22 miRNA species down-regulated and 5 miRNAs up-regulated [25]. It is well known that HDACI could increase acetylation of histone, and transform the condensed chromatin into a more relaxed structure that is associated with higher levels of gene transcription. But for miRNA, it seems that some HDACIs could induce global reduction of miRNA transcription. The potential mechanism needs to be explored.
More than half of the VPA-protein-encoding genes were predicted targets of VPA-miRNAs, which suggests an important role of miRNA in VPA regulated protein expression. Further analyses showed that among the VPA-proteins involved in cell death and survival, 61.11% were predicted targets of VPA-miRNAs, among the proteins involved in cellular movement, 63.33% were predicted targets of VPA-miRNAs (Table S3, Table S5). These data suggested that miRNA mediated post-transcriptional regulation is an essential mechanism involved in the genetic regulatory effects of VPA.
Although recent evidence suggested that HDACIs could also enhance the acetylation of non-histone proteins [26, 27], we proposed that increased histone acetylation should still be responsible for the effects of VPA on miRNA expression. VPA is a potent HDACI which could bind to the catalytic center and block substrate access, or selectively induces proteasomal degradation of HDAC2 [10, 28]. In the present study, HDAC2 and HDAC3 were inhibited by siRNAs in LX2 cells to simulate the inhibitory effect of VPA on class I HDACs, and subsequent histone acetylation. We found that VPA could regulate the expression of miRNAs and their target protein-encoding genes at least partially by modification of histone acetylation.
An interesting finding was that RNA post-transcriptional modification is among the top 3 biofunctions of VPA-proteins (Figure 3A, Table S3). The expression of a group of heterogeneous nuclear ribonucleoproteins (hnRNP) increased (including HNRNPA1, HNRNPA2B1, and HNRNPM). These hnRNPs were reported to be involved in the packaging of pre-mRNA into hnRNP particles, transport of poly(A) mRNA from the nucleus to the cytoplasm and may modulate splice site selection [29, 30]. The hnRNPs also bind to specific primary miRNA (pri-miRNAs) and promotes pri-miRNA processing by enhancing binding of DGCR8 to pri-miRNA transcripts [31, 32]. HNRNPA2B1 was also reported to be involved in miRNA sorting into exosomes, possibly by binding (m6A)-containing pre-miRNAs [33]. While HNRNPA1, HNRNPA2B1, and HNRNPM were also targeted by VPA-miRNAs( Table 1), it indicated that the proteins regulated by VPA-miRNAs could, in turn, adjust the expression or metabolism of these miRNAs.
In the present study, the differential protein expression profile of VPA treated HSCs was obtained, the molecular mechanisms of the suppressive effect of VPA on the activation of HSCs were illustrated. The network of regulation between miRNA and proteins which could be regulated by VPA in HSCs was analyzed systematically. Furthermore, a direct effect of histone acetylation modification on miRNAs expression was also investigated. In conclusion, our findings emphasized the importance of post-transcriptional regulation on gene expression by HDACI in addition to their established effects on promoter-driven gene expression, and a considerable role of miRNAs in the inhibitory effects of VPA on HSCs activation.
Abbreviations
HSC: hepatic stellate cell; ECM: extracellular matrix; HDACI: histone deacetylase inhibitor; VPA: valproic acid; miRNA: microRNA; iTraq: isobaric tags for relative and absolute quantitation; CCK8: cell counting kit-8; EdU: 5-ethynyl-2'-deoxyuridine; 2D nano-LC-MS/MS: two-dimensional nanoscale liquid chromatography and tandem mass spectrometry; IPI: International Protein Index; qRT-PCR: quantitative reverse-transcription polymerase chain reaction; IPA: Ingenuity Pathways Analysis; siRNA: small interfering RNA; HMGA1: high mobility group protein A1; hnRNP: heterogeneous nuclear ribonucleoproteins.
Supplementary Material
Supplementary figures and tables.
Acknowledgements
This research is supported by grants from the National Natural Science Foundation of China, No. 81761128018, 81572871 and 81141048 to JJL, No. 81272027 to JYH, Natural Science Foundation of Jiangsu Province, No. BK20151277 to JJL. The funders had no role in study design, data collection, and analysis, decision to publish, or preparation of the manuscript.
Competing Interests
The authors have declared that no competing interest exists.
References
1. Geerts A. History, heterogeneity, developmental biology, and functions of quiescent hepatic stellate cells. Seminars in liver disease. 2001;21:311-35
2. Ji J, Yu F, Ji Q, Li Z, Wang K, Zhang J. et al. Comparative proteomic analysis of rat hepatic stellate cell activation: a comprehensive view and suppressed immune response. Hepatology. 2012;56:332-49
3. Friedman SL. Liver fibrosis - from bench to bedside. Journal of Hepatology. 2003;38:38-53
4. Mederacke I, Hsu CC, Troeger JS, Huebener P, Mu X, Dapito DH. et al. Fate tracing reveals hepatic stellate cells as dominant contributors to liver fibrosis independent of its aetiology. Nature communications. 2013;4:2823
5. Friedman SL. Stellate cells: a moving target in hepatic fibrogenesis. Hepatology. 2004;40:1041-3
6. Mann J, Oakley F, Akiboye F, Elsharkawy A, Thorne AW, Mann DA. Regulation of myofibroblast transdifferentiation by DNA met0hylation and MeCP2: implications for wound healing and fibrogenesis. Cell death and differentiation. 2007;14:275-85
7. Mannaerts I, Nuytten NR, Rogiers V, Vanderkerken K, van Grunsven LA, Geerts A. Chronic administration of valproic acid inhibits activation of mouse hepatic stellate cells in vitro and in vivo. Hepatology. 2010;51:603-14
8. Ji J, Zhang J, Huang G, Qian J, Wang X, Mei S. Over-expressed microRNA-27a and 27b influence fat accumulation and cell proliferation during rat hepatic stellate cell activation. FEBS letters. 2009;583:759-66
9. Guo CJ, Pan Q, Li DG, Sun H, Liu BW. miR-15b and miR-16 are implicated in activation of the rat hepatic stellate cell: An essential role for apoptosis. J Hepatol. 2009;50:766-78
10. Eberharter A, Becker PB. Histone acetylation: a switch between repressive and permissive chromatin. Second in review series on chromatin dynamics. EMBO reports. 2002;3:224-9
11. Prince HM, Bishton MJ, Harrison SJ. Clinical studies of histone deacetylase inhibitors. Clinical cancer research: an official journal of the American Association for Cancer Research. 2009;15:3958-69
12. Haberland M, Montgomery RL, Olson EN. The many roles of histone deacetylases in development and physiology: implications for disease and therapy. Nature reviews Genetics. 2009;10:32-42
13. Rocca A, Minucci S, Tosti G, Croci D, Contegno F, Ballarini M. et al. A phase I-II study of the histone deacetylase inhibitor valproic acid plus chemoimmunotherapy in patients with advanced melanoma. British journal of cancer. 2009;100:28-36
14. Mottamal M, Zheng S, Huang TL, Wang G. Histone deacetylase inhibitors in clinical studies as templates for new anticancer agents. Molecules. 2015;20:3898-941
15. Niki T, Rombouts K, De Bleser P, De Smet K, Rogiers V, Schuppan D. et al. A histone deacetylase inhibitor, trichostatin A, suppresses myofibroblastic differentiation of rat hepatic stellate cells in primary culture. Hepatology. 1999;29:858-67
16. Bartel DP. MicroRNAs: target recognition and regulatory functions. Cell. 2009;136:215-33
17. Ji Y, Zhang J, Wang W, Ji J. Functional study of miR-27a in human hepatic stellate cells by proteomic analysis: comprehensive view and a role in myogenic tans-differentiation. PloS one. 2014;9:e108351
18. Yauk CL, Rowan-Carroll A, Stead JD, Williams A. Cross-platform analysis of global microRNA expression technologies. BMC genomics. 2010;11:330
19. Narita M, Narita M, Krizhanovsky V, Nunez S, Chicas A, Hearn SA. et al. A novel role for high-mobility group a proteins in cellular senescence and heterochromatin formation. Cell. 2006;126:503-14
20. Jin H, Lian N, Zhang F, Chen L, Chen Q, Lu C. et al. Activation of PPARgamma/P53 signaling is required for curcumin to induce hepatic stellate cell senescence. Cell death & disease. 2016;7:e2189
21. Krizhanovsky V, Yon M, Dickins RA, Hearn S, Simon J, Miething C. et al. Senescence of activated stellate cells limits liver fibrosis. Cell. 2008;134:657-67
22. Armeanu S, Pathil A, Venturelli S, Mascagni P, Weiss TS, Gottlicher M. et al. Apoptosis on hepatoma cells but not on primary hepatocytes by histone deacetylase inhibitors valproate and ITF2357. J Hepatol. 2005;42:210-7
23. Macdonald RL, Kelly KM. Antiepileptic drug mechanisms of action. Epilepsia. 1993;34(Suppl 5):S1-8
24. Nilubol N, Merkel R, Yang L, Patel D, Reynolds JC, Sadowski SM. et al. A phase II trial of valproic acid in patients with advanced, radioiodine-resistant thyroid cancers of follicular cell origin. Clinical endocrinology. 2017;86:128-33
25. Scott GK, Mattie MD, Berger CE, Benz SC, Benz CC. Rapid alteration of microRNA levels by histone deacetylase inhibition. Cancer research. 2006;66:1277-81
26. Yu X, Guo ZS, Marcu MG, Neckers L, Nguyen DM, Chen GA. et al. Modulation of p53, ErbB1, ErbB2, and Raf-1 expression in lung cancer cells by depsipeptide FR901228. Journal of the National Cancer Institute. 2002;94:504-13
27. Mawatari T, Ninomiya I, Inokuchi M, Harada S, Hayashi H, Oyama K. et al. Valproic acid inhibits proliferation of HER2-expressing breast cancer cells by inducing cell cycle arrest and apoptosis through Hsp70 acetylation. International journal of oncology. 2015;47:2073-81
28. Kramer OH, Zhu P, Ostendorff HP, Golebiewski M, Tiefenbach J, Peters MA. et al. The histone deacetylase inhibitor valproic acid selectively induces proteasomal degradation of HDAC2. The EMBO journal. 2003;22:3411-20
29. He Y, Smith R. Nuclear functions of heterogeneous nuclear ribonucleoproteins A/B. Cellular and molecular life sciences: CMLS. 2009;66:1239-56
30. Paronetto MP, Achsel T, Massiello A, Chalfant CE, Sette C. The RNA-binding protein Sam68 modulates the alternative splicing of Bcl-x. The Journal of cell biology. 2007;176:929-39
31. Treiber T, Treiber N, Plessmann U, Harlander S, Daiss JL, Eichner N. et al. A Compendium of RNA-Binding Proteins that Regulate MicroRNA Biogenesis. Molecular cell. 2017;66(e13):270-84
32. Alarcon CR, Goodarzi H, Lee H, Liu X, Tavazoie S, Tavazoie SF. HNRNPA2B1 Is a Mediator of m(6)A-Dependent Nuclear RNA Processing Events. Cell. 2015;162:1299-308
33. Villarroya-Beltri C, Gutierrez-Vazquez C, Sanchez-Cabo F, Perez-Hernandez D, Vazquez J, Martin-Cofreces N. et al. Sumoylated hnRNPA2B1 controls the sorting of miRNAs into exosomes through binding to specific motifs. Nature communications. 2013;4:2980
Author contact
![]() Corresponding authors: Juling Ji, jijulingedu.cn; Yuhua Ji, tjyhedu.cn
Corresponding authors: Juling Ji, jijulingedu.cn; Yuhua Ji, tjyhedu.cn