Impact Factor ISSN: 1449-2288

 Global reach, higher impact
Int J Biol Sci 2019; 15(3):544-555. doi:10.7150/ijbs.30297 This issue Cite
Research Paper
Cyclin G2 Inhibits the Warburg Effect and Tumour Progression by Suppressing LDHA Phosphorylation in Glioma
Sen Li, Jinlan Gao, Xinbin Zhuang, Chenyang Zhao, Xiaoyu Hou, Xuesha Xing, Chen Chen, Qi Liu, Shuang Liu, Yang Luo ![]()
The Research Center for Medical Genomics, Key Laboratory of Cell Biology, Ministry of Public Health, Key Laboratory of Medical Cell Biology, Ministry of Education, China Medical University, Shenyang, China
Received 2018-9-30; Accepted 2018-11-8; Published 2019-1-1
Abstract

Cyclin G2 has been identified as a tumour suppressor in several cancers. However, its regulatory roles and underlying mechanisms in tumours are still unknown. In this study, we demonstrated that cyclin G2 was expressed at low levels in glioma, which was as a poor prognostic factor for this disease. We also found that, cyclin G2 could suppress cell proliferation, initiate cell apoptosis and reduce aerobic glycolysis, suggesting that cyclin G2 plays a tumour suppressive role in glioma. Mechanistically, cyclin G2 could negatively regulate tyrosine-10 phosphorylation of a critical glycolytic enzyme, lactate dehydrogenase A, through direct interaction. Taken together, these results indicate that cyclin G2 acts as a tumour suppressor in glioma by repressing glycolysis and tumour progression through its interaction with LDHA.
Keywords: glioma, Warburg effect, cyclin G2, lactate dehydrogenase A
Introduction
Glioma is the most common primary central nervous system tumour with the poorest prognosis compared to other cancers [1]. Glioblastoma (GBM) accounts for more than half of the diagnosed gliomas with an overall survival rate of less than 5% [2-4]. Surgical resection followed by traditional radiotherapy plus chemotherapy is the standard treatment for malignant glioma [5]. Despite improvements in therapy (e.g., immune and gene therapy), the outcome for GBM patients remains dismal, with an overall survival time of approximately 15 months [6-8].
Glucose metabolism is highly disordered in tumours, including glioma [9]. Like most cancers, glioblastomas prefer aerobic glycolysis over oxidative phosphorylation (OXPHOS), a phenomenon known as the Warburg effect [10]. A recent study suggested that a reversal of the Warburg effect could serve as a novel therapy for glioma [11]. Lactate dehydrogenase (LDH) is a key enzyme in aerobic glycolysis that is responsible for the conversion of pyruvate to lactate [12]. The LDHA subunit enhances the efficiency of the LDH complex, which allows rapid flux through glycolysis. These characteristics of the LDH complex and LDHA contribute to the Warburg effect in tumour cells [13]. Indeed, several studies have identified LDHA as a major biomarker of glycolytic activity [14-16]. LDHA is overexpressed in pancreatic, breast, gastric, oral and colorectal cancer and hepatocellular carcinoma [17-23]. Moreover, tyrosine 10 (Y10) phosphorylation of LDHA is common in diverse human cancers, and phosphorylated LDHA Y10 levels directly correlate with the activities of several oncogenic tyrosine kinases, including fibroblast growth factor receptor 1 (FGFR1), Janus kinase 2 (JAK2), breakpoint cluster region/ABL proto-oncogene 1 (BCR/ABL) and fms related tyrosine kinase 3- internal tandem duplication (FLT3-ITD) [24]. Based on these data, we investigated the underlying role of LDHA in glioma.
Cyclin G2 is an unconventional cyclin homolog encoded by CCNG2. Unlike conventional cyclins that promote cell cycle progression, cyclin G2 induces G1/S cell cycle arrest even though it possesses a conserved 'cyclin-fold' domain [25]. Similarly, cyclin G2 is linked to growth inhibition and tumour suppression [26]. Indeed, we found that cyclin G2 negatively regulated gastric cell proliferation [27]. In addition, mounting evidence indicates that cyclin G2 can reduce proliferation, colony formation, migration, invasion, and increase apoptosis [28]. Furthermore, cyclin G2 is downregulated in thyroid, pancreatic, oral, and breast cancer [29-32]. Therefore, we studied the mechanism of cyclin G2 expression in glioma. Specifically, we investigated whether cyclin G2 played a role in glioma progression, and explored whether cyclin G2 regulated glioma cell metabolism. We demonstrated that cyclin G2 was downregulated in glioma compared to normal brain tissue, and the expression of cyclin G2 was negatively associated with the malignancy of glioma. In addition, overexpression of cyclin G2 in glioma cells suppressed cell proliferation, colony formation, migration and invasion, arrested cell cycle progression at the G1/S phase, initiated apoptosis and decreased glycolysis. Furthermore, we found that LDHA activity and Y10 phosphorylation were negatively regulated by cyclin G2. Taken together, these results indicate that cyclin G2 functions as a tumour suppressor in glioma by inhibiting aerobic glycolysis and tumour progression through its interaction with LDHA and subsequent blockage of LDHA Y10 phosphorylation.
Methods
Immunohistochemistry (IHC)
Tissue microarrays of glioma (Outdo Biotech Co, Shanghai, China) were deparaffinized and hydrated. The slides were incubated in citric acid buffer (pH 6.0), heated in a pressure cooker for 10 min, and then treated with 3% H2O2 for 15 min followed by washing with PBS three times for 5 min each. The slides were incubated with primary antibodies overnight at 4ºC. The slides were washed three times with PBS (5 min each) and then incubated with reaction enhancer and polymerase binding solutions (Maixin, Fujian, China) successively for 10 min at room temperature. The slides were visualised with 3,3'-diaminobenzidine (DAB) (Maixin) for 2 min and counterstained with haematoxylin for 1 min. The slides were mounted and photographed with an Olympus BX51 microscope (Olympus, Tokyo, Japan). The integral optical density (IOD) of staining was estimated using Image-Pro Plus 6.0 software (Media Cybernetics Inc., Rockville, MD, USA).
Cell culture, transfection and cell line construction
Human U87 and U251 and mouse GL261 glioma cells were purchased from the Chinese Academy of Science Cell Bank (Shanghai, China). Cells were maintained in Dulbecco's modified Eagle's medium (DMEM, Gibco, Carlsbad, CA, USA) supplemented with 10% foetal bovine serum (FBS, Biological Industries, Kibbutz Beit Haemek, Israel) and 1% penicillin/streptomycin (Gibco) at 37°C with 5% CO2. To generate cell lines stably overexpressing cyclin G2, FLAG-tagged cyclin G2 (FLAG-CCNG2) was cloned into a lentivirus vector by GeneChem Co., Ltd. Virus was harvested and used to infect U87 and U251 cells. The transduced cells were selected with 10 μg/ml puromycin (Sigma-Aldrich, Santa Clara, CA, USA) for 15 days. Cyclin G2 overexpression was assessed by qPCR and western blotting. For RNA interference (RNAi) mediated knockdown of CCNG2, cells were transfected with CCNG2 siRNA and negative control (RiboBio, Guangzhou, China) using Lipofectamine® 3000 (Invitrogen, Carlsbad, CA, USA).
Cell proliferation assay
The proliferation of glioma cells was measured using the CellTiter 96 AQueous One Solution cell proliferation assay kit according to the manufacturer's instructions (Promega, Madison, WI, USA). Briefly, cells were cultured in 96-well plates at a density of 1×10³ cells/well for 24, 48, 72 and 96 h. MTS (20 μl) was added to each well, and the plates were incubated for 3 h at 37°C. The absorbance at 495 nm was measured using an ultraviolet spectrophotometer (Thermo Fisher Scientific, Waltham, MA, USA).
Wound healing assay
Cells were grown in six-well plates to 100% confluence, and then a 2-mm wide plastic pipette tip was used to scratch a neat and straight line in each well. The wells were washed with PBS twice to remove debris, and fresh serum-free DMEM was added. Five fields of each wound were monitored at 0 and 24 h to evaluate the migration of cells. The wound healing rate was calculated using ImageJ (National Institutes of Health).
Cell invasion assay
The filters of transwell inserts were coated with Matrigel (BD Biosciences, Franklin Lakes, NJ, USA). U87 cells (8×10⁴) in serum-free DMEM (200 μl) were added to the 24-well transwells (Corning, NY, USA). The upper compartment contained an 8-μm pore size polycarbonate membrane, and the lower compartment was filled with DMEM containing 15% FBS as a chemoattractant. The transwell system was incubated for 16 h in 5% CO2 at 37ºC. Non-migrating cells on the upper surface of the filter were removed using a cotton-tipped swab, and cells on the lower surface were stained with 1% crystal violet (Solarbio Science & Technology, Beijing, China). The capacity of the cells to dissolve the extracellular matrix was quantified.
Colony formation assay
Cells were seeded in six-well plates at a density of 300 cells/well, and cultured in fresh DMEM with 10% FBS for 15 days. The colonies were fixed with methanol and then stained with 1% crystal violet (Solarbio). The colonies were counted using ImageJ. The values were normalised to the control value.
Apoptosis assay
Apoptosis assays were performed using the PE Annexin V apoptosis detection kit (BD Biosciences) according to the manufacturer's instructions. Briefly, U87 and U251 cells were stained with Annexin V-PE and 7-AAD in the dark for 15 min at room temperature. Apoptotic cells (i.e., the total percentage of Annexin V-positive cells) were quantified using the FACS Canto II flow cytometer and FlowJo software (TreeStar, Ashland, OR, USA).
Cell cycle analysis
Cell cycle analysis was performed using propidium iodide (PI) stain (BD Biosciences) according to the manufacturer's instructions. Briefly, 5×10⁵ cells were fixed in 5 ml ice-cold 70% ethanol overnight and then incubated with 50 µg/ml PI at 4°C. The DNA content was determined using the FACS Canto II flow cytometer (BD Biosciences). The percentages of cells in the G0/G1, S and G2/M phases of the cell cycle were quantified.
Isolation and culture of mouse embryonic fibroblasts (MEF) cells
Pregnant mice (13 to 14 d post-coitum) were euthanised by cervical dislocation, and embryos were separated from the placenta and embryonic sac. Head and red organs were dissected for genotyping, and the remaining tissues were minced, transferred to a 0.1 mM trypsin/1 mM EDTA solution, and incubated at 37ºC for 20 min. After trypsinisation, an equal amount of medium (DMEM containing 10% FBS) was added, and the solution was pipetted up and down several times to aid tissue dissociation. After incubation of the tissue/medium mixture at room temperature for 5 min, the supernatant was transferred to a clean tube. Cells were collected by centrifugation (500× g for 5 min at 4ºC) and resuspended in fresh medium. 1×10⁶ cells (passage one) were cultured in 100 mm dishes at 37ºC with 5% CO2. Primary MEF cells were used for the experiments within three to five passages.
Glucose uptake assay
Approximately 24 h before the glucose uptake experiments, cells were plated in a 96-well plate at a density of 2000 cells/well. Cells were washed three times with PBS and then glucose-starved by plating in 100 μL of Krebs-Ringer-Phosphate-HEPES (KRPH) buffer composed of 20 mM HEPES, 5 mM KH2PO4, 1 mM MgSO4, 1 mM CaCl2, 136 mM NaCl and 4.7 mM KCl, pH 7.4 containing 2% BSA for 40 min. Glucose uptake was measured using the Glucose Uptake Colorimetric Assay Kit (MAK083, Sigma-Aldrich) according to the manufacturer's instructions. All the experiments were performed in triplicate and repeated three times.
Measurement of lactate production and lactate dehydrogenase (LDH) activity
Lactate secretion in the culture medium of cells were detected by using the commercial Lactate Assay Kit (MAK065, Sigma-Aldrich) in fully accordance to the manufacturer's instruction. LDH activity was measured as previously described [24]. Results were normalised on the basis of the total protein concentration of each sample. All the experiments were performed in triplicate and repeated three times.
Extracellular flux assay
To measure the extracellular acidification rate (ECAR), 2 × 10⁴ cells/well were seeded into each well of an XF24 microplate (Seahorse Bioscience, North Billerica, MA, USA) 16 hours before the experiment. Immediately before the ECAR measurement, the culture medium was replaced with assay medium (low-buffered DMEM containing 25 mM D-glucose, 1 mM sodium pyruvate and 1 mM L-glutamine), and incubated for 1 h at 37°C. After calibration of the XF24 sensor cartridge, the cell plate was loaded in the analyser (Seahorse Bioscience), and the ECAR was measured. At the end of the assay, cells were harvested and counted. The measurements of ECAR were normalised according to the final cell number.
Co-immunoprecipitation
Cells expressing FLAG or FLAG-tagged cyclin G2 were lysed in lysis buffer as previously described [33]. FLAG-tagged protein was immunoprecipitated from the lysate with anti-FLAG affinity gel (Bimake, Shanghai, China). The affinity gel was washed three times with PBS and resuspended in 2×loading buffer. The immunoprecipitates were eluted with FLAG peptide and separated by 12% sodium dodecyl sulphate-polyacrylamide gel electrophoresis (SDS-PAGE). The experiment was performed with three biological replicates per condition.
Mass spectrometry
Cells expressing FLAG or FLAG-tagged cyclin G2 were lysed in lysis buffer. The FLAG-tagged protein was immunoprecipitated from the lysate using an anti-FLAG affinity gel. The affinity gel was washed three times with PBS and resuspended in 2×loading buffer. Proteins were resolved on a 10% polyacrylamide gel, stained with Coomassie Brilliant Blue (R250) and subjected to mass spectrometry.
Western blotting
Cells were extracted with RIPA lysis buffer containing 20 mM Tris-HCl, 150 mM NaCl, 2 mM EDTA, 1% Triton X-100 and protease inhibitor cocktail (Roche, Basel, Switzerland). Protein lysates were separated by 12% SDS-PAGE and transferred to polyvinylidene fluoride (PVDF) membranes (Millipore, Billerica, MA, USA). After blocking with 5% nonfat milk (BD Bioscience) for 2 h at room temperature, the membranes were incubated with one of the following primary antibodies: anti-DDDDK tag (ab49763, Abcam, Cambridge, MA, USA), LDHA (ab101562, Abcam), phospho-LDHA (Tyr10) (8176, Cell Signalling Technology, Danvers, MA, USA), cyclin G2 (HPA034684, Sigma-Aldrich) or GAPDH (5174, Cell Signalling Technology) overnight at 4°C. The membranes were incubated with an HRP-linked secondary antibody (anti-rabbit IgG; Thermo Fisher Scientific, Waltham, MA, USA) for 2 h. Proteins of interest were visualised using an ECL Plus kit (Advansta, Menlo Park, CA, USA). Three independent experiments were performed.
In situ proximity ligation assay
The in situ proximity ligation assay (PLA, Sigma-Aldrich) was performed to investigate the interactions between cyclin G2 and LDHA according to manufacturer's protocol. Briefly, cells seeded in 15mm-glass bottom cell culture dishes were washed with PBS, fixed in 4% paraformaldehyde for 30 min, and then permeabilized in 0.1% Triton X-100 for 20 min. Dishes were then blocked with Duolink blocking solution in a pre-heated humidity chamber for 30 min at 37 °C and incubated with the primary antibodies against cyclin G2 (sc-7266; 1:10, Santa Cruz Biotechnology, CA, USA) and LDHA (ab101562; 1:100, Abcam) overnight at 4 °C. For negative controls, cells were treated with goat or rabbit IgG in replace of the primary antibodies. After washing unbound antibodies, proximity probes were applied and DNA was amplified after hybridization and ligation of oligonucleotide according to the manufacturer's instruction. Nuclei were stained using the Duolink In Situ Mounting Medium with DAPI. Fluorescence was visualised using Olympus FV1000S-SIM confocal microscopy.
RNA isolation and quantitative reverse transcription PCR (qRT-PCR)
Total RNA was isolated using TRIzol Reagent according to the manufacturer's instructions (QIAGEN, CA, USA). Total RNA was reverse transcribed into cDNA using a reverse transcription kit (RR036A, Takara, Tokyo, Japan). qRT-PCR was performed using a SYBR Green PCR kit (TAKARA) on a Roche LightCycler480 Real-Time PCR system. Target gene expression was normalised to that of GAPDH. All experiments were carried out in triplicate. The CP value was used to calculate the relative expression of the genes.
Animal experiments
Intracranial injections of GL261 cells in C57BL/6 wildtype and C57BL/6 cyclin G2 knockout (Ccng2-/-) mice (6 to 8-week-old, female) and volume measurement of tumours were conducted as previously described [34]. Blood samples were collected by retro-orbital puncture. Serum was obtained from each blood sample by centrifugation at 3500 rpm for 10 min and stored at -80℃ until the analysis of lactate concentration and LDH activity.
BALB/c-nu/nu mice (4 to 5-week-old females) were purchased from Beijing Vital River Laboratory Animal Technology Co., Ltd. and bred in laminar flow cabinets under specific pathogen-free conditions in the Laboratory Animal Center of China Medical University. Mice (n = 6/cell line) were subcutaneously injected with 2×10⁶ U87 cells stably expressing FLAG or FLAG-tagged cyclin G2. On day 35, the mice were euthanised by sodium pentobarbital overdose, and the primary tumours were excised and weighed. All animal procedures were approved and compiled with the guidelines of the Institutional Animal Care Committee of China Medical University.
TUNEL assay
Paraformaldehyde-fixed tissue sections were deparaffinized in xylene, rehydrated in ethanol and incubated with proteinase K (0.02 mg/ml) for 20 min at room temperature. TUNEL staining was carried out using an apoptosis detection kit (Wanleibio, Liaoning, China) according to the manufacturer's instructions. Three different fields of each slide were randomly selected for analysis. The apoptotic cells were identified by the intense dark nuclear staining. TUNEL-positive cells were expressed as a percentage of the total cells in the three fields.
Statistical analysis
All data are presented as the mean ± standard deviation (S.D.) unless otherwise indicated. Statistical analysis was performed using the Student's t-test or one-way analysis of variance (ANOVA) followed by the post-hoc Tukey test using SPSS software (version 17.0; IBM Corporation) and GraphPad Prism 5 software (San Diego, CA). Differences between groups were considered significant when p < 0.05.
Results
Low expression of cyclin G2 predicts poor prognosis in patients with glioma
IHC was used to determine cyclin G2 protein levels of tissue microarrays of glioma. The clinicopathological characteristics of glioma patients are shown in Table 1. The average expression of cyclin G2 in glioma was lower than that in normal brain tissue. In addition, cyclin G2 expression decreased with increasing clinical WHO grade for glioma. Representative microarray samples are presented in Figure 1a.
Relationships between cyclin G2 expression in human glioma tissues and clinicopathological features.
| Characteristics | No. of cases | Relative cyclin G2 expression (n, %) | ||
|---|---|---|---|---|
| High (n=31) | Low (n=49) | p value | ||
| Age | 47.032±14.77 | 55.00±11.75 | 0.120 | |
| Gender | 0.459 | |||
| Male | 42 | 18 (58.06%) | 24 (48.98%) | |
| Female | 38 | 13 (41.94%) | 25 (51.02%) | |
| WHO grade | p<0.001 | |||
| Normal | 3 | 3 (9.68%) | 0 (0) | |
| WHO I-II | 17 | 12 (38.71%) | 5 (10.20%) | |
| WHO III-IV | 60 | 16 (51.61%) | 44 (89.80%) | |
Cyclin G2 expression was negatively correlated with WHO grade and is a poor prognostic indicator in glioma. a: Representative images of cyclin G2 staining of non-cancerous brain tissues and different WHO grade I-IV gliomas, upper bar = 200 μm, lower bar = 100 μm. b: The score of cyclin G2 staining in normal brain tissues and different WHO grade gliomas. Data are presented as the mean ± S.D., *p <0.05, **p < 0.01. c: Kaplan-Meier curves showed worse overall survival rates for glioma patients with low cyclin G2 expression compared to patients with high expression (p = 0.02).
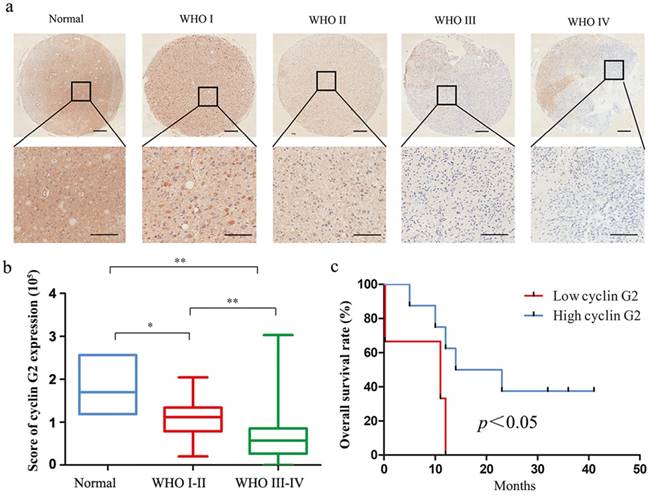
Associations between the expression of the cyclin G2 protein and clinicopathological features of glioma were also investigated. As shown in Table 1, no significant differences were observed between cyclin G2 protein expression and age or gender of the glioma patients (p > 0.05). However, cyclin G2 expression was significantly associated with the clinical WHO grade (Figure 1b, p = 0.002). We also analysed the association between cyclin G2 expression and overall survival of the patients. Thirteen glioma patients were included in the analysis, and the survival times ranged from 0.23 to 42 months. The overall survival rate of patients with high cyclin G2 expression was significantly higher than that of patients with low cyclin G2 expression (Figure 1c, p = 0.02). These results indicate that loss of cyclin G2 has an essential role in the development of glioma.
Cyclin G2 inhibits cell proliferation, migration, invasion and the cell cycle and increases apoptosis
To further investigate the effects of cyclin G2 on glioma cells, we generated stable control (FLAG-Vector) and cyclin G2-overexpressing (FLAG-CCNG2) U87 and U251 cell lines. In addition, we used RNA interference (RNAi) to knockdown cyclin G2 in U87 and U251 cells. Analysis of cell proliferation rates demonstrated that cell growth was suppressed by cyclin G2 overexpression and markedly increased by RNAi-mediated knockdown of cyclin G2 expression (Figure 2a, 2b). Furthermore, cyclin G2 overexpression delayed wound closure and decreased the number of invading cells in the transwell assay compared to control cells, indicating that cyclin G2 could abrogate migration and invasion of glioma cells (Figure 2c, 2d, 2e, 2f). In contrast, knockdown of cyclin G2 caused the opposite effects (Figure 2c, 2d, 2e, 2f).
Cyclin G2 inhibits cell proliferation, migration, invasion and induces cell apoptosis in glioma cells. a,b: Measurement of the proliferation of cyclin G2-overexpression and cyclin G2-knockdown U87(a) or U251(b) cells using the MTS assay. c,d: Representative photos(c) and quantification(d) of wounded areas taken 0 or 24 h after wounding of cyclin G2-overexpressing and cyclin G2-knockdown U87 or U251 cell monolayers, scale bar = 400 μm. e,f: Analysis of invasion by cyclin G2-overexpressing and cyclin G2-knockdown U87 or U251 cells(e) and quantification(f), scale bar = 200 μm. g,h: Colony formation analysis of cyclin G2-overexpressing and cyclin G2-knockdown U87 or U251(g) and quantification(h), scale bar = 400 μm. i,j: Cell cycle analysis for cyclin G2-overexpressing and cyclin G2-knockdown U87 or U251 cells using flow cytometry. k,m,l: Apoptosis in cyclin G2-overexpressing and cyclin G2-knockdown U87 or U251 cells measured by flow cytometry. Data are presented as the mean ± S.D., *p < 0.05, **p < 0.01 versus vector.
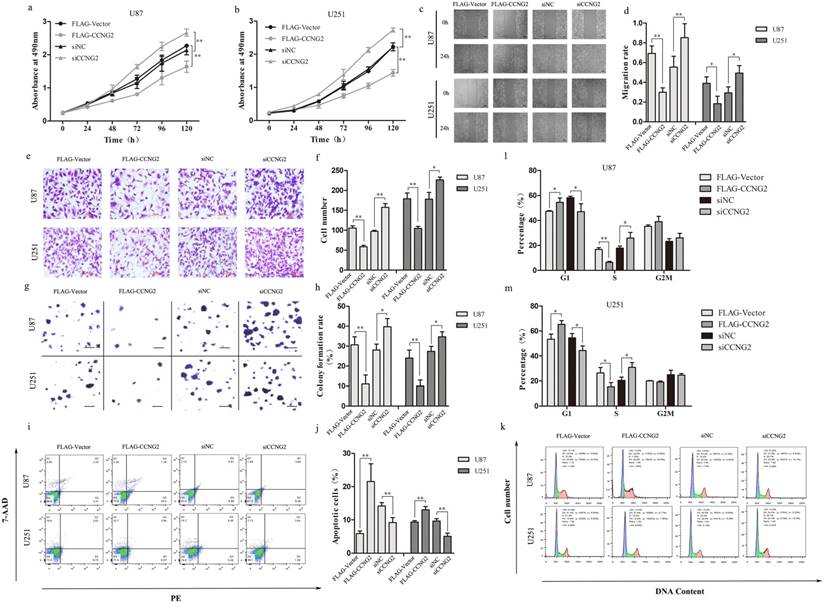
To investigate the effect of cyclin G2 on the tumorigenic potential of glioma cells, we performed colony formation assays. Cyclin G2-overexpressing cells produced fewer colonies that were of smaller size compared to control colonies (Figure 2g). In contrast, cells transfected with siCCNG2 had an increased number of colonies that were larger than those of the controls (Figure 2g). Statistically, exogenous expression of cyclin G2 resulted in a decrease in colony number while knockdown of cyclin G2 resulted in an increase in colony number compared to the control cells (Figure 2h). Furthermore, we analysed the cell cycle profile and measured the level of apoptosis in glioma cells following cyclin G2 overexpression or knockdown. Stable expression of cyclin G2 cells significantly arrested cells at the G1/S phase of the cell cycle (Figure 2k, 2l, 2m) and induced apoptosis (Figure 2i, 2j) whereas knockdown of cyclin G2 prevented cell cycle arrest (Figure 2k, 2l, 2m) and apoptosis (Figure 2i, 2j). Taken together, these results suggested that cyclin G2 functions as a tumour suppressor in glioma.
Cyclin G2 inhibits the Warburg effect in glioma cells
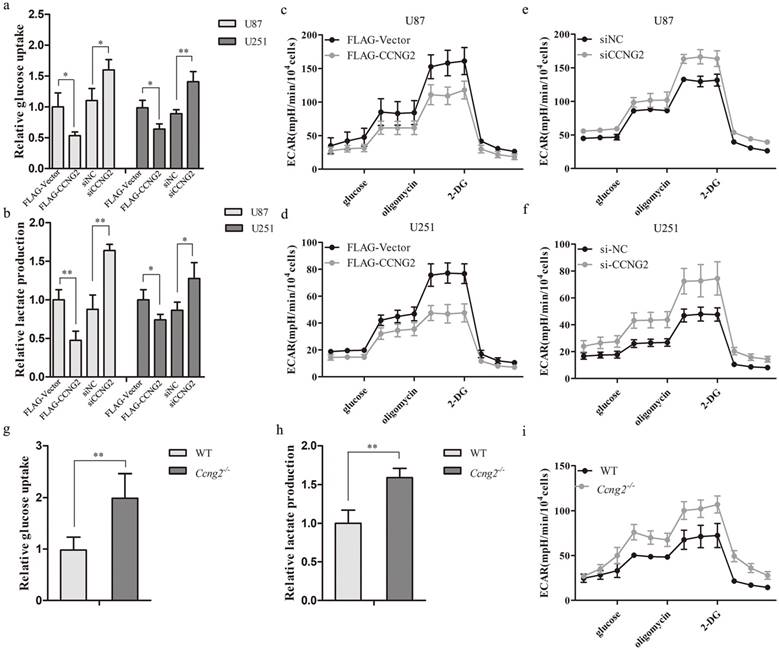
Highly malignant cells are known to obtain the majority of their energy through the metabolism of glucose to lactic acid even in the presence of oxygen rather than by oxidative phosphorylation [35]. GBMs have a strong glycolytic phenotype with an estimated 300% increase in glycolytic metabolism relative to normal brain [36]. To determine the effect of cyclin G2 on aerobic glycolysis in glioma cells, stable overexpression or RNAi-mediated knockdown of cyclin G2 was performed in U87 and U251 cells. Overexpression of cyclin G2 significantly decreased glucose consumption (Figure 3a) and lactate production (Figure 3b) compared to control cells. This metabolic change was accompanied by a decrease in ECAR (Figure 3c, 3d). In addition, knockdown of cyclin G2 in either U87 or U251 cells had the opposite effects on glucose uptake (Figure 3a), lactate production (Figure 3b) and ECAR (Figure 3e, 3f). To further confirm the regulation of aerobic glycolysis by cyclin G2, mouse embryonic fibroblasts (MEFs) were isolated from Ccng2-/- or wildtype embryos. We found that Ccng2-/- MEFs exhibited increased glucose consumption (Figure 3g) and lactate production (Figure 3h) compared to WT MEFs, which was accompanied by an increase in ECAR (Figure 3i). These results demonstrated that cyclin G2 inhibited the Warburg effect in glioma cells.
Effects of cyclin G2 on aerobic glycolysis in glioma cells and MEFs in vitro. a: Glucose uptake in cyclin G2-overexpressing and cyclin G2-knockdown U87 or U251 cells. b: Lactate concentrations in cyclin G2-overexpressing and cyclin G2-knockdown U87 or U251 cells. c-f: Extracellular acidification rates in cyclin G2-overexpressing and cyclin G2-knockdown U87 (c, e) or U251 (d, f) cells. g-i: Glucose uptake (g), lactate concentrations (h) and extracellular acidification rates (i) in WT and Ccng2-/- MEF cells. Data are presented as the mean ± S.D., *p < 0.05, **p < 0.01 versus vector.
Cyclin G2 directly interacts with LDHA
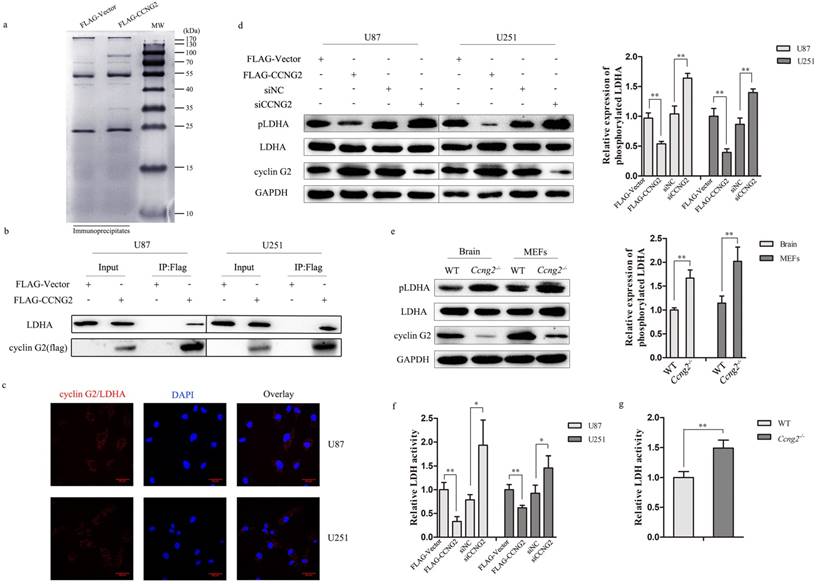
To determine the potential molecular mechanisms by which cyclin G2 regulates glioma cell properties, we used an anti-FLAG affinity gel to immunoprecipitate cyclin G2 complexes and identify potential protein partners for cyclin G2 in glioma cells. Proteins that were co-precipitated with FLAG-tagged cyclin G2 were separated by SDS-PAGE (Figure 4a) and identified by MS analysis. The results showed that LDHA was a potential partner for cyclin G2. LDHA is considered a major biomarker of glycolytic activity and executes the last step of anaerobic glycolysis, which is critical to the highly glycolytic phenotype [37, 38]. Apart from its critical role in glycolysis, LDHA also facilitates tumour progression, including glioma [39]. To verify an interaction between cyclin G2 and LDHA, cyclin G2 was overexpressed in U87 and U251 as previous described [40]. Co-immunoprecipitation confirmed that cyclin G2 formed a complex with LDHA (Figure 4b). The in situ proximity ligation assay (PLA) also demonstrated that a direct interaction between cyclin G2 and LDHA occurred in glioma cells (Figure 4c). Several transcription factors, including HIF1α, MYC, KLF4 and FOXM1, have been reported to regulate LDHA expression, which results in a shift towards the Warburg effect [17, 41, 42]. However, no significant reduction of LDHA protein was observed though we detected a bit reduction in mRNA level of LDHA (data not shown). Jin et al. reported that erb-b2 receptor tyrosine kinase 2 (HER2) and SRC proto-oncogene, non-receptor tyrosine kinase (Src) could phosphorylate LDHA at Y10, which enhanced LDHA enzyme activity and promoted the Warburg effect and tumour growth [43]. Therefore, we examined LDHA Y10 phosphorylation and LDH activity following cyclin G2 overexpression or knockdown in glioma cells. We found that phosphorylation of LDHA (Figure 4d) and LDH activity (Figure 4f) were decreased in cyclin G2 overexpressing cells. Conversely, LDHA Y10 phosphorylation (Figure 4d) and LDH activity (Figure 4f) increased upon cyclin G2 knockdown. Moreover, the correlation between cyclin G2 and p-LDHA expression was evaluated in Ccng2-/- mice. LDHA Y10 phosphorylation (Figure 4e) and LDH activity (Figure 4g) were increased in Ccng2-/- brains and MEFs compared to that of WT brains and MEFs. These data confirm that cyclin G2 correlated with the phosphorylation level of LDHA in vivo. Thus, cyclin G2 could directly interact with LDHA, leading to a decrease in LDHA Y10 phosphorylation and LDH activity.
Cyclin G2 directly interacts with LDHA. a: Cells expressing FLAG or FLAG-tagged cyclin G2 were lysed in lysis buffer and lysates were immunoprecipitated with anti-FLAG gel. Immunoprecipitates were recovered, separated by SDS-PAGE and visualized by Coomassie staining. b: U87 and U251 cells were transduced with FLAG-Vector or FLAG-CCNG2. The interaction between cyclin G2 and LDHA was analysed using co-immunoprecipitation followed by western blotting. IP, immunoprecipitation. c: Direct interaction of cyclin G2 and LDHA determined by in situ DuoLink PLA in U87 and U251 cells, scale bar = 50 μm. d: LDHA Y10 phosphorylation in cyclin G2-overexpressing and cyclin G2-knockdown U87 or U251 cells determined by western blotting. Right: quantification of protein expression (Tyr-10 phosphorylation of LDHA) normalised to GAPDH. e: LDHA Y10 phosphorylation in WT and Ccng2-/- mice brains and MEF cells. Right: quantification of protein expression (Tyr-10 phosphorylation of LDHA) normalised to GAPDH. f: LDH activity in cyclin G2-overexpressing or cyclin G2-knockdown U87 or U251 cells. g: LDH activity in WT and Ccng2-/- MEF cells. Data are presented as the mean ± S.D., *p < 0.05, ** p < 0.01 versus vector.
Cyclin G2 significantly inhibits tumour growth in mouse xenograft and orthotopic glioma models
Because cyclin G2 inhibited cell proliferation in vitro, U87 xenografts were used to validate the above results. Upregulation of cyclin G2 significantly suppressed U87 tumour growth compared to the vector control group (Figure 5a, 5b, 5c). Consistent with the in vitro results, cyclin G2 overexpression increased the number of apoptotic cells and decreased the levels of p-LDHA and Ki67, a marker of proliferation (Figure 5d).
Cyclin G2 inhibits tumour growth in mouse xenograft and orthotopic glioma models. a-c: U87 cells transduced with FLAG-Vector or FLAG-CCNG2 (2 × 10⁶) were injected subcutaneously into the right or left forelimb of five nude mice, respectively. Gross tumours (a) (scale bar = 1 cm), tumour growth curves (b) and weights (c) are shown. d: Ki67, pLDHA expression and Apoptosis determined by immunohistochemistry and TUNEL assay, scale bar = 500 μm. e-g: GL261 cells (3 × 10⁶/mouse) were intracranially injected into WT and Ccng2-/- mice. After euthanasia, tumours were sectioned coronally and measured for volume (g). Histopathological examination of the brains from WT and Ccng2-/- glioblastoma-bearing mice (e), scale bar = 200 μm. Kaplan-Meier survival curves (f). h-i: Lactate production and LDH activity in WT and Ccng2-/- mouse serum. Data are presented as the mean ± S.D., *p < 0.05, **p < 0.01 versus vector.
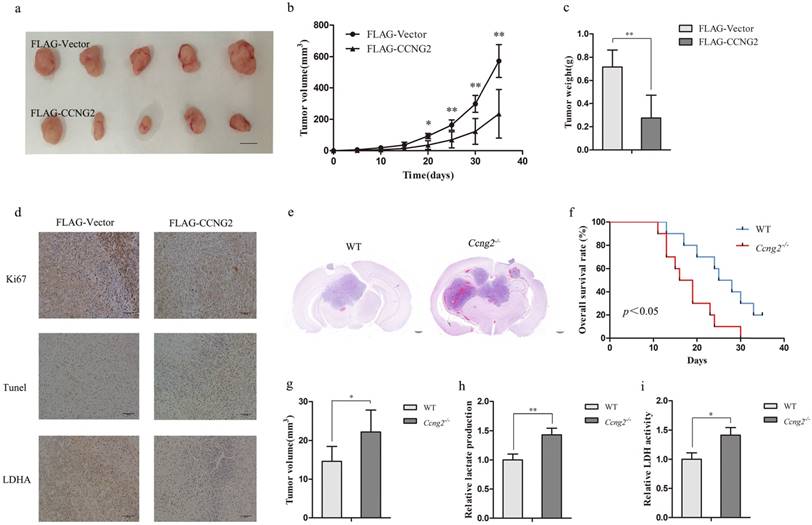
In addition, we performed intracranial implantation of GL261 cells in Ccng2-/- and WT mice. Haematoxylin and eosin staining of intracranial tumour sections showed that Ccng2-/- mice developed larger tumours than control mice (Figure 5e, 5g) and exhibited lower overall survival rate (Figure 5f). These results suggested that cyclin G2 knockout might accelerate intracranial acidification due to increased LDHA activity and lactate levels. As a result, the acidified microenvironment could promote cancer cell proliferation and tumour development. Indeed, we found that serum lactate concentrations and LDH activity were higher in Ccng2-/- mice than control mice (Figure 5h, 5i). Therefore, cyclin G2 appeared to suppress tumour progression by reversing the Warburg effect in vivo.
Discussion
Cyclin G2 has been identified as a tumour suppressor in several cancers and might represent a prognostic biomarker [28-32]. In this study, we demonstrated that cyclin G2 was downregulated in gliomas compared to normal brain tissue. In addition, the expression of cyclin G2 was inversely associated with the malignant grade of glioma. In particular, low cyclin G2 expression levels were a poor prognostic factor in glioma. Moreover, overexpression of cyclin G2 in glioma cells exhibited obvious tumour suppressive effects both in vitro and in vivo. Thus, these findings suggest that cyclin G2 is a tumour suppressor in glioma.
Otto Warburg first observed an anomalous characteristic of cancer cell energy metabolism. Namely, even in the presence of oxygen, cancer cells could reprogram their glucose metabolism and, thus, their energy production by limiting their energy metabolism largely to aerobic glycolysis [10, 44]. LDHA is an enzyme that catalyses the conversion of pyruvate and nicotinamide adenine dinucleotide (NADH) to lactate and NAD+ and plays a key role in regulating glycolysis. Several transcription factors, including hypoxia inducible factor 1 subunit alpha (HIF1α), Kruppel like factor 4 (KLF4) and forkhead box M1 (FOXM1), have been reported to regulate LDHA expression, which results in a shift towards the Warburg effect [17, 41, 42]. LDHA is overexpressed in cancer cells, and silencing of LDHA typically results in increased apoptosis, decreased proliferation, and strong inhibition of tumorigenicity [20, 45-47].
GBM, like most cancers, utilize aerobic glycolysis as the primary supplier of ATP [11, 48]. Although several therapies are currently in use, including small-molecule kinase inhibitors, anti-vascular endothelial growth factor monoclonal antibodies, immune checkpoint inhibitors, epigenetic modulators, and transfer of lethal genes into tumour cells, glioblastoma treatment is still the most challenging task in clinical oncology. One potential target for glioma therapy is to attenuate aerobic glycolysis [49]. Thus, reversing the Warburg effect as a treatment for glioma is a promising approach and promotes us to investigate the role of cyclin G2 in glioma. Although cyclin G2 is downregulated in the development of glioma, the underlying mechanism needs to be illuminated [50].
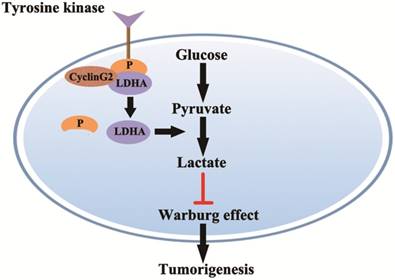
In this study, we showed that cyclin G2 significantly inhibited aerobic glycolysis in glioma cells. Furthermore, we found that cyclin G2 overexpression decreased LDHA activity through direct interaction with LDHA. However, it is still unclear how cyclin G2 reduces LDHA activity. Fan et al. showed that phosphorylation of LDHA Y10 enhances LDHA activity by enhancing the formation of active, tetrameric LDHA, which is common in diverse human cancers. The findings suggested that tyrosine phosphorylation enhanced LDHA enzyme activity to promote the Warburg effect and tumour growth by regulating NADH/NAD+ redox homeostasis, which could account for the enhanced lactate production in cancer cells [24, 43]. Indeed, we found that overexpression of cyclin G2 decreased LDHA Y10 phosphorylation and knockdown of cyclin G2 increased phosphorylation in two independent glioma cell lines. Thus, we identified a novel function for cyclin G2 in the regulation of glioma metabolism. Cyclin G2 expression plays an important role in controlling glioma progression by regulating proliferation and the Warburg effect via its interaction with LDHA, which results in the inhibition of Y10 phosphorylation. Our key findings described here are summarized in a model presented in (Figure 6). Although the mechanism behind the regulation of Y10 phosphorylation of LDHA by cyclin G2 is not clear and requires further study, the continual downregulation of cyclin G2 expression in human glioma cells features its possibility as a promising biomarker for diagnosis of glioma.
Model for cyclin G2 inhibiting the Warburg effect by suppressing LDHA phosphorylation resulting reduced tumorigenesis. Cyclin G2 directly interacts with LDHA and inhibits LDHA phosphorylation. LDHA dephosphorylation inhibits the Warburg effect, thereby inhibiting tumorigenesis.
Conclusion
In conclusion, we demonstrated that cyclin G2 inhibits both aerobic glycolysis and tumour growth by decreasing LDHA activity in glioma. To our knowledge, this is the first report that cyclin G2 downregulates LDHA activity in human glioma cells, thereby suppressing the Warburg effect and preventing tumorigenesis.
Abbreviations
OXPHOS: oxidative phosphorylation; LDH: lactate dehydrogenase; WHO: World Health Organization; DMEM: Dulbecco's modified Eagle's medium; FBS: fetal bovine serum; MEF: mouse embryonic fibroblasts; qRT-PCR: quantitative reverse transcription PCR; IP: immunoprecipitation; IHC: Immunohistochemistry; IOD: integral optical density; MTS: 3-(4,5-dimethylthiazol-2-yl)-5-(3-carboxymethoxyphenyl)-2-(4-sulfophenyl)-2H-tetrazolium; ECAR: extracellular acidification rate; PLA: proximity ligation assay; FGFR1: fibroblast growth factor receptor 1; JAK2: Janus kinase 2; BCR/ABL: breakpoint cluster region/ABL proto-oncogene 1, non-receptor tyrosine kinase; FLT3-ITD: fms related tyrosine kinase 3- internal tandem duplication; HIF1α: hypoxia inducible factor 1 subunit alpha; KLF4: Kruppel like factor 4; FOXM1: forkhead box M1;ATP: adenosine triphosphate; HER2: erb-b2 receptor tyrosine kinase 2; SRC: SRC proto-oncogene, non-receptor tyrosine kinase; NADH: nicotinamide adenine dinucleotide.
Acknowledgements
This work was supported by Foundation of the Education Department of Liaoning Province (LZDK201703) and National Natural Science Foundation of China (No. 81601874 and No.81502176).
Author's contributions
Sen Li performed all molecular biology experiments. Jinlan Gao, Xinbin Zhuang and Chenyang Zhao performed animal experiments. Shuang Liu performed the statistical analysis. Xiaoyu Hou, Xuesha Xing, Chen Chen, Qi Liu helped to prepare reagents. Sen Li and Yang Luo designed the experiments and wrote the manuscript.
Ethics Committee Approval
All animal experiments were performed in accordance with the China Medical University Animal Ethics Committee guidelines and approved by China Medical University Animal Ethics Committee.
Competing Interests
The authors have declared that no competing interest exists.
References
1. Reifenberger Guido, Wirsching Hans-Georg, Knobbe-Thomsen Christiane B. et al. Advances in the molecular genetics of gliomas - implications for classification and therapy. Nat Rev Clin Oncol. 2017;14:434-452
2. Louis David N, Ohgaki Hiroko, Wiestler Otmar D. et al. The 2007 WHO classification of tumours of the central nervous system. Acta Neuropathol. 2007;114:97-109
3. Jin Xun, Kim LJY, Wu Qiulian. et al. Targeting glioma stem cells through combined BMI1 and EZH2 inhibition. Nat Med. 2017;23:1352-1361
4. Chen Jian, McKay RM, Parada LF. Malignant glioma: lessons from genomics, mouse models, and stem cells. Cell. 2012;149:36-47
5. Zhang Li, Yang Huicui, Zhang Wenbin. et al. Clk1-regulated aerobic glycolysis is involved in glioma chemoresistance. J Neurochem. 2017;142:574-588
6. Stupp Roger, Hegi Monika E, Mason Warren P. et al. Effects of radiotherapy with concomitant and adjuvant temozolomide versus radiotherapy alone on survival in glioblastoma in a randomised phase III study: 5-year analysis of the EORTC-NCIC trial. Lancet Oncol. 2009;10:459-66
7. Omuro Antonio, DeAngelis Lisa M. Glioblastoma and other malignant gliomas: a clinical review. JAMA. 2013;310:1842-50
8. Stupp Roger, Mason WP, van den Bent. et al. Radiotherapy plus Concomitant and Adjuvant Temozolomide for Glioblastoma. N Engl J Med. 2005;352:987-996
9. Porporato Paolo E, Payen Vale´ry, Pérez-Escuredo J. et al. A mitochondrial switch promotes tumor metastasis. Cell Rep. 2014;8:754-66
10. Otto Warburg. On the origin of cancer cells. Science. 1956;123:309-14
11. Poteet Ethan, Choudhury Gourav Roy, Winters Ali. et al. Reversing the Warburg Effect as a Treatment for Glioblastoma. J Biol Chem. 2013;288:9153-9164
12. Koukourakis MI, Giatromanolaki A, Sivridis E. et al. Lactate dehydrogenase-5 (LDH-5) overexpression in non-small-cell lung cancer tissues is linked to tumour hypoxia, angiogenic factor production and poor prognosis. Br J Cancer. 2003;89:877-85
13. Chesnelong Charles, Chaumeil Myriam M, Blough Michael D. et al. Lactate dehydrogenase A silencing in IDH mutant gliomas. Neuro Oncol. 2014;16:686-95
14. Stefan Walenta. and Wolfgang F. Mueller-Klieser. Lactate: mirror and motor of tumor malignancy. Semin Radiat Oncol. 2004;14:267-74
15. Baumgart Eveline, Fahimi HD, Stich Andrea. et al. L-Lactate Dehydrogenase A4- and A3B Isoforms Are Bona Fide Peroxisomal Enzymes in Rat Liver. J Biol Chem. 1996;271:3846-55
16. Goldman Robert D, Kaplan Nathan O, Hall Thomas C. Lactic Dehydrogenase in Human Neoplastic Tissues. Cancer Res. 1964;24:389-99
17. Shi Min, Cui Jiujie, Du Jiawei. et al. A novel KLF4/LDHA signaling pathway regulates aerobic glycolysis in and progression of pancreatic cancer. Clin Cancer Res. 2014;20:4370-80
18. Zhao YH, Zhou M, Liu H. et al. Upregulation of lactate dehydrogenase A by ErbB2 through heat shock factor 1 promotes breast cancer cell glycolysis and growth. Oncogene. 2009;28:3689-701
19. Liu Xiaojun, Yang Zhongxia, Chen Zhaofeng. et al. Effects of the suppression of lactate dehydrogenase A on the growth and invasion of human gastric cancer cells. Oncol Rep. 2015;33:157-62
20. Sheng Shi L, Liu Jian J, Dai Yun H. et al. Knockdown of lactate dehydrogenase A suppresses tumor growth and metastasis of human hepatocellular carcinoma. FEBS J. 2012;279:3898-910
21. Kallalli Basavaraj N, Rawson Kamala, Muzammil. et al. Lactate dehydrogenase as a biomarker in oral cancer and oral submucous fibrosis. J Oral Pathol Med. 2016;45:687-690
22. Koukourakis Michael I, Giatromanolaki Alexandra, Sivridis Efthimios. et al. Prognostic and predictive role of lactate dehydrogenase 5 expression in colorectal cancer patients treated with PTK787/ZK 222584(vatalanib) antiangiogenic therapy. Clin Cancer Res. 2011;17:4892-900
23. Xintaropoulou Chrysi, Ward Carol, Wise Alan. et al. Expression of glycolytic enzymes in ovarian cancers and evaluation of the glycolytic pathway as a strategy for ovarian cancer treatment. BMC Cancer. 2018;18:636
24. Fan Jun, Hitosugi Taro, Chung Tae-Wook. et al. Tyrosine phosphorylation of lactate dehydrogenase A is important for NADH/NAD(+) redox homeostasis in cancer cells. Mol Cell Biol. 2011;31:4938-50
25. Svendsen Angela M, Winge Sofia B, Zimmermann Maike. et al. Down-regulation of cyclin G2 by insulin, IGF-I (insulin-like growth factor 1) and X10 (AspB10 insulin): role in mitogenesis. Biochem J. 2014;457:69-77
26. Li XiuJuan, Ren Zhaojun, Tang Jinhai. et al. Exosomal MicroRNA MiR-1246 Promotes Cell Proliferation, Invasion and Drug Resistance by Targeting CCNG2 in Breast Cancer. Cell Physiol Biochem. 2017;44:1741-1748
27. Liu Jie, Cui Zeshi, Luo Yang. et al. Effect of cyclin G2 on proliferative ability of SGC-7901 cell. World J Gastroenterol. 2004;10:1357-1360
28. Bernaudo S, Salem M, Qi X. et al. Cyclin G2 inhibits epithelial-to-mesenchymal transition by disrupting Wnt/beta-catenin signaling. Oncogene. 2016;35:4816-27
29. Ito Y, Yoshida H, Uruno T. et al. Decreased expression of cyclin G2 is significantly linked to the malignant transformation of papillary carcinoma of the thyroid. Anticancer Res. 2003;23:2335-8
30. Hasegawa Shinichiro, Nagano Hiroaki, Konno Masamitsu. et al. Cyclin G2: A novel independent prognostic marker in pancreatic cancer. Oncol Lett. 2015;10:2986-2990
31. Kim Yong, Shintani Satoru, Kohno Yohko. et al. Cyclin G2 Dysregulation in Human Oral Cancer. Cancer Res. 2004;64:8980-6
32. Horne M, Zimmermann M, Don AA. et al. Cyclin G2 Contributes to the Cell Cycle Arrest Response of Breast Cancer Cells to Estrogen Signaling Antagonists and the AMPK Agonist, Metformin. Faseb Journal. 2015;29:576.10
33. Liu Qi, Liu Xing, Gao Jinlan. et al. Overexpression of DOC-1R inhibits cell cycle G1/S transition by repressing CDK2 expression and activation. Int J Biol Sci. 2013;9:541-9
34. Kanamori Masayuki, Kawaguchi Tomohiro, Berger Mitchel S. et al. Intracranial Microenvironment Reveals Independent Opposing Functions of Host αVβ3 Expression on Glioma Growth and Angiogenesis. J Biol Chem. 2006;281:37256-64
35. Michelakis ED, Sutendra G, Dromparis P. et al. Metabolic Modulation of Glioblastoma with Dichloroacetate. Sci Transl Med. 2010;2:31ra34
36. Oudard S, Arvelo F, Miccoli L. et al. High glycolysis in gliomas despite low hexokinase transcription and activity correlated to chromosome 10 loss. Br J Cancer. 1996;74:839-845
37. Jeong Sangmoo, Eskandari Roozbeh, Park Sun Mi. et al. Real-time quantitative analysis of metabolic flux in live cells using a hyperpolarized micromagnetic resonance spectrometer. Sci Adv. 2017;3:e1700341
38. Ooi Aik T, Gomperts Brigitte N. Molecular Pathways: Targeting Cellular Energy Metabolism in Cancer via Inhibition of SLC2A1 and LDHA. Clin Cancer Res. 2015;21:2440-4
39. Di Hui, Zhang Xinting, Guo Yi. et al. Silencing LDHA inhibits proliferation, induces apoptosis and increases chemosensitivity to temozolomide in glioma cells. Oncol Lett. 2018;15:5131-5136
40. Liu Q Gao J, Liu X, Ji C, Qu S, Wang S, Luo Y. Cyclin G2 suppresses estrogen-mediated osteogenesis through inhibition of Wnt/beta-catenin signaling. PLoS One. 2014;9:e89884
41. Shim Hyunsuk, Dolde Christine, Lewis Brian C. et al. c-Myc transactivation of LDH-A: Implications for tumor metabolism and growth. Proc Natl Acad Sci U S A. 1997;94:6658-6663
42. Cui Jiujie, Shi Min, Xie Dacheng. et al. FOXM1 promotes the warburg effect and pancreatic cancer progression via transactivation of LDHA expression. Clin Cancer Res. 2014;20:2595-606
43. Jin L, Chun J, Pan C. et al. Phosphorylation-mediated activation of LDHA promotes cancer cell invasion and tumour metastasis. Oncogene. 2017;36:3797-3806
44. Feng Yanling, Liu Jingwei, Guo Wendong. et al. Atg7 inhibits Warburg effect by suppressing PKM2 phosphorylation resulting reduced epithelial-mesenchymal transition. Int J Biol Sci. 2018;14:775-783
45. Fantin Valeria R, St-Pierre Julie, Leder Philip. Attenuation of LDH-A expression uncovers a link between glycolysis, mitochondrial physiology, and tumor maintenance. Cancer Cell. 2006;9:425-34
46. Le Anne, Cooper Charles R, Gouw Arvin M. et al. Inhibition of lactate dehydrogenase A induces oxidative stress and inhibits tumor progression. Proc Natl Acad Sci U S A. 2010;107:2037-42
47. Xie Han, Valera Vladimir A, Merino Maria J. et al. LDH-A inhibition, a therapeutic strategy for treatment of hereditary leiomyomatosis and renal cell cancer. Mol Cancer Ther. 2009;8:626-35
48. Vander Heiden MG, Cantley Lewis C, Thompson Craig B. Understanding the Warburg effect: the metabolic requirements of cell proliferation. Science. 2009;324:1029-33
49. Sena Isadora FG, Paiva Ana E, Prazeres Pedro HDM. et al. Glioblastoma-activated pericytes support tumor growth via immunosuppression. Cancer Med. 2018;7:1232-1239
50. Zhang Danfeng, Wang Chunhui, Li Zhenxing. et al. CCNG2 Overexpression Mediated by AKT Inhibits Tumor Cell Proliferation in Human Astrocytoma Cells. Front Neurol. 2018;9:255
Author contact
![]() Corresponding author: yluoedu.cn
Corresponding author: yluoedu.cn