Impact Factor ISSN: 1449-2288
- Issue 12; 2026
- Issue 11; 2026
- Issue 10; 2026
- Issue 9; 2026
- Issue 8; 2026
- Volume 22; 2026
- Past Issues
- Advance Articles
- Editorial Board
- Cover Images
- Index & Coverage
- Cover Suggestion
- Special Issues
Introduction
Materials and Methods
Results
Discussion
Supplementary Material
Acknowledgements
References

 Global reach, higher impact
Int J Biol Sci 2019; 15(7):1404-1418. doi:10.7150/ijbs.35073 This issue Cite
Research Paper
The landscape of DNA methylation associated with the transcriptomic network in layers and broilers generates insight into embryonic muscle development in chicken
Zihao Liu*, Shunshun Han*, Xiaoxu Shen*, Yan Wang*, Can Cui, Haorong He, Yuqi Chen, Jing Zhao, Diyan Li, Qing Zhu, Huadong Yin ![]()
Farm Animal Genetic Resources Exploration and Innovation Key Laboratory of Sichuan Province, Sichuan Agricultural University, Chengdu, Sichuan 611130, PR China
* These authors contributed equally to this work.
Received 2019-3-20; Accepted 2019-4-26; Published 2019-6-2
Abstract

Scope: As DNA methylation is one of the key epigenetic mechanisms involved in embryonic muscle development, elucidating its relationship with non-coding RNAs and genes is essential for understanding early muscle development. The methylome profiles of pre-hatching chicken across multiple developmental stages remain incomplete although several related studies have been reported.
Methods: In this study, we performed single-base-resolution bisulfite sequencing together with RNA-seq of broilers and layers in different embryonic development points (E10, E13, E16 and E19) to explore the genetic basis of embryonic muscle development in chicken. The differential methylated regions and novel lncRNAs were identified for association analyses. Through genomic position and correlation analysis between DMRs and lncRNAs, the target lncRNAs were detected to participate in the embryonic muscle formation and the results were then verified in vitro experiments.
Results: Comparison of methylome profiles between two chicken lines revealed that lower methylation in broilers might contribute to muscle development in embryonic period. Differential methylated region analysis showed that the majority of differential methylated regions were hypo-DMRs for broilers. Differential methylated genes were significantly enriched in muscle development-related terms at E13 and E19. Furthermore, we identified a long non-coding RNA MyH1-AS that potentially regulated embryonic muscle development, proved by the regulatory network construction and further in vitro experiments.
Conclusion: Our study revealed an integrative landscape of middle- to late-stage of embryonic myogenesis in chicken, gave rise to a comprehensive understanding of epigenetic and transcriptional regulation in muscle development. Moreover, we provided a reliable data resource for further embryonic muscle development studies.
Keywords: DNA methylation, transcriptome, chicken, muscle development, embryonic
Introduction
Epigenetic mechanisms, including DNA methylation, histone modification, non-coding RNAs and chromatin remodeling, have been the subject of intense research over recent years because of their essential roles in various biological processes [1, 2]. These epigenetic mechanisms were reported to be involved in human diseases [3], oogenesis and spermatogenesis [4], as well as in adipose and muscle development [5-7]. DNA methylation is an epigenetic mechanism that exerts considerable influence on the regulation of gene expression without changing the DNA sequence [8]. A role for DNA methylation in muscle development has been illustrated in human [9], pig [5, 6], rabbit [10], bovine [11] and chicken [12].
Skeletal muscle is composed of myofibers, the total number of which remains unchanged after birth, therefore, the embryonic stage is critical for muscle development [13]. Robert at al. identified more than 170 CpG islands specifically hypermethylated in muscle tissue, revealing the skeletal muscle the highest percentage of methylated CpG islands (8.3%).[14]. Carrio et al. built the methylome of myogenic stem cells and demonstrated the importance of DNA methylation-mediated regulation of the cell-identity Myf5 super-enhancer during muscle-stem cell differentiation [15]. Besides, long noncoding RNAs have also been proven to be important in the regulation of muscle development. For instance, linc-MD1 interacts with miR-133 and miR-135 to regulate the expression of transcription factors MAML1 and MEF2C that activate muscle-specific gene expression [7]. The imprinted lncRNA H19 was reported to act as a natural sponge for the miRNA let-7 to participate muscle regulation [16]. LncRNA LINC00961 encodes SPAR polypeptide to regulate muscle regeneration [17]. Recently, the regulatory relationship between DNA methylation and lncRNAs has drawn extensive research attentions. Di Ruscio at el. reported that a class of non-polyadenylated RNAs can regulate DNA methylation at a locus-specific pattern through interacting with DNMT1 [18]. The lncRNA H19 was found to alter genome-wide DNA methylation by regulating S-adenosylhomocysteine hydrolase [19]. A database of methylation and lncRNAs regulatory relationships has been built for human diseases studies [20]. However, studies on the role for this regulatory relationship in muscle development are still deficient.
Chicken is an ideal model for muscle studies at embryonic stages as the accessibility of the egg. Several genome-wide methylation studies were reported in chicken, and a relationship between DNA methylation level of gene promoters and expression level of genes were identified [21-23]. Furthermore, the global methylation landscape of muscle development was described in chicken using juvenile and later laying-period hens [12]. However, the role for DNA methylation in chicken embryonic muscle development has not been fully clarified. During the prenatal stage, myofiber ontogenesis of the poultry begins with the two successive waves of myoblasts development and a primary and a secondary generation of fibers arise respectively during the embryonic and foetal stages of development, and the number of secondary fibers would be more under epigenetic control [24], therefore, this study focused on the secondary wave of embryonic muscle development. As this wave is mainly between 8 and 16 days before hatching (E8-E16) [25], here we sampled chicken breast muscle at embryonic days 10, 13, 16 and 19 (E10, E13, E16 and E19) and used whole genome bisulfite sequencing (WGBS) to determine the methylomes of 12 standardized broilers and 12 standardized layers. We also sequenced the whole transcriptome of these 24 samples by RNA-seq simultaneously for integrative analyses, in order to explore the effect of DNA methylation and lncRNA relationship on muscle development.
Materials and Methods
Ethics approval
All experimental operations were approved by the Animal Ethics Committee of Sichuan Agricultural University, and the approved number was 2018-177. Relevant guidelines and regulations were followed while performing all the methods.
Sample collection
The fertilized eggs of Ross 308 and White Leghorns were incubated in the same condition. The breast muscle and blood were collected at E10, E13, E16 and E19. After sex determination by PCR, only samples identified as male were kept for next experiments. A total of 24 embryonic chickens were used in the study to form 8 groups: E10, E13, E16, E19 for Ross 308 and White Leghorns, respectively. Each group included 3 individuals as biological replicates.
DNA and RNA extraction
Genomic DNA was extracted using an animal genomic DNA kit (Tiangen, Beijing, China) following the manufacturer's instructions. The DNA integrity and concentration were measured by agarose gel electrophoresis and NanoDrop spectrophotometer, respectively. Total RNA was isolated using TRIzol (TAKARA, Dalian, China) reagent according to the manufacturers' instruction. RNA was reverse transcribed by TAKARA PrimeScriptTM RT reagent kit (TAKARA) according to the manufacturers' instruction.
Library construction and sequencing
Bisulfite sequencing libraries were prepared using the TruSeq Nano DNA LT kit (Illumina, San Diego, CA, USA). The genomic DNAs were then fragmented into 100-300 bp by sonication (Covaris, Woburn, MA, USA) and purified using a MiniElute PCR Purification Kit (Qiagen, Redwood City, CA, USA). The fragmented DNAs were end repaired and a single 'A' nucleotide was appended to the 3′ end of each fragment. After ligating the DNAs to the sequencing adapters, the genomic fragments were bisulfite converted via a Methylation-Gold kit (ZYMO, Irvine, CA, USA). The converted DNA fragments were PCR amplified and sequenced as paired-end reads using the Illunima HiSeq xten platform by the Biomarker Technologies company (Beijing, China).
Data alignment and process
The raw data in the FastQ format generated by the Illumina HiSeq were pre-processed by removing reads containing adapters, N (unknown bases) > 10%, and those which over 50% of the sequence exhibited low quality value (Qphred score ≤ 10). We also calculated the Q20, Q30, CG content for each sample data. The reads remained after this procedure were clean reads and used for subsequent analysis. The methylation data were aligned to chicken reference genome Gallus gallus 5.0 by Bismark software [26]. Meanwhile, the numbers of aligned clean reads in unique position of reference genome were calculated as unique mapped reads number. The proportion of the number of aligned reads in the total number of reads was calculated as the mapping rate. Subsequently, the methylation level of single base was then calculated by the ratio of the number of methylated reads to the sum of total reads covering the locus. Finally, we used a binominal distribution teat approach to determine whether a locus was regarded as methylated locus with the criteria: coverage depth > 4 and FDR < 0.05[26].
The transcriptional libraries were sequenced on an Illumina HiSeq xten platform at the Biomarker Technologies Company. The obtained transcriptome data were filtered by removing sequences containing adaptors, low-quality reads (q-value < 20), and reads containing more than 10% of unknown nucleotides (N) and then were aligned to reference genome Gallus gallus 5.0 by HISAT2 [27]. Next, the transcript assembly and FPKM calculation were performed using the StringTie [28]. Transcripts mapped to the known genes on the reference were used for the subsequent differential expression gene calling.
LncRNA identification
In order to identify the potential lncRNAs, the assembled transcripts generated from the StringTie were processed with the CPC [29], CNCI [30], CPAT [31], and pfam [32] software with defeat parameters to predict the potential lncRNAs. Only transcripts predicted as lncRNA and shared among the 4 tools were regarded as the candidate lncRNAs. Then the cis-target genes of lncRNA were defined as neighbor genes in 100 kb genomic distance from the lncRNA, and were identified using in-house script. The trans-target prediction of lncRNAs was performed by LncTar software [33].
DMRs calling
The differential methylation locus (DMLs) and differential methylation regions (DMRs) between broilers and layers at each comparison were detected separately using Dispersion Shrinkage for Sequencing Data (DSS) package in R [34-37]. The methylation levels of DMRs were then calculated in with default parameters. Subsequently, DMRs were annotated to the chicken genome using ChIPseeker package in R [38].
Gene with overlapped with at least one DMR is defined as differential methylation gene (DMG). Common DMRs among 4 developmental stages were identified by merging all DMRs positions in 24 samples and re-calculating the methylation levels using merged DMR position.
DEGs and DELs calling
The differential expression genes (DEGs) calling and the differential expression lncRNAs (DELs) calling between two chicken lines at each time point were performed separately using the DEseq [39]. The results were filtering with the criteria: (1) fold change >2 and (2) FDR<0.5. The transcripts satisfied both standards were regarded as DEGs or DELs.
Functional enrichment analysis and WGCNA analysis
Gene ontology enrichment (GO) analyses were conducted for DMGs at E10, E13, E16 and E19 comparisons respectively to explore their potential roles in muscle development. These analyses were performed by clusterProfiler package implemented in R [40]. A hypergeometric test was applied to map DMGs to terms in the GO database to search for significantly enriched terms in DMGs compared to the genome background.
The WGCNA analysis was performed using WGCNA package in R [41]. We used all the differential expression lncRNAs and all the genes as input. Then, variable coefficient was used to filter transcripts with low expression change. The variable coefficient was calculated as: Cv =σ/μ. The σ is the standard deviation and μ represents the mean value of expression of input transcripts. Only transcripts with ranked top 30% high Cv value were used for WGCNA analysis. After the entire network was constructed, only genes with connectivity more than 0.15 were selected for subsequent subnetwork analysis.
Validation for RNA-seq by quantitative Real-time RCP
Total RNA was purified and reversely transcribed into cDNA using PrimerScriptR RT reagent Kit with gDNA Eraser (Takara, Dalian, China) following the specification. Quantities of mRNA were then measured with qPCR using a CFX96TM real-time PCR detection system (Bio-Rad, Hercules, CA, USA). The qPCR assays were then performed with a volume of 20 μL containing 10 μL SYBR Green Mixture, 7 μL deionized water, 1 μL template of cDNA, 1 μL of each primer and with following thermal conditions: 95 °C for 5 min, 45 cycles of 95 °C for 10 sec, 60 °C for 10 sec, 72 °C for 10 sec. Primer sequences used for qPCR assays are displayed in Supplementary Table 18. The β-actin gene was used as internal control. Each qPCR assay was carried out in triplicate. The relative gene expression was calculated using the 2-ΔΔCt method.
Cell cultures
The pectoralis muscle was collected from the two chicken lines and used for preparation of primary myogenic cultures. About 5 g of muscle was finely minced and treated with 0.1% collagenase I (Sigma Chemical, St. Louis, MO, USA) followed by 0.25% trypsin (Hyclone, Logan, UT, USA) to release chicken muscle satellite cells. Then, the cell suspension was subjected to Percoll density centrifugation to separate myoblasts from contaminating myofibril debris and non-myogenic cells. Cells were plated in 25 cm3 cell culture bottles with complete medium [DMEM/F12 (Invitrogen, Carlsbad, CA, USA) +15% FBS (Gibco, Grand Island, NY, USA) +10% horse serum (Hyclone) +1% penicillin-streptomycin (Solarbio, Beijing, China) +3% chicken embryo extraction]. The cells cultured at 37 °C and 5% CO2 with saturating humidity, which were allowed to proliferate in growth medium for 2-4 d, and the medium was refresh every 24 h. To induce differentiation, satellite cells were grown to 80% confluence in growth medium, and the replaced with differentiation medium composed of DMEM, 2% horse serum and 1% penicillin-streptomycin, and the medium was refreshed every 24 h.
LncRNA silencing
Chicken satellite cells were cultivated in 6-well plates and transfected with siRNAs: 5'-GGAAGGGAGUAGGUGGUAATT-3' and 5'-UUACCACCUACUCCCUUCCTT -3'; (Sangon Biotech, Shanghai, China) when grown to a density of approximate 70% in plates. In contrast, control cells were transfected with negative siRNA with same other condition. The transfection reagent was Lipofectamine 3000 (Invitrogen). The knockdown efficiency was assessed by quantitative qPCR of lncRNA MyH1-AS.
Microscopy
Cellular morphology was evaluated in differentiated myotubes by phase-contrast microscopy without preliminary fixation. Pictures were produced using the Olympus IX73 inverted microscope (OLYMPUS, Tokyo, Japan) and the Hamamatsu C11440 digital camera (HAMAMATSU, Shizuoka, Japan).
Western blot assay
The cells were collected from the cultures, placed in the RIPA lysis buffer on ice (BestBio, Shanghai, China). The whole proteins were subjected to 10% sodium dodecyl sulfate polyacrylamide gel electrophoresis (SDS-PAGE) and then transferred to polyvinylidene fluoride membranes (PVDF; Millipore Corporation, Billerica, MA, USA). The PVDF membrane was incubated with 5% defatted milk powder at room temperature for 1 h, then incubation with the following specific primary antibodies at 4℃ overnight: anti-MyoG (Abcam, Cambridge, MA, USA), anti-MyHC (Abcam) and anti-β-Actin (Abcam). The secondary antibodies HRP-labeled rabbit IgG (Cell Signaling, Danvers, MA, USA) were added at room temperature for 1h. Following each step, the membranes were washed 5 times with PBS-T for 3 min. The proteins were visualized by enhanced chemiluminescence (Amersham Pharmacia Biotech, Piscataway, NJ, USA) with a Kodak imager (Eastman Kodak, Rochester, NY, USA). Quantification of protein blots was performed using the Quantity One 1-D software (version 4.4.0) (Bio-Rad, Hercules, CA, USA) on images acquired from an EU-88 image scanner (GE Healthcare, King of Prussia, PA, USA).
Results
Overview of DNA methylation
In the genomic methylation data among 24 samples (12 broilers and 12 layers), the average sequence depth is about 30.3×. Approximately 3.4 billion reads were generated by the Illumina HiSeq in total and an average of 71.99% clean reads were mapped to the Gallus gallus genome (version 5.0) (Supplementary Table S1). The coverage analysis revealed that approximately 82% of the Gallus gallus genome was covered by reads at least 1-fold, whereas nearly 78% of genome was covered by more than 5-fold and 75% of genome was covered more than 10-fold (Supplementary Table S2). These results indicated a reliable sequencing outcome.
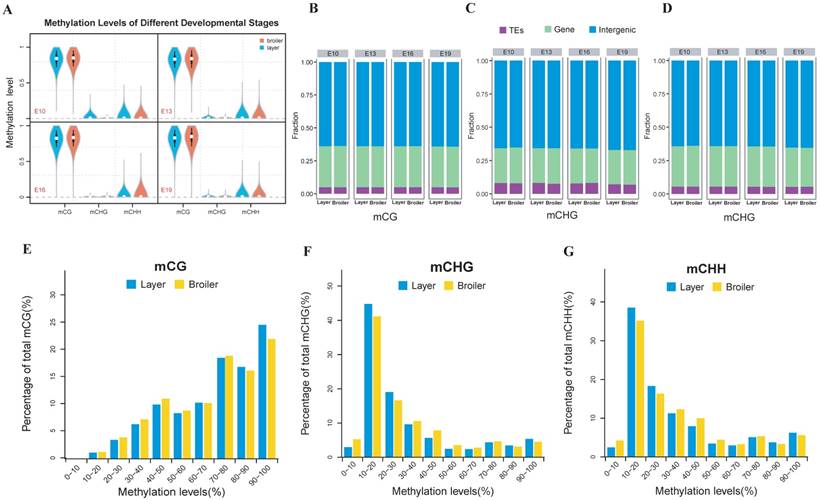
The methylation level of each developmental stage indicated that the layers and broilers had a similar global methylation profile (Fig. 1A). Similar proportions of CpG sites in three sequence contexts (CG, CHG, and CHH, where H is A, C, or T) were observed among 4 developmental stages (Fig. 1B, C and D). Next, the distributions of CpG methylation levels were analyzed at 4 developmental stages, respectively. In general, CpG showed a high methylation level in the CG context and a low methylation level in CHG and CHH contexts (Fig. 1E, F and G, and Supplementary Fig. 1A). The numbers of CpG islands (CGIs) in different genomic regions at different stages were counted (Supplementary Fig. 1B) and then adjusted with the region length for comparison (Supplementary Fig. 1C). More CGIs were located in gene promoter regions in broilers than layers, which indicated that methylation in CGIs may be involved in faster muscle development in broilers, as CGIs located at promoter regions are important for controlling gene expression [42].
Genome-wide profiles of DNA methylation among different sample groups. (A) Genomic methylation levels in either layers or broilers at E10, E13, E16 and E19, respectively. Methylation level were range from 0 to 1. (B-D) Proportion of methylated CpG located in different genomic features at different developmental stages and in CG, CHG and CHH contexts, respectively. (E-G) The methylation levels of methylated CpG sites were equally divided into 10 intervals and the percentage of each interval was measured using E10 as an example. The mCG, mCHG and mCHH represent the methylated CpG sites in CG, CHG and CHH contexts, respectively.
We measured the methylation levels of different regions of genes and compared these levels at different stages and chicken lines. Interestingly, we found that the broilers showed statistically lower methylation levels at all stages in the CG context than layers (Fig. 2A). We also examined the methylation levels of lncRNAs assembled in RNA-seq using a similar approach and compared levels with the analysis of gene methylations. Generally, the broilers still showed a lower methylation level in various types of lncRNAs in CG and CHH contexts compared with layers; similar methylation levels were observed among different types of lncRNAs (Fig. 2B and Supplementary Fig. 2C, D). Genes and lncRNAs had similar global methylation levels and both showed significant difference between chicken lines (Fig. 2A, and Supplementary Fig. 2A and 2B). These results suggested that faster muscle development of broilers may be due to the lower genomic methylation level in late embryonic stage, compared with those in layers.
Comparative measurement of methylation level of genes and lncRNA. (A) Comparison of methylation levels of genes or lncRNAs between layers and broilers in 3 different contexts. (B) Measurement of methylation level of different types of lncRNAs. The 'L' and 'B' in the figures represents the layers and the broilers, respectively. * P <0.05, ** P <0.01 for comparison between two chicken lines. The red star means the methylation level of layers is significantly higher than broilers whereas the green star represents an opposite result. (C, D) Genomic methylation around genes and lncRNAs were measured across the genome, respectively. Genes or lncRNAs were separated into 7 regions (upstream, first exon, first intron, inner exon, inner intron, last exon and downstream) and each region was equally divided into 20 bins for calculation and visualization.
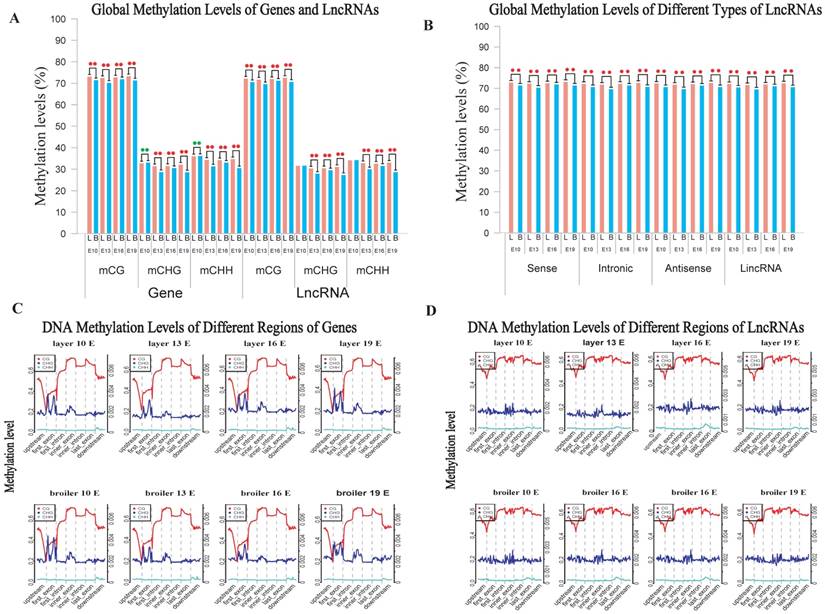
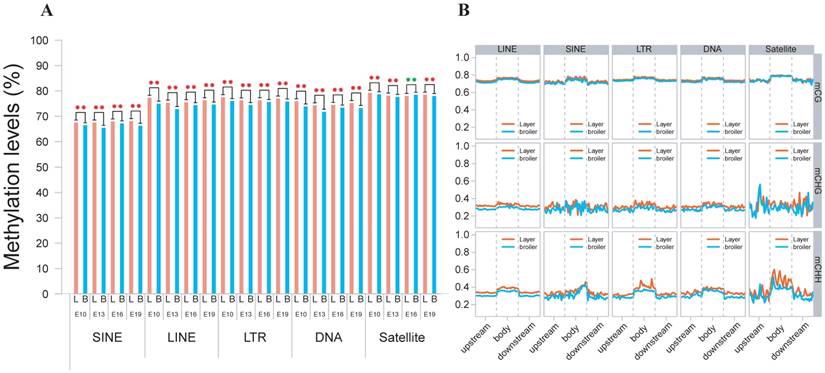
We also analyzed the genomic distribution patterns of DNA methylation in genes and lncRNAs. We divided the upstream region (2 kb), first exon, first intron, internal exon, internal intron, last exon and downstream region (2 kb) of genes and lncRNAs across the genome as different functional regions and their methylation levels were measured through 20 bins. In general, the 5′ upstream and 3′ downstream regions showed lower methylation levels than other gene regions. We also compared the methylation levels of gene regions with lncRNA regions (Figure 2C, D). The lncRNAs have relatively higher methylation levels around the transcription start site (TSS) compared with genes (P < 0.001). In addition, methylation levels of different types of repeat regions were also analyzed across the genome. Beside the significant differences between broilers and layers, the short interspersed nuclear elements (SINE) showed lower methylation levels than other types of repeat regions in the CG context across 4 stages (Fig. 3 and Supplementary Fig. 3).
Methylation levels of different types of TEs using E19 as an example. (A) Comparative measurement of methylation levels of SINE, LINE, LTR, DNA and Satellite regions between two chicken lines in CG context. (B) Methylation of different types of TEs for upstream, body and downstream regions in 3 different contexts using 20 bins across the whole genome.
Identification of differential methylation regions and genes
To explore the potential epigenetic causes of the divergence in muscle development between broilers and layers, the DMLs were identified and then the DMRs were identified in E10, E13, E16 and E19 based on the DMLs. The DMRs were subsequently annotated to the chicken genome, and the distribution of the DMRs in the whole genome was analyzed (Fig. 4A and Supplementary Table S4-S7). In general, the majority of DMRs were located in intronic and intergenic regions, and a small portion of DMRs were distributed in the promoter of genes (Fig. 4A). Proportion analysis revealed that broilers had more hypomethylated regions across the genome in the 4 developmental stages, indicating that low methylation in muscle development-related genes may account for the fast muscle development in broilers (Fig. 4B).
Analyses of DMRs at 4 developmental stages. DMR calling were performed in CG, CHG and CHH contexts, respectively. (A) Numbers of DMRs in different genomic regions (promoter, exon, intron, intergenic, and UTR regions). (B) Relative proportion of hyper-DMRs to hypo-DMRs in different CpG contexts. The mCG, mCHG and mCHH represent methylated CpG sites in the CG, CHG and CHH contexts, respectively. (C) The results of Gene Ontology (GO) analysis for genes with overlapped with DMR. Only part of the terms was selected for display. The red color represents GO-BP terms, the blue color represents GO-CC terms whereas green color represents GO-MF terms. The number in bracket indicates the number of genes enriched in a specific term.
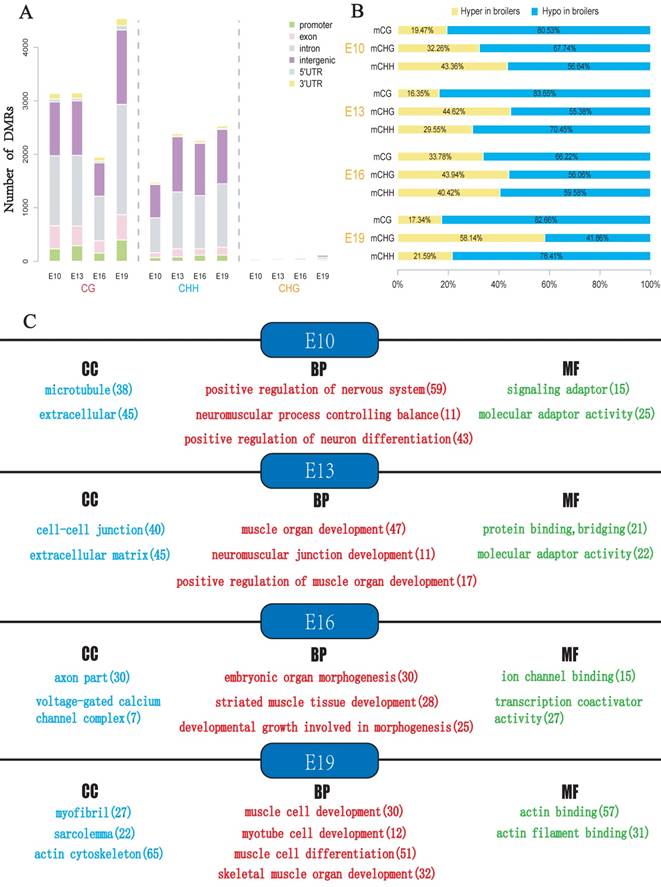
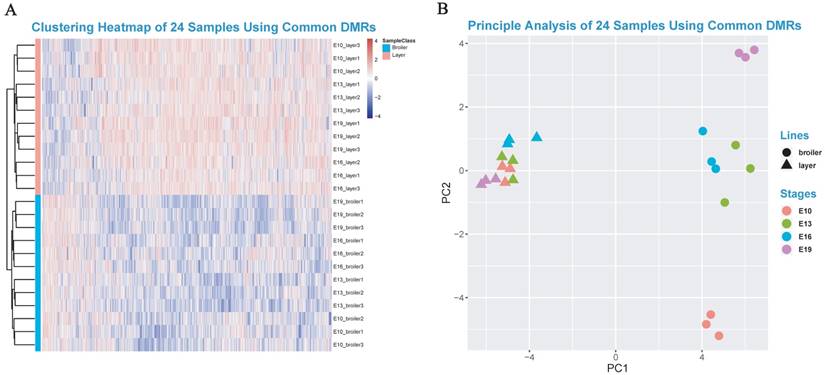
The DMGs were defined as genes with at least one DMR overlapped with its exon/intron regions. The GO enrichment analyses were then performed to investigate potential biological functions of the DMGs. In general, the DMGs in the 4 time points were most significantly enriched in terms related to the nervous system. However, many muscle-related terms were also found, especially for DMGs at E13 and E19, such as muscle organ development (47 genes; q-value < 0.001), myotube cell development (12 genes; q-value < 0.005), positive regulation of muscle organ development (17 genes; Q-value < 0.001), and muscle cell differentiation (51 genes; Q-value < 0.003) (Fig. 4c, Supplementary Table S8-S11). Because DMRs were not unanimous on the genomic positions among different time points, we merged the genomic positions of DMRs of the 24 samples to generate common DMRs and re-calculated the methylation level for each common DMR. Clustering analysis was performed using the common DMRs and visualized using heatmap analysis package. Different developmental stages were shown to cluster together, which indicated the high quality of sampling and DMR calling in this experiment (Fig. 5A). Moreover, the principle component analysis (PCA) result was consistent with the clustering analysis (Fig. 5B) and revealed that broilers showed more methylation level variances among 4 developmental stages than layers, which may prove that significant methylation changes lead to fast muscle development.
Heatmap clustering analysis and PCA analysis. (A) Heatmap clustering using merged common DMRs among 24 samples (see Materials and Methods). (B) The PCA analysis using common DMRs among 24 samples. Only the first and the second component were visualized.
Integrative analyses of DNA methylation and transcriptome
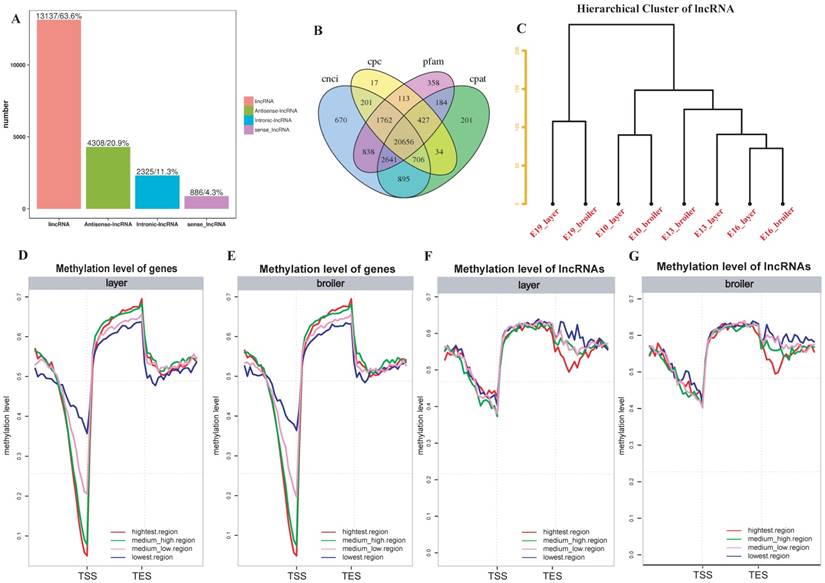
To further explore whether DNA methylation influences gene and lncRNA expression in chicken, RNA-seq was used to measure the expression of genes and identified lncRNAs. We identified 20656 lncRNAs in total. Most of the lncRNAs were lincRNAs (63.6%; Fig. 6A and 6B). The hierarchical cluster analysis of 24 samples suggested developmental stages accounted for most variances in lncRNA expression (Fig. 6C). We divided genes and lncRNAs into 4 expression groups on the basis of their expression levels (highest, medium high, medium low and lowest) using the quantile method. We then measured methylation levels in different expression groups of genes and lncRNAs, respectively. In general, broilers and layers had similar methylation levels. A negative correlation was observed between genes and methylation of promoters in both broilers and layers: the highest expression level group showed the lowest methylation level around the TSS, whereas the lowest expression level group showed the highest methylation level (Fig. 6D and E). Interestingly, the trend of negative correlation between lncRNAs expression and methylation was observed in downstream regions but not around the TSS regions (Fig. 6F and G). Moreover, the lncRNAs were usually methylated at higher levels than genes around the TSS (Fig. 6D-G).
LncRNA identification and correlation analyses between DNA methylation and genes or lncRNAs expression. (A) Number of different types of lncRNAs in all developmental stages. (B) Venn diagram of lncRNAs identified through 4 software. (C) Hierarchical cluster analysis of lncRNAs using their expression levels. Replicates were merged together in the analysis. (D-G) The genes or lncRNAs were divided into 4 groups based on their expression levels. The methylation level around TSS and TES of each group was measured using 20 bins across the whole genome for layers and broilers, respectively.
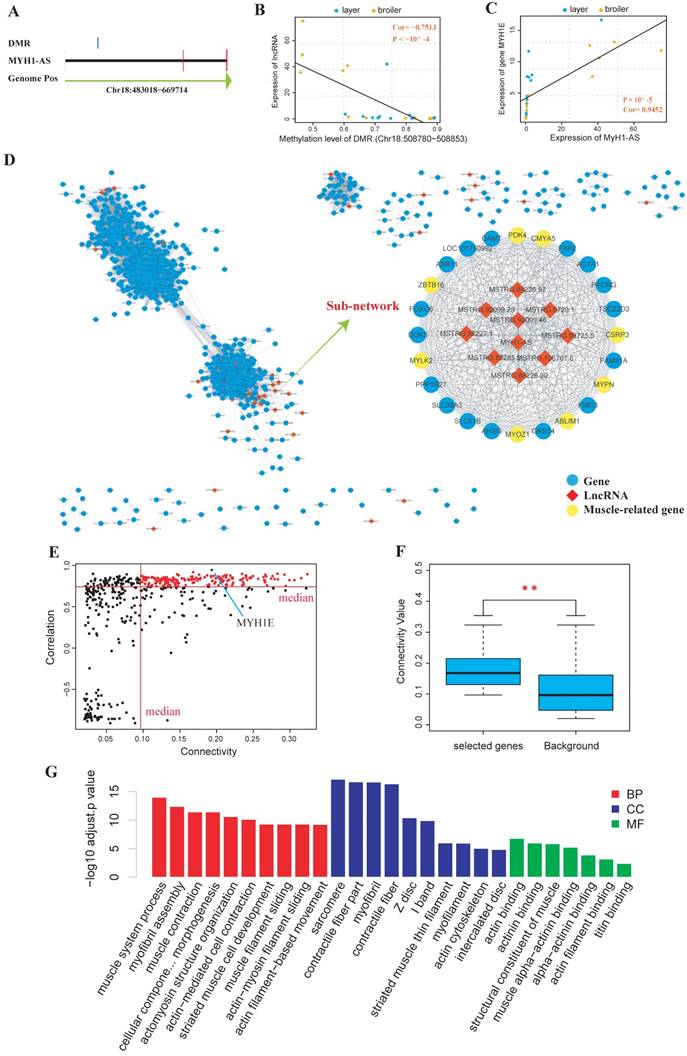
Next, DEGs and DELs calling were performed, and the cis-targets and trans-targets of lncRNAs were predicted. The DMRs were assigned to the genomically closest lncRNA generated from the RNA-seq in this study (Supplementary Table S12-S15) and the differential methylation lncRNA (DM lncRNA) were defined as DEL that was overlapped with at least one DMR. The results showed that 55 DM lncRNAs were identified (13, 16, 11 and 15 DM lncRNAs for 4 time points, respectively) (Supplementary Table S16). We then searched for DM lncRNAs with potential to regulate muscle development. In particular, we found that a lncRNA was identified as DM lncRNA at 3 of the 4 time points (E10, E16 and E19). Besides, most of its predicted targets were muscle related genes like MyH1E and MyH1A (Supplementary Table S16). We then explored the quantitative relationship between the lncRNA and its overlapped DMR or target genes. It showed that the expression of the lncRNA, which was named as MyH1-AS (Fig. 7A), was highly correlated with the methylation level of the DMR assigned to it (Spearman, Cor=-0.7513, P < 10-4; Fig. 7B). The expression of MyH1-AS was detected to dramatically increase in broilers compared to layers at E16 and E19 (Fig. 8A). Besides, its target gene MyH1E showed the highest correlation with MyH1-AS (Fig. 7C). To further explore the role of MyH1-AS in muscle development, the gene-lncRNA networks were constructed based on their connectivity using WGCNA, and the subnetwork of MyH1-AS was extracted from the whole network. MyH1-AS had a high correlation with several muscle-related genes in the subnetwork (Fig. 7D). The relationship between the connectivity and correlation is shown in Figure 7E. Interestingly, genes that were highly negatively correlated with MyH1-AS did not show high connectivity with MyH1-AS. All genes showing high connectivity with MyH1-AS were also highly positively correlated with MyH1-AS (Fig. 7E). A total of 168 genes with both high connectivity and correlation with MyH1-AS, were selected to perform GO analysis to confirm the role of MyH1-AS in myogenesis (Fig. 7F and G and Supplementary S17). The results showed that the majority of terms enriched by these genes were muscle-related.
Comprehensive analyses of lncRNA MyH1-AS. (A) Visualization of the MyH1-AS transcript and the DMR overlapped with it. (B) Correlation between methylation level of the DMR and expression level of MyH1-AS using Spearman method. (C) Correlation between expression level of MyH1-AS and expression level of its potential target MyH1E. (D) The whole gene-lncRNA network and the MyH1-AS subnetwork extracted from the entire network. (E) Visualization of correlation and connectivity of genes and MyH1-AS. The red points represent genes with both high connectivity and correlation with MyH1-AS and were selected for the subsequent GO analysis. (F) Comparison of connectivity values between genes selected (red points) and all genes in the subnetwork (background). * P <0.05, ** P <0.01 for comparison between selected genes and background. (G) Results of the GO analysis for genes selected.
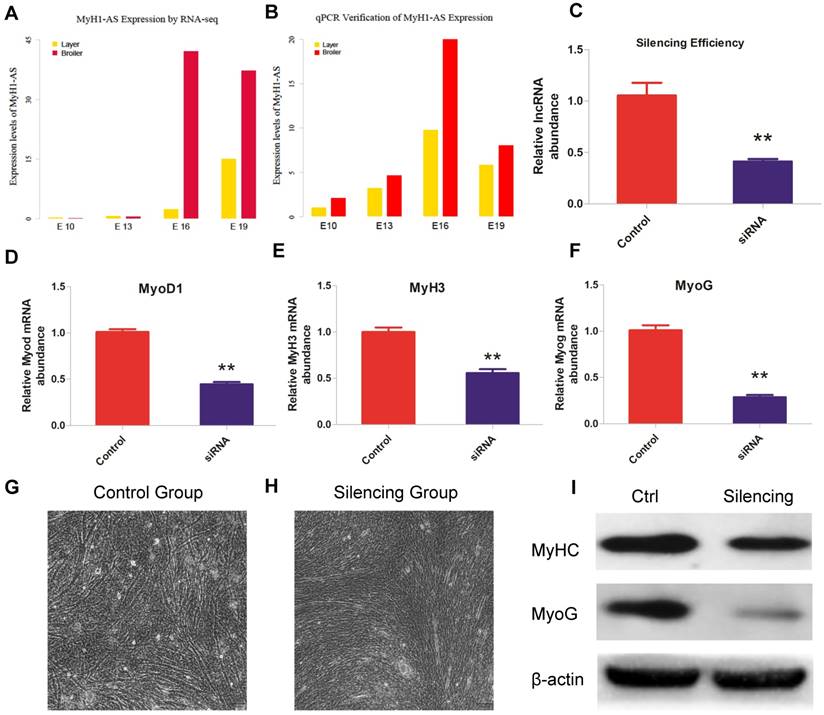
Role of lncRNA MyH1-AS in skeletal muscle satellite cells differentiation. (A) Expression levels of MyH1-AS in layers and broilers at different developmental stages. (B) Verification of lncRNA MyH1-AS expression levels at 4 developmental stages by qPCR. (C) lncRNA Silencing efficiency. * P <0.05, ** P <0.01 for comparison between control and silenced group. (D-F) The mRNA expression of MyoD1, MyH3 and MyoG in control and MyH1-AS silenced groups, respectively. * P <0.05, ** P <0.01 for comparison between control and silencing group. (G-H) The morphological change in myotubes after silencing. (I) The protein expression levels of MyHC and MyoG for comparison between the control and MyH1-AS silenced group, respectively.
Role of lncRNA MyH1-AS in skeletal muscle satellite cells differentiation
The expression levels of MyH1-AS produced by RNA-seq were verified by qPCR and a similar trend was observed, indicating a reliable sequencing outcome (Fig. 8A and B). Subsequently, a siRNA was designed to perform the MyH1-AS knockdown in the chicken skeletal muscle satellite cells. As shown in Fig 8C, expression of MyH1-AS was significantly reduced after transfecting, indicative of high efficiency of siRNA used in this experiment (Fig. 8C). Then the mRNA expression of muscle related genes (MyoD1, MyoG and MyH3) were measured at 48h after MyH1-AS silencing. It resulted in a reduced mRNA expression in silencing groups compared to control groups (Fig. 8D, E and F). Besides, the microscope was used to monitor the morphological change in myotubes after silencing. We found that MyH1-AS knockdown resulted in a reduced number of myotubes (Fig. 8G and 8H). Further western blot assay revealed that the expression of MyhC and MyoG protein was repressed in silencing groups (Fig. 8I). These results suggested that MyH1-AS may function in skeletal muscle differentiation.
Discussion
As a tissue of major economic importance in meat-producing animals, skeletal muscle accounts for ~40% of adult animal body weight, which plays important roles in initiating movements, supporting respiration and maintaining homeostasis[43, 44]. After long-term artificial breeding for different purposes, the layers and broilers show great differences in the development of skeletal muscles [45]. The skeletal muscle growth rate of broilers far exceeds that of layers even under optimal feeding conditions: the broilers can exhibit weights 5 times more than the layers at 6 weeks of age. The similar genetic and genomic backgrounds of the two chicken lines allow for comparative studies of muscle development at epigenetic level. Moreover, the chicken provides a unique model to perform embryological research because of the accessibility of egg. Here we used broilers and layers to explore the muscle development in chicken in the middle to late embryonic period. As the crucial role of DNA methylation in embryogenesis, we performed whole genome bisulfite sequencing and RNA-seq to systematically explore the prenatal DNA methylation landscape during chicken muscle development. Previous methylome studies have been performed using prenatal chicken or born chicken muscle [12, 46, 47], however, these studies failed to generate a comprehensive methylation landscape of embryonic stages. We focused on more systematical study at embryonic stage range from E10 to E19 between two chicken lines and aimed to elucidate the details of embryonic skeletal muscle development.
The DNA methylation level and proportion of different CpG contexts (CG, CHG, CHH) of each developmental stage indicated that layers and broilers have similar global methylation profiles. We also measured the methylation levels of different types of CpG, and our results were consistent with previous studies in chicken muscle [21]. The CpG sites proportion in the genome was different from those in the study of Zhang et al, as the CpG sites proportion in repeat regions accounted for less genomic proportion in our study [47]. One possibility for the discrepancy may be because the previous study used data from born chicken whereas our analyses were performed in data from prenatal chicken. It suggests that chicken had great epigenetic changes after birth and our study focusing on pre-hatching chicken is of value.
We next comprehensively compared the methylation levels of genes and lncRNAs among different developmental stages and chicken lines. In general, layers showed a significantly higher global methylation level than broilers in the CG context in both genes and lncRNAs, which may be responsible for their different speeds in muscle development. Furthermore, we compared the methylation levels of different types of lncRNAs (sense, intronic, antisense and lincRNA) and there were no significant differences, although significant variances were still observed between chicken lines. Next, genomic DNA methylation levels around genes and lncRNAs were measured across the genome, and the TSSs were found to be lower methylated in genes than lncRNAs. The broilers and layers showed similar trends around the TSS, which is consistent with patterns reported in previous studies in chicken [12, 21], as well as in bovine muscle tissue [11] and pig [48]. However, the TSSs of lncRNAs were usually methylated at higher levels compared with protein coding genes, which may explain why the expression levels of lncRNAs are usually lower than genes (P < 10-8), as methylation events in the promoter region usually affect gene expression [49]. In addition, the methylation levels of different types of transpose elements (TEs) (SINE, LINE, LTR, DNA and satellites) were also measured and TEs were methylated at higher levels in layers compared with broilers. TEs are usually inactivated in animals but were reported to function in the early development of human and other mammals to provide cis-regulatory elements that coordinate the expression of groups of genes [50]. As epigenetic regulation is important for the activity of TEs [51], these differences between the two chicken lines may also account for the divergence in their muscle development.
The clustering heatmap and PCA were performed using common DMRs among 4 developmental stages. The expected classifications were observed in both analyses, indicating the reliable outcomes of sequencing and DMR calling. Moreover, significant changes on genomic methylation level were observed in broilers among 4 developmental stages, the variance is likely to be the factor that causes the fast development of the broilers' muscle. We found that DMRs between two chicken lines mainly distributed in intron regions and intergenic regions. These results are consistent with previous studies in chicken [12], indicative of the important role of methylation in developmental regulation. However, as DNA methylation in gene body region affects gene expression in several sophisticated ways [42], further studies on how methylation of the intron regions can influence gene expression are required to elucidate the complicated epigenetic mechanisms underlying muscle development in chickens. In chicken, Myofiber ontogenesis begins with the appearance of two successive waves of myoblasts which constitute the origin of the different types of muscle fibers. The primary fibers form mainly at E3-E7 and the second fibers forms at E8-E16 [24, 25]. The numbers of DMRs in CG context at E10 and E13 were much more than that at E16. Therefore, it is reasonable that the broilers have different transcription status which is regulated by DNA methylation at the second muscle developmental wave. Besides, the number of DMRs was detected to rise dramatically at E19, suggesting that E19 may be a crucial period for the different development between the layers and the broilers. We analyzed the proportion of hypermethylated and hypomethylated regions and the majority of DMRs were detected to be hypomethylated regions in broilers, indicating that low methylation may be responsible for fast muscle development. This result is consistent with the preceding conclusion in this study that the layers have higher methylation levels of genes and lncRNAs on the genome (Fig. 2A and 2B). Genes with overlapped with DMR at different times were regarded as DMGs and used for GO analysis. We found that DMGs at E13 and E19 were significantly enriched in muscle-related terms, for example, a term at E13 named extracellular matrix (ECM). The ECM is a complex formed by various functional molecules, which is able to control the activities of cells and thus participate the process like adhesion and proliferation by interacting with related elements on the surface of the cells like integrin [52],therefore, ECM was supposed to be related to the muscle cell differentiation. Some terms like muscle organ development and positive regulation of muscle tissue development were also observed at E13, thus the DMGs at E13 may have an important role in fetal phase of muscle development in the chick [53]. Comparatively, DMGs at E19 were mainly enriched in terms like muscle cell development, myotube cell development and muscle cell differentiation. As adult myoblasts mainly formed at E18-E19, DMGs at E19 may have a role in period that fetal myoblasts were replaced by adult myoblasts [52]. Additionally, DMGs among 4 stages were significantly enriched in nerve development-related terms, which may relate to the impact of domestication and artificial breeding. Integrative analysis of multi-omics was conducted to study the association between methylation level and mRNA expression. We noticed that the mRNA level and methylation level around TSSs were negatively correlated in genes but not lncRNAs, indicating that DNA methylation regulates lncRNA expression in a more complex way than gene expression, however, the detailed mechanisms need more studies.
To explore which lncRNA may potentially influence muscle development, the DM lncRNAs were identified and the correlation between DM lncRNA and the assigned DMR were measured. In particular, MyH1-AS showed a high correlation with its target MyH1E and the DMR overlapped with its intron region. WGCNA analysis revealed that several muscle-related genes were highly correlated with MyH1-AS in the subnetwork. For example, MYLK2, a muscle-specific gene, expresses skMLCK specifically in skeletal muscles [54, 55]. ABLIM1 was reported to be related to muscle weakness and atrophy [56]. Increased PDK4 expression may be required for the stable modification of the regulatory characteristics of PDK observed in slow-twitch muscle in response to high-fat feeding [57], and other genes in the network, such as MyoZ1, MYPN and ZBTB16 genes, were also revealed to be muscle- or meat quality-related genes [58-61]. This indicates that MyH1-AS may have a significant function in muscle development regulation. Notably, as we noticed that high correlation did not exactly indicate high connectivity, we also performed GO enrichment analysis using 168 genes, which had top 50% both high connectivity and correlation values with MyH1-AS in the network, as input. The majority of the resulting GO terms were muscle-related terms, which is strongly indicative of MyH1-AS functioning in muscle development. Therefore, these results suggest that MyH1-AS is regulated by DNA methylation and participates in muscle development during embryonic stages. Subsequent knockdown and western blot assay verified our analysis results, suggesting the reliability of our analysis and the role of MyH1-AS in muscle differentiation. However, how the lncRNA MyH1-AS regulates muscle development requires more studies.
In conclusion, we revealed a comprehensive DNA methylome and transcriptome landscape during embryonic developmental stages in chickens, and identified an lncRNA, MyH1-AS, that may potentially play a part in muscle development. Moreover, we provided a basis and a reliable resource for further investigating the genetic regulation of methylation and gene expression in embryonic chicken.
Supplementary Material
Supplementary figures.
Supplementary table.
Acknowledgements
This research was supported by the Sichuan Science and Technology Program (2018JY0488), and the China Agriculture Research System (CARS-40-K06). We thank Edanz Group (www.edanzediting.com/ac) for editing a draft of this manuscript.
Data availability
All the data are available in the SRA database with accession number PRJNA516545.
Competing Interests
The authors have declared that no competing interest exists.
References
1. Goldberg AD, Allis CD, Bernstein E. Epigenetics: a landscape takes shape. Cell. 2007;128:635-638
2. Guttman M, Amit I, Garber M, French C. et al. Chromatin signature reveals over a thousand highly conserved large non-coding RNAs in mammals. Nature. 2009;458:223-227
3. Feinberg AP. Phenotypic plasticity and the epigenetics of human disease. Nature. 2007;447:433-440
4. Sanford JP, Clark HJ, Chapman VM, Rossant J. Differences in DNA methylation during oogenesis and spermatogenesis and their persistence during early embryogenesis in the mouse. Genes. Dev. 1987;1:1039-46
5. Zhou ZY, Li A, Wang LG, Irwin DM. et al. DNA methylation signatures of long intergenic noncoding RNAs in porcine adipose and muscle tissues. Sci. Rep. 2015;5:15435
6. Yang Y, Liang G, Niu G, Zhang Y. et al. Comparative analysis of DNA methylome and transcriptome of skeletal muscle in lean-, obese-, and mini-type pigs. Sci. Rep. 2017;7:39883
7. Cesana M, Cacchiarelli D, Legnini I, Santini T. et al. A long noncoding RNA controls muscle differentiation by functioning as a competing endogenous RNA. Cell. 2011;147:358-369
8. Rudolf J, Adrian B. Epigenetic regulation of gene expression: how the genome integrates intrinsic and environmental signals. Nat. Genet. 2003;33:245-254
9. Miyata K, Miyata T, Nakabayashi K, Okamura K. et al. DNA methylation analysis of human myoblasts during in vitro myogenic differentiation: de novo methylation of promoters of muscle-related genes and its involvement in transcriptional down-regulation. Hum. Mol. Gene. 2015;24:410-423
10. Huszar G. Developmental Changes of the Primary Structure and Histidine Methylation in Rabbit Skeletal Muscle Myosin. Nat. New. Biol. 1972;240:260-4
11. Huang YZ, Sun JJ, Zhang LZ, Li CJ. et al. Genome-wide DNA methylation profiles and their relationships with mRNA and the microRNA transcriptome in bovine muscle tissue (Bos taurine). Sci. Rep. 2014;4:6546
12. Zhang M, Yan FB, Li F, Jiang KR. et al. Genome-wide DNA methylation profiles reveal novel candidate genes associated with meat quality at different age stages in hens. Sci. Rep. 2017;7:45564
13. Yin H, Zhang S, Gilbert ER, Siegel PB. et al. Expression profiles of muscle genes in postnatal skeletal muscle in lines of chickens divergently selected for high and low body weight. Poult Sci. 2014;93:147-54
14. Illingworth R, Kerr A, DeSousa D, Jørgensen H. et al. A novel CpG island set identifies tissue-specific methylation at developmental gene loci. PLoS Biol. 2008;6:e22
15. Carri贸 E, D铆Ezvillanueva A, Lois S, Mallona I. et al. Deconstruction of DNA methylation patterns during myogenesis reveals specific epigenetic events in the establishment of the skeletal muscle lineage. Stem Cells. 2015;33:2025-2036
16. Kallen AN, Zhou X-B, Xu J, Qiao C. et al. The imprinted H19 lncRNA antagonizes let-7 microRNAs. Mol Cell. 2013;52:101-112
17. Matsumoto A, Pasut A, Matsumoto M, Yamashita R. et al. mTORC1 and muscle regeneration are regulated by the LINC00961-encoded SPAR polypeptide. Nature. 2017;541:228
18. Di Ruscio A, Ebralidze AK, Benoukraf T, Amabile G. et al. DNMT1-interacting RNAs block gene-specific DNA methylation. Nature. 2013;503:371
19. Zhou J, Yang L, Zhong T, Mueller M. et al. H19 lncRNA alters DNA methylation genome wide by regulating S-adenosylhomocysteine hydrolase. Nat Commun. 2015;6:10221
20. Zhi H, Li X, Wang P, Gao Y. et al. Lnc2Meth: a manually curated database of regulatory relationships between long non-coding RNAs and DNA methylation associated with human disease. Nucleic. Acids. Res. 2017;4:D133-138
21. Li J, Li R, Wang Y, Hu X. et al. Genome-wide DNA methylome variation in two genetically distinct chicken lines using MethylC-seq. BMC Genomics. 2015;16:1-13
22. Li Q, Wang Y, Hu X, Zhao Y. et al. Genome-wide Mapping Reveals Conservation of Promoter DNA Methylation Following Chicken Domestication. Sci. Rep. 2015;5:8748
23. Li Q, Li N, Hu X, Li J. et al. Genome-wide mapping of DNA methylation in chicken. Plos One. 2011;6:e19428
24. Picard B, Lefaucheur L, Berri C, Duclos MJ. Muscle fibre ontogenesis in farm animal species. Reproduction, nutrition, development. 2002;42:415-31
25. Bandman E, Rosser BW. Evolutionary significance of myosin heavy chain heterogeneity in birds. Microsc Res Tech. 2000;50:473-491
26. Krueger F, Andrews SR. Bismark: a flexible aligner and methylation caller for Bisulfite-Seq applications. Bioinformatics. 2011;27:1571-1572
27. Kim D, Langmead B, Salzberg SL. HISAT: a fast spliced aligner with low memory requirements. Nat. Methods. 2015;12:357-360
28. Pertea M, Pertea GM, Antonescu CM, Chang TC. et al. StringTie enables improved reconstruction of a transcriptome from RNA-seq reads. Nat. Biotechnol. 2015;33:290-295
29. Kong L, Zhang Y, Ye ZQ, Liu XQ. et al. CPC: assess the protein-coding potential of transcripts using sequence features and support vector machine. Nucleic. Acids. Res. 2007;35:W345-349
30. Sun L, Luo H, Bu D, Zhao G. et al. Utilizing sequence intrinsic composition to classify protein-coding and long non-coding transcripts. Nucleic. Acids. Res. 2013;41:e166
31. Wang L, Park HJ, Dasari S, Wang S. et al. CPAT: Coding-Potential Assessment Tool using an alignment-free logistic regression model. Nucleic. Acids. Res. 2013;41:e74
32. Finn RD, Tate J, Mistry J, Coggill PC. et al. A: The Pfam protein families database. Nucleic. Acids. Res. 2011;32:D138
33. Li J, Ma W, Zeng P, Wang J. et al. LncTar: a tool for predicting the RNA targets of long noncoding RNAs. Brief. Bioinform. 2015;16:806-812
34. Wu H, Wang C, Wu Z. A new shrinkage estimator for dispersion improves differential expression detection in RNA-seq data. Biostatistics. 2012;14:232-243
35. Feng H, Conneely KN, Wu H. A Bayesian hierarchical model to detect differentially methylated loci from single nucleotide resolution sequencing data. Nucleic Acids Res. 2014;42:e69-e69
36. Wu H, Xu T, Feng H, Chen L. et al. Detection of differentially methylated regions from whole-genome bisulfite sequencing data without replicates. Nucleic Acids Res. 2015;43:e141-e141
37. Park Y, Wu H. Differential methylation analysis for BS-seq data under general experimental design. Bioinformatics. 2016;32:1446-1453
38. Yu G, Wang LG, He QY. ChIPseeker: an R/Bioconductor package for ChIP peak annotation, comparison and visualization. Bioinformatics. 2015;31:2382-2383
39. Anders S, Mccarthy DJ, Chen Y, Okoniewski M. et al. Count-based differential expression analysis of RNA sequencing data using R and Bioconductor. Nat. Protoc. 2013;8:1765-1786
40. Yu G, Wang L-G, Han Y, He Q-Y. clusterProfiler: an R package for comparing biological themes among gene clusters. OMICS. 2012;16:284-287
41. Langfelder P, Horvath S. WGCNA: an R package for weighted correlation network analysis. BMC bioinformatics. 2008;9:559
42. Jones PA. Functions of DNA methylation: islands, start sites, gene bodies and beyond. Nat. Rev. Genet. 2012;13:484-492
43. Vinciguerra M, Musaro A, Rosenthal N. Regulation of Muscle Atrophy in Aging and Disease. Adv. Exp. Med. Biol. 2010;694:211-233
44. Ge X, Zhang Y, Park S, Cong X. et al. Stac3 inhibits myoblast differentiation into myotubes. PLoS One. 2014;9:e95926
45. Aberle ED, Stewart TS. Growth of fiber types and apparent fiber number in skeletal muscle of broiler- and layer-type chickens. Growth. 1983;47:135-144
46. Li S, Zhu Y, Zhi L, Han X. et al. DNA Methylation Variation Trends during the Embryonic Development of Chicken. Plos One. 2016;11:e0159230
47. Hu Y, Xu H, Li Z, Zheng X. et al. Comparison of the genome-wide DNA methylation profiles between fast-growing and slow-growing broilers. Plos One. 2013;8:e56411
48. Wang H, Wang J, Ning C, Zheng X. et al. Genome-wide DNA methylation and transcriptome analyses reveal genes involved in immune responses of pig peripheral blood mononuclear cells to poly I:C. Sci. Rep. 2017;7:9709
49. Lorincz MC, Dickerson DR, Schmitt M, Groudine M. Intragenic DNA methylation alters chromatin structure and elongation efficiency in mammalian cells. Nat. Struct. Mol. Biol. 2004;11:1068-1075
50. Garcia-Perez JL, Widmann TJ, Adams IR. The impact of transposable elements on mammalian development. Development. 2016;143:4101-4114
51. Waterland RA, Jirtle RL. Transposable elements: targets for early nutritional effects on epigenetic gene regulation. Mol. Cell. Biol. 2003;23:5293-5300
52. Hartley RS, Bandman E, Yablonka-Reuveni Z. Skeletal muscle satellite cells appear during late chicken embryogenesis. Dev Biol. 1992;153:206-216
53. Stockdale FE, Miller JB. The cellular basis of myosin heavy chain isoform expression during development of avian skeletal muscles. Dev Biol. 1987;123:1-9
54. Kamm KE, Stull JT. Dedicated myosin light chain kinases with diverse cellular functions. J. Biol. Chem. 2001;276:4527-4530
55. Zhi G, Ryder JW, Huang J, Ding P. et al. Myosin light chain kinase and myosin phosphorylation effect frequency-dependent potentiation of skeletal muscle contraction. Proc. Natl. Acad. Sci. USA. 2005;102:17519-17524
56. Ohsawa N, Koebis M, Mitsuhashi H, Nishino I. et al. ABLIM1 splicing is abnormal in skeletal muscle of patients with DM 1 and regulated by MBNL, CELF and PTBP 1. Genes. Cells. 2015;20:121-134
57. Holness MJ, Kraus A, Harris RA, Sugden MC. Targeted upregulation of pyruvate dehydrogenase kinase (PDK)-4 in slow-twitch skeletal muscle underlies the stable modification of the regulatory characteristics of PDK induced by high-fat feeding. Diabetes. 2000;49:775-781
58. Ying F, Gu H, Xiong Y, Zuo B. Analysis of differentially expressed genes in gastrocnemius muscle between DGAT1 transgenic mice and wild-type mice. Biomed. Res. Int. 2017;2017:5404682
59. Caremani M, Yamamoto DL, Nigro V, Lombardi V. et al. The Role of Myopalladin in Skeletal Muscle. Biophys. J. 2014;106:767a
60. Shum AM, Mahendradatta T, Taylor RJ, Painter AB. et al. Disruption of MEF2C signaling and loss of sarcomeric and mitochondrial integrity in cancer-induced skeletal muscle wasting. Aging. 2012;4:133-143
61. Luo B, Ye M, Xu H, Ma E. et al. Expression analysis, single-nucleotide polymorphisms of the Myoz1 gene and their association with carcase and meat quality traits in chickens. Ital. J. Anim. Sci. 2018:1-9
Author contact
![]() Corresponding author: Huadong Yin, Farm Animal Genetic Resources Exploration and Innovation Key Laboratory of Sichuan Province, Sichuan Agricultural University, Chengdu, Sichuan 611130, PR China. E-mail: yinhuadongedu.cn
Corresponding author: Huadong Yin, Farm Animal Genetic Resources Exploration and Innovation Key Laboratory of Sichuan Province, Sichuan Agricultural University, Chengdu, Sichuan 611130, PR China. E-mail: yinhuadongedu.cn