Impact Factor ISSN: 1449-2288
- Issue 12; 2026
- Issue 11; 2026
- Issue 10; 2026
- Issue 9; 2026
- Issue 8; 2026
- Volume 22; 2026
- Past Issues
- Advance Articles
- Editorial Board
- Cover Images
- Index & Coverage
- Cover Suggestion
- Special Issues
Introduction
Materials and Methods
Results
Discussion
Abbreviations
Supplementary Material
Acknowledgements
References

 Global reach, higher impact
Int J Biol Sci 2019; 15(8):1696-1711. doi:10.7150/ijbs.33844 This issue Cite
Research Paper
TLX3 repressed SNAI1-induced epithelial-mesenchymal transition by directly constraining STAT3 phosphorylation and functionally sensitized 5-FU chemotherapy in hepatocellular carcinoma
Cong Wang, Changwei Dou, Yufeng Wang, Zhikui Liu, Lewis Roberts ![]() , Xin Zheng
, Xin Zheng ![]()
Department of Hepatobiliary Surgery, the First Affiliated Hospital of Xi'an Jiaotong University, Xi'an, Shaanxi 710061, China
Received 2019-2-25; Accepted 2019-4-30; Published 2019-6-5
Abstract

TLX3 has an established role as a sequence-specific transcription factor with vital functions in the nervous system. Although several studies have shown that TLX3 is aberrantly up-regulated in leukemia, its expression and function in hepatocellular carcinoma (HCC) remain unknown. We found that TLX3 expression was decreased in 68/100 (68%) HCC cases and negatively correlated with the expression of p-STAT3, SNAI1, and Vimentin, while it was positively associated with E-cadherin expression. ITRAQ proteomic profiling revealed significantly less TLX3 expression in primary HCC tumors than in portal vein tumor thrombi. Comparison of Kaplan-Meier curves showed that down-regulation of TLX3 in HCC was associated with poor post-surgical survival. TLX3 over-expression inhibited HCC cell viability, proliferation, migration, invasion and enhanced 5-FU treatment, whereas silencing TLX3 produced the opposite results. Further experiments showed that TLX3 attenuated the EMT phenotype. In vivo experiments showed that knockdown of TLX3 promoted the growth of HCC xenografts and attenuated the anti-tumor effects of 5-FU treatment. Gene expression microarray analysis revealed that TLX3 inhibited IL-6/STAT3 signaling. In additional mechanistic studies TLX3 reversed the EMT phenotype of HCC cells by binding to STAT3, inhibiting STAT3 phosphorylation, and down-regulating SNAI1 expression. Taken together, loss of expression of TLX3 induces EMT by enhancing IL-6/STAT3/SNAI1 signaling, and accelerates HCC progression while also attenuated the effect of 5-FU on HCCs.
Keywords: TLX3, HCC, EMT, STAT3, SNAI1
Introduction
Hepatocellular carcinoma (HCC) is a leading malignancy worldwide. Each year, approximately 50% of newly diagnosed HCC cases occur in China [1]. Despite progressive improvements in therapeutic regimens for HCC, the prognosis remained unsatisfactory. Surgical resection remains the preferred choice for curative treatment of HCC patients [2-4]. However, nearly 70% of HCCs recur within 5 years after curative liver resection, in part due to the lack of effective targeted therapies [5], resulting in poor long-term post-surgical survival [6]. It is therefore critical to discover the mechanisms of HCC recurrence and metastases, and identify the key predictive factors and most important therapeutic targets for HCCs progressing post-hepatectomy.
The epithelial-mesenchymal transition (EMT) refers to the process of conversion of epithelial cells into cells with mesenchymal properties and phenotype, which has been shown to be a key transition occurring during development [7], in inflammatory diseases [8], organ fibrosis[9] and carcinogenesis[10]. The EMT has been shown to promote cancer cell dissemination and metastases and maintain cancer stem cell properties in a variety of cancers [11-13]. Recently, the EMT was found to confer higher migratory and invasive capacities, chemoresistance, and an enhanced propensity for HCC metastasis [14-16]. However, the mechanisms regulating the EMT phenotype in HCC progression are incompletely understood.
The inflammatory cytokine IL-6, which is secreted primarily by macrophages, has been shown to be up-regulated during liver regeneration, hepatitis, liver cirrhosis and HCC. IL-6 controls physiological and pathological processes in the liver by down-stream signaling. Through signal transducer and activator of transcription 3 (STAT3), a key transcription factor that regulates cell proliferation[17], immune responses[18], cell migration[19] and invasion[20]. Previous studies have shown that interaction of IL-6 with the polypeptide receptor glycoprotein 130 at the cell surface mediates JAK protein induced tyrosine phosphorylation and dimerization of STAT3, transforming STAT3 into a transcriptionally activated form that trans-locates into the nucleus, binds to target gene promoters, and mediates their transcription. Intriguingly, there is a binding site for STAT3 dimers on the STAT3 promoter, thus STAT3 can be constitutively self-activated, which further amplifies its regulatory functions. SNAI1, also known as SNAIL, is one of three vertebrate SNAIL proteins [21]. SNAI1 activates the EMT program during development[22], fibrosis[23] and carcinogenesis [24]. Carboxy-terminal zinc-finger domains of the SNAI1 protein bind to E-box sequences of epithelial genes and repress their transcription [25, 26]. We have previously shown that SNAI1 is a critical mediator of the EMT phenotype in HCC cells.
T-cell leukemia 3 (TLX3), also known as Rnx, belongs to the TLX/Hox11 subfamily of transcription factors. TLX3 is expressed in spinal cord motor neurons and the brain stem and plays an important role in neuronal differentiation and development [27, 28]. Due to a chromosomal rearrangement at its genomic locus, TLX3 is aberrantly over-expressed in T cell acute lymphoblastic leukemia (T-ALL) [29, 30]. However, studies of the prognostic value of TLX3 in patients with T-ALL have yielded conflicting results [31-33]. To figure out the oncogenic mechanisms of TLX3 on T-ALL, previous study compared the miRNA expression between primitive T cells and TLX3-positive subtype of T-ALL (TLX3-T-ALL cells). It was found that miR-125b was aberrantly up-regulated in TLX3-T-ALL cells. By loss- and gain-of-function experiments, TLX3 was found to up-regulate miR-125b via directly binding and transactivation of the long noncoding RNA LINC00478 and consequently facilitate T-cell progenitor production and promote their accumulation at immature stages of T-cell development resembling the differentiation arrest observed in TLX3 T-ALL. The further investigation revealed that miR-125b exerted the oncogenic action in T-ALL by suppression of Ets1 and CBFβ, which were T-lineage regulators[34]. Another investigation also revealed that TLX3 interacted with Ets1 and inhibited TCRα expression and then induced T cell maturation arrest in T-ALL[35]. However, to our knowledge, there were no more studies reported about the mechanism by which TLX3 mediates carcinogenesis. And it also remains unclear about the expression of TLX3 in HCC tissues and its role in HCC progression.
In the present study, we found that TLX3 was frequently down-regulated in HCC tissues compared to adjacent liver tissues, and that suppression of TLX3 expression was significantly associated with poor post-surgical outcomes in HCC patients. TLX3 reversed the EMT phenotype of HCC cells in both in vitro and in vivo experiments. In mechanistic studies we showed that TLX3 interacts directly with STAT3, as confirmed by immunoprecipitation (IP), thus inhibiting the phosphorylation and dimerization of STAT3. Using chromatin immunoprecipitation (ChIP), we showed that phospho-STAT3 binds to the SNAI1 promoter, accelerating SNAI1 transcription and consequently inducing the EMT phenotype in HCC cells. These data indicate that TLX3 exerts an anti-HCC tumor suppressor function by repressing the EMT driven by the IL-6/STAT3/SNAI1 pathway.
Materials and Methods
HCC samples
Studies using clinical HCC samples were carried out with the approval of the ethics committee of the First Affiliated Hospital of Xi'an Jiaotong University according to the Helsinki Declaration of 2013 (No.20080425, 6 May 2008). One hundred HCC patients seen in the Department of Hepatobiliary Surgery at the First Hospital of Xian Jiaotong University between January 2008 and June 2012 were recruited and provided informed consent. None of the patients received neo-adjuvant chemotherapy or radiotherapy before surgery. The patients received either curative or palliative liver resection for early or advanced HCC, respectively. HCC and adjacent liver tissues (> 2 cm distance from the margin of the resection) were collected and immediately stored in paraformaldehyde for immunohistochemical staining (IHC) or frozen in liquid nitrogen for Western immunoblotting. Clinicopathological features were abstracted. The presence of liver cirrhosis, Edmonson classification, clinical tumor-node-metastasis (TNM) staging, presence of portal invasion and maximum tumor diameter were determined by two experienced pathologists. Supplementary table 1 shows the relevant demographic and pathologic information. The clinical follow-up information after liver resection was obtained for 87 of the 100 HCC patients (87%) with a follow-up duration ranging from 15 to 120 months.
Protein identification and quantification of HCCs and matched portal vein tumor thrombosis (PVTT) by iTRAQ-Based Proteomic Analysis
Tissues from primary HCCs and their matching PVTT were harvested from 3 patients during liver resection. The study was approved by the ethics committee of the First Affiliated Hospital of Xi'an Jiaotong University according to the Helsinki Declaration of 2013 (No.20080425, 6 May 2008). Informed consent was obtained from all 3 patients. All tissues were examined by isobaric tags for relative and absolute quantitation (iTRAQ) combined with two-dimensional liquid chromatography-tandem mass spectrometry (2D-LC-MS/MS) by Shanghai GENECHEM CO. (Shanghai, China).
Immunohistochemistry staining
IHC staining was performed as described previously[36]. Briefly, 4-mm-thick tissue slides were de-paraffinized with xylene and rehydrated with graded alcohols. Endogenous peroxidase activity was blocked for half an hour with methanol solution containing 0.3% hydrogen peroxide. Antigens were then retrieved in citrate buffer and slides were blocked overnight at 4˚C. After washing with PBS, slides were incubated with the respective primary antibodies directed against TLX3 (ab184011; 1:100; Abcam), p-STAT3 (9145; 1:400; Cell Signaling Technology), SNAI1(3895; 1:400; Cell Signaling Technology), E-cadherin (14472; 1:50; Cell Signaling Technology) and Vimentin (5741; 1:100; Cell Signaling Technology) at 4˚C overnight. After rinsing with PBS, the slides were incubated with the relevant secondary antibodies, detected with diaminobenzidine and counterstained with hematoxylin. The IHC scores for all proteins were assessed as described [37].
Cell culture
Normal human hepatocyte LO2 and five HCC cell lines including Huh7, MHCC97h, HepG2, Hep3B and SK Hep1 cell were purchased from the Institute of Biochemistry and Cell Biology, Chinese Academy of Sciences (Shanghai, China). All HCC cells and LO2 cells in this study were cultured in DMEM medium supplemented with 10% fetal bovine serum (FBS). Normal human hepatocyte and HCC cell lines were examined and authenticated by the standard short tandem repeat DNA typing methodology before used in this investigation.
RNA extraction and quantitative reverse-transcription-polymerase chain reaction (qRT-PCR)
The mRNA levels of TLX3 and the reference gene GAPDH were measured by real-time PCR on an ABI 7300 machine (Applied Biosystem, USA). Total RNA was extracted from cultured HCC cells according to the manufacturer's instructions with the Rneasy kit from Qiagen Co. (Valencia, CA, USA). 2μg RNA was reverse transcribed to cDNA using the PrimeScript RT Master Mix from TaKaRa (Osaka, Japan). TLX3 mRNA level was measured by SYBR Green qRT-PCR assay with the following primers: TLX3 Forward 5'-GAGGACGCGGGATCTTACAG-3' and Reverse 5'-TGTGAAGCGGTCTTTCACGA-3'; GAPDH Forward 5'-ACCACAGTCCATGCCATCAC-3' and Reverse 5'-TCCACCACCCTGTTGCTGTA-3'.
Western immunoblotting and immunoprecipitation
Protein expression was assessed in samples from both HCC cell lines and resected patient tissues by Western immunoblotting as described previously [38]. The primary antibodies used were: TLX3 (ab184011; Abcam), p-STAT3 (9145; Cell Signaling Technology), STAT3 (9139; Cell Signaling Technology), SNAI1(3895; Cell Signaling Technology), E-cadherin (14472; Cell Signaling Technology), N-cadherin (4061; Cell Signaling Technology), Vimentin (5741; Cell Signaling Technology) and β-actin (8457; Cell Signaling Technology). All protein expression was normalized toβ-actin after densitometric scanning.
Co-immunoprecipitation (CO-IP) was conducted to determine whether TLX3 protein was bound with STAT3 protein according to the protocol reported previously [37]. Briefly, HCC cells were lysed with immunoprecipitation buffer (50 mM Tris-HCl, pH 7.4, 150 mM NaCl, 1% NP40, 1 mM ethylenediaminetetraacetic acid, 10 mM sodium butyrate) containing protease inhibitors. The cell lysate was incubated with the antibody against TLX3 (ab184011; Abcam) overnight at 4˚C and protein A/G-agarose beads were added. The mixture was shaken overnight at 4˚C and then rinsed with immunoprecipitation buffer. The supernatant was analyzed by Western immunoblotting with the STAT3 antibody (9139; Cell Signaling Technology).
Chromatin immunoprecipitation assay
The regulatory effect of p-STAT3 on the transcription of SNAI1 was determined by chromatin immunoprecipitation (ChIP) of HCC cells fixed with 1% formaldehyde at room temperature using the EZ-Magna ChIPTM Chromatin Immunoprecipitation Kit (Millipore, USA). The p-STAT3 antibody was obtained from Cell Signaling Technology. The primers used for detecting whether p-STAT3 protein was bound to the SNAI1 promoter were Forward 5'-AGGGGATTGGAGAATTGCATGT-3' and Reverse 5'- CTGGGGGATGCAGCATTTTC-3'. The 282 bp product was separated by electrophoresis and visualized on a 2% agarose gel.
TLX3 expressing plasmid transfection and RNA interference
Human TLX3 was amplified from a HeLa cDNA library and recombined into pCMV-Tag2B vector to create a TLX3 expressing plasmid. TLX3 expressing plasmid was transfected into MHCC97h cells by FuGENE6 to create MHCC97h TLX3 cells, while empty pCMV-Tag2B vector was transfected into MHCC97h cells to create MHCC97h Vector cells. Geneticin at a dose of 500 μg/mL for two weeks was used to select both MHCC97h TLX3 cells and MHCC97 Vector cells and obtain stably transfected clones.
Huh7 cells was transfected with siRNA sequences targeting TLX3 using the Lipofectamine RNAi MAX Reagent from Invitrogen (Carlsbad, CA) to create Huh7 TLX3 siRNA cells. The relevant scrambled siRNA sequences were transfected into Huh7 cells to create Huh7 Scr siRNA cells. Similarly, MHCC97h cells were transfected with STAT3 siRNAs (MHCC97h STAT3 siRNA) or scrambled siRNAs (MHCC97h Scr siRNA) respectively. The effect of RNA interference was confirmed by both qRT-PCR and Western immunoblotting. Subsequent experiments were performed at 48 h after siRNA transfection.
Microarray gene expression profiling
Total RNAs were isolated from MHCC97h TLX3 and MHCC97h Vector cells by Trizol and examined using the human GeneChip Primeview gene expression array platform (Affymetrix) by Shanghai GENECHEM CO. (Shanghai, China). The relative expression data was analyzed using PathArrayTM to identify the biological pathways modulated downstream of TLX3 in HCC cells.
Wound healing assay and invasion assay
The wound healing assay was carried out to measure the migration capacity of HCC cells. Briefly, HCC cells were seeded at 1 × 10⁶/well into 6-well plates and cultured overnight. A 1000-μl pipette tip was used to create a cell monolayer wound. After an additional 48h in culture, the gap was photographed and the migration distance was measured. A Transwell chamber coated with Matrigel was used for the invasion assay. HCC cells (5 × 10⁴/well) were plated in the upper chamber incubated with DMEM with 1% FBS, while the lower chamber was filled with DMEM medium with 10% FBS medium to attract invading HCC cells. After 24 h in culture, HCC cells that had penetrated the Matrigel-coated membranes and migrated into the lower chamber were stained with crystal violet (0.1%) and counted.
Luciferase reporter assay
After bio-information analysis, four different SNAI1 promoter fragments were reconstituted into the pGL3-basic luciferase reporter vector, including pGL3-2000 (-2000~ 0 bp), pGL3-1352 (-1352~ 0bp), pGL3- 802 (-802~ 0 bp) and pGL3-1347 (-1347~ -824 bp). The luciferase reporter assay was conducted as described previously [39].
Cell viability and proliferation detection
The 3-(4, 5-dimethylthiazol-2-yl)-2, 5-diphenyltetrazolium bromide (MTT) assay was used to measure cell viability. For the MTT assay, HCC cells were grown at concentrations of 5 × 10⁴ cells per well in 96-well plates overnight. After removal of the culture medium, 150 μl dimethyl sulfoxide was added to each well. The 96-well plate was shaken for 5 min and optical density was measured at a wavelength of 570 nm using a microplate colorimetric reader. The BrdU incorporation assay was performed to measure cell proliferation using the BrdU ELISA kit from Abcam (MA, USA).
Soft agar colony formation assay
6-well plates were coated with a 1:1 ratio of 1% Agarose and culture medium and solidified for 30 min. HCC cells were plated in 2 ml of medium containing 5% FBS with 0.35% agar at 2 × 10³ cells/well. Pictures of cell colonies growing in the plates were taken after 14 days.
Apoptosis detection
Both the Annexin V/PI flow cytometry assay and Caspase 3/7 activity assay were performed to assess cell apoptosis. The flow cytometry assay for apoptosis detection was performed using the Alexa Fluor® 488 annexin V/Dead Cell Apoptosis Kit (Invitrogen, USA) and the Apo-ONE® Homogeneous Caspase-3/7 Assay kit (Promega, USA) was used for measuring Caspase 3/7 activity.
In vivo HCC xenograft experiments
A total of 36 4-6-week-old male nude mice were used in two different in vivo experiments. MHCC97h TLX3 cells or MHCC97h Vector cells were subcutaneously inoculated into 6 nude mice each at a concentration of 5 × 10⁵ cells per mouse respectively. Four weeks after HCC cell injection, all mice were sacrificed by cervical dislocation under anesthesia and xenograft tissues from the 4 group were harvested. The sizes of HCC xenografts were measured every week using calipers and calculated using the following formula: volume = A × B2 × 0.52 (A, length; B, width). Western immunoblotting was performed to detect the expression of TLX3, p-STAT3, SNAI1, E-cadherin, and Vimentin in the xenografted tissues.
To further evaluate whether TLX3 sensitized HCC cells to 5-FU in vivo, we performed portal vein implantation of MHCC97h TLX3 or MHCC97h Vector cells into the livers of nude mice. Subsequently, the test nude mice were injected intraperitoneally with 5-FU at a dose of 8 mg/kg for five consecutive days each week for 4 weeks, while control diluent was injected using the same method for the control group. The protocols for the nude mouse experiments were approved by the Institutional Animal Care and Use Committee of the First Affiliated Hospital of Xi'an Jiaotong University.
Statistical analyses
The relationship of TLX3 expression with the expression of p-STAT3, SNAI1, and Vimentin and E-cadherin was analyzed using the Spearman rank test. The differences of clinical characteristics between high TLX3 and low TLX3 groups were evaluated using the Chi-squared test. The log-rank test was used to compare the Kaplan-Meier survival curves between high TLX3 and low TLX3 expressing groups. All experimental data were presented as standard error of the mean (SEM) and analyzed by Mann-Whitney U or Student t test. A P-value less than 0.05 was considered to be statistically significant.
Results
Down-regulation of TLX3 in HCC tissues predicted worse post-surgical outcome of HCC patients
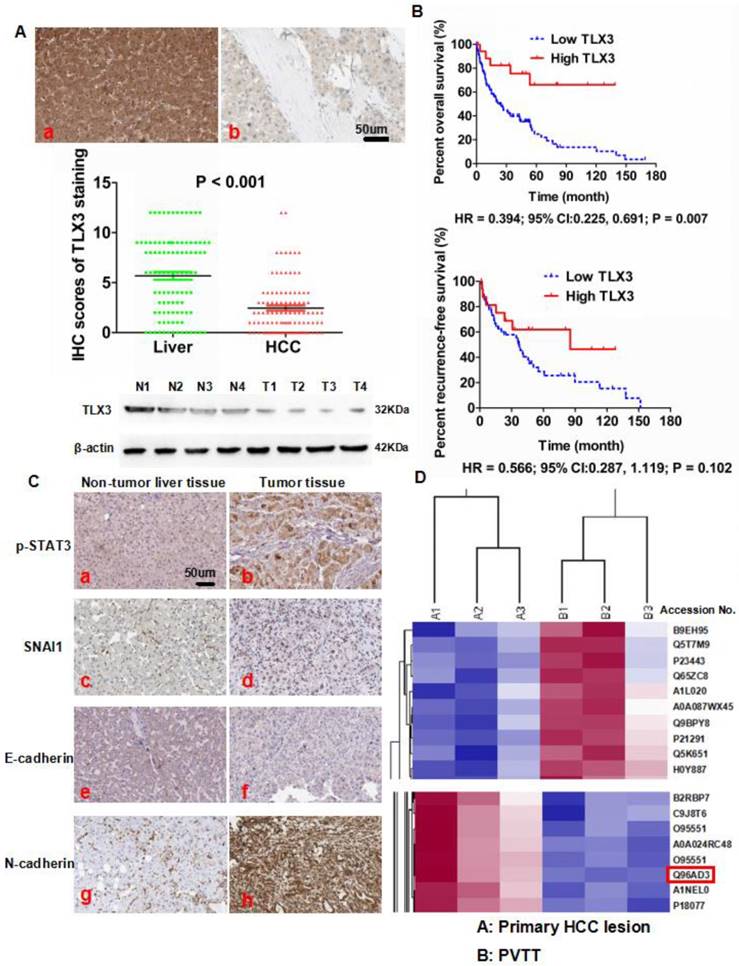
To evaluate the expression of TLX3 in HCC, we first detected TLX3 expression in both tumor and adjacent liver tissues from 100 HCC patients by IHC staining. We found that TLX3 protein was located in both the nucleus and cytoplasm and the majority of HCC cases (72/100, 72%) had lower TLX3 expression in tumor tissue compared to matched adjacent liver tissue (Fig. 1A). The mean TLX3 expression in adjacent liver tissues (5.68) was 2.32-fold higher than the mean expression in tumor tissues (2.45). To confirm the results of the IHC staining, TLX3 expression was observed in 4 pairs of HCC and matched liver tissues by Western immunoblotting, which showed that TLX3 expression was remarkably decreased in HCC tissues in contrast to matched liver tissues (Fig. 1A). Analysis of the relationship between TLX3 expression in HCC tissues and clinical features showed that low TLX3 expression in HCC tissues was associated with HBV infection (93.1% vs. 71.4%, P = 0.004), larger tumor diameter (61.1% vs. 39.3%, P = 0.049), liver cirrhosis (91.7% vs. 71.4%, P = 0.009), high Edmonson-Steiner classification (76.4% vs. 53.6%, P = 0.025), advanced TNM stage (37.5% vs. 14.3%, P = 0.024), portal vein invasion (27.8% vs. 3.6%, P = 0.008), and intra-hepatic metastases (20.8% vs. 3.6%, P = 0.035). The 87 HCC patients with follow-up information were divided into two groups a High TLX3 group and a Low TLX3 group using the ratio of TLX3 expression in HCC/adjacent liver tissues as the cut-off value. High TLX3 group contained HCC patients with higher TLX3 expression in tumor tissue, whereas Low TLX3 group included patients with lower or none TLX3 expression in tumor tissues. Low TLX3 expression in HCC tissues was associated with worse post-surgical over-all survival (Kaplan Meier HR = 2.54; 95% CI:1.45, 4.35; P = 0.007, Fig. 1B). But there was no significant difference found for patients from both groups in recurrence-free survival time (HR = 0.57; 95% CI:0.29, 1.12; P = 0.10, Fig. 1B). After univariate analysis, it was found that advanced TNM staging, portal vein invasion, intra-hepatic metastases and lower TLX3 expression in HCC tissues were the poor prognostic factors. And by multivariate analysis, portal vein invasion, intra-hepatic metastases and lower TLX3 expression in HCC tissues were identified as the independent post-surgical prognostic factors for HCCs (Table 2). To further determine the predictive effect of TLX3 in HCC patients, we searched the The Cancer Genome Atlas (TCGA) database. As shown in Supplementary Fig. 1A, using the ratio of TLX3 expression in HCC/adjacent liver tissues as the cut-off value, HCC patients with lower TLX3 expression in HCC tissues than adjacent liver tissues suffered from the unfavorable survival compared to those with higher TLX3 expression (P = 1.4 e-8). Similarly, using the median value of TLX3 expression in HCC tissues as the cut-off value, HCCs with higher TLX3 in HCC tissues had the better survival (P = 2.5 e-03, Supplementary Fig. 1B).
Aberrant decreased expression of TLX3 was found in HCC tissues and predicted poor post-surgical prognosis of HCCs. (A) IHC staining showed that there was more TLX3 expression in adjacent liver tissues (a) compared to HCC tissues (b), which was also confirmed by Mann-Whitney U test. Western immunoblotting also displayed that TLX3 expression was decreased in tumor tissues from 4 HCC patients compared to matched adjacent liver tissues; (B) Decreased expression of TLX3 in tumor tissues predicted more rapid tumor recurrence and shorter survival time of HCC patients after surgical resection; (C) IHC staining assay showed that there was more expression of p-STAT3, SNAI1 and N-cadherin, and less E-cadherin expression in HCC tissues in contrast to adjacent liver tissues; (D) ITRAQ quantitative proteomic profiling revealed that there was less TLX3 protein (accession No.: Q96AD3) expression in primary HCC lesion than PVTT.
Cox proportional-hazard regression analysis of the correlation between clinicopathologic parameters and overall post-surgical survival rate of HCC Patients
| Clinicopathologic parameter | Unvariate Analysis | Multivariate Analysis | ||
|---|---|---|---|---|
| RR (95% CI) | p-Value | RR (95% CI) | p-Value | |
| Portal vein invasion | 3.625 (2.158 - 5.639) | 0.011 | 2.352 (1.564 - 4.398) | 0.029 |
| Intra-hepatic metastases | 4.017 (2.579 - 6.581) | 0.007 | 2.622 (1.902 - 5.478) | 0.018 |
| Lower TLX3 expression in HCC tissues | 3.018 (1.957 -5.877) | 0.015 | 1.939 (1.157 - 4.028) | 0.022 |
The iTRAQ/2D-LC-MS/MS assays showed less TLX3 expression (Accession No.: Q96AD3) in PVTT tissues than in the primary HCC tissues. The ratio of TLX3 in PVTT/primary HCC lesions was 0.79 (P = 0.007, Fig. 1D). Thus, TLX3 may exert a critical anti-metastatic effect in HCC.
Forced expression of TLX3 negatively regulated IL-6/STAT3 signaling and consequently repressed the EMT phenotype of HCC cells
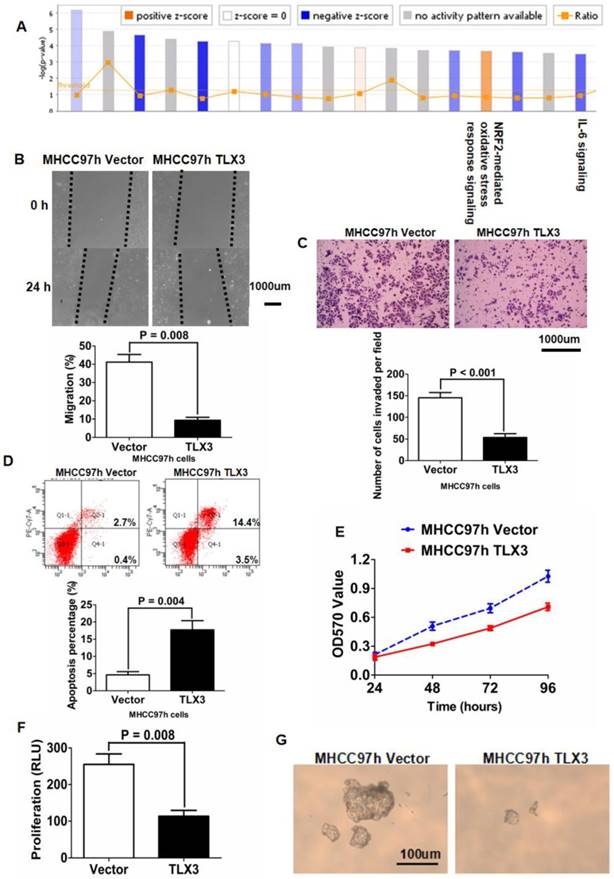
TLX3 mRNA and protein expression were examined in 5 HCC cell lines (Huh7, MHCC97h, HepG2, Hep3B, SK Hep1) and the normal hepatocyte line LO2 using qRT-PCR and Western immunoblotting. LO2 cells had notably more TLX3 expression compared with the 5 HCC cell lines (Supplementary Fig. 2A). Of the HCC cell lines, MHCC97h cells expressed the lowest level of TLX3, while Huh7 and Hep3B cells had the highest level of TLX3 expression. To explore the function of TLX3 in HCC chemoresistance and metastases, we transfected a TLX3-expressing plasmid into MHCC97h cells and isolated MHCC97h TLX3 cells stably expressing high levels of TLX3 as assessed by both qRT-PCR and Western immunoblotting, compared to Vector-transfected MHCC97h cells (Supplementary Fig. 2B). Gene expression microarray analyses performed on both MHCC97h TLX3 and MHCC97h Vector cells followed by PathArrayTM analysis revealed that enhanced expression of TLX3 substantially repressed acute phase response signaling (Z-score: -2.683) and activated NRF2-mediated oxidative stress response signaling (Fig. 2A). IL-6/STAT3 signaling was significantly inhibited (Z-score: -2.065) and there was decreased expression of genes downstream of IL-6/STAT3, including MAP2K6, CXCL8, IL1A, TNFAIP6, FGFR1, MAPK9, MAPK13, JUN, NFKBIA, AKT3, IL1B, CD14, and MAP4K4 (Table 3). Over-expression of TLX3 also led to repression of SNAI1 (Fold Change: -1.761; P = 0.001), N-cadherin (Fold Change: -2.814; P < 0.001), and Vimentin (Fold Change: -1.330; P < 0.001) whereas E-cadherin expression was increased (Fold Change: 1.108; P = 0.047). Next, we examined the association between TLX3 expression and p-STAT3 and EMT markers by IHC of resected human HCCs. Spearman rank analysis of IHC staining for these markers in tumor specimens from 100 HCC patients confirmed that TLX3 expression in HCC tissues was negatively associated with p-STAT3 (r = -0.220, P = 0.028, Supplementary fig. 1C), SNAI1 (r = -0.238, P = 0.017, Supplementary fig. 1D), and Vimentin (r = -0.337, P <0.001, Supplementary fig. 1E). In contrast, there was a positive relationship between TLX3 and E-cadherin (r = 0.712, P <0.001, Supplementary fig 1F). Consistent with their negative association with TLX3 expression, there was a significant positive correlation between p-STAT3 expression and SNAI1 expression in HCC tissues (Supplementary fig. 1G).
TLX3 overexpression repressed IL-6/STAT3 pathway and attenuated cell migration, invasion, viability, proliferation and colony formation abilities of MHCC97h cells. (A) After analyzing data of gene expression microarray by PathArrayTM system, enhanced expression of TLX3 was found to inhibit IL-6/STAT3 pathway in MHCC97h cells significantly; (B) Scratch wound healing assay showed that migration capacity of MHCC97h cells was restrained by TLX3 overexpression apparently; (C) Transwell chamber coated with Matrigel assay confirmed that overexpression of TLX3 inhibited invasion capacity of MHCC97h cells clearly; (D) Cell apoptosis of MHCC97h cells was strengthened by TLX3 overexpression notably, which was found by flow cytometry assay; (E) MTT assay showed that cell viability of MHCC97h cells was decreased remarkably by TLX3 over-expression; (F)ELISA assay revealed that there was more BrdU incorporation in MHCC97h Vector cells than MHCC97h TLX3 cells; (G) Soft agar colony formation assay demonstrated that colony formation of MHCC97h cells was repressed by enhanced expression of TLX3 magnificently.
The expression of downstream genes of IL-6/STAT3 signaling detected by gene expression microarray assay
| Gene Symbol | Fold Change | P-value |
|---|---|---|
| MAP2K6 | 2.476072115 | 4.13711E-05 |
| CXCL8 | -141.4717319 | 6.49205E-12 |
| IL1A | -14.98998118 | 7.43658E-09 |
| TNFAIP6 | -21.99494365 | 4.94713E-08 |
| FGFR1 | -3.103207139 | 6.15391E-08 |
| MAPK9 | -2.727041522 | 4.58303E-06 |
| MAPK13 | -6.29875487 | 1.05138E-08 |
| JUN | -2.823575745 | 0.000579908 |
| NFKB1 | -1.270881926 | 0.004134772 |
| AKT3 | -2.745882706 | 1.62193E-06 |
| IL1B | -6.078702164 | 9.18348E-08 |
| CD14 | -20.4976034 | 7.59414E-10 |
| MAP4K4 | -2.152669243 | 0.000114873 |
Based on the results of these microarray assays, we hypothesized that TLX3 promotes the epithelial phenotype of HCC cells by modulating the IL-6/STAT3/SNAI1 axis. As shown in Fig. 2B, the wound healing assay demonstrated that the migration capacity of MHCC97h cells was markedly inhibited by TLX3 over-expression. The invasive ability of MHCC97h cells was also repressed in MHCC97h TLX3 cells compared with MHCC97h Vector cells, as assessed by the Transwell chamber assay with Matrigel (Fig. 2C). Consistent with these antitumor effects, TLX3 also enhanced cell apoptosis (Fig. 2D), and decreased cell viability (Fig. 2E), proliferation (Fig. 2F) and colony formation capacities (Fig. 2G). Western immunoblotting assay displayed that there was more E-cadherin expression and less expression of N-cadherin, Vimentin, p-STAT3 and SNAI1 in MHCC97h TLX3 cells than in MHCC97h Vector cells (Fig. 3A). Double immunofluorescence labeling assay also showed that MHCC97h TLX3 cells expressed more E-cadherin and less Vimentin than MHCC97h Vector cells (Fig. 3B).
TLX3 over-expression reversed EMT of MHCC97h cells and inhibited growth of HCC xenografts. (A) As assessed by Western immunoblotting, it was found that enforced expression of TLX3 increased E-cadherin expression and decreased expression of SNAI1, N-cadherin, and Vimentin in MHCC97h cells, while TLX3 over-expression weaken STAT3 phosphorylation distinctly; (B) Double-label immunofluorescent staining assay showed that there was more E-cadherin (green) expression and less Vimentin (red) expression in MHCC97h TLX3 cells than MHCC97h Vector cells; (C) TLX3 over-expression repressed the growth of HCC xenografts apparently; (D) HCC xenografts was examined by Western immunoblotting and it was found that xenografts driven from MHCC97h TLX3 cells had more E-cadherin expression and less expression of Vimentin, SNAI1 and p-STAT3, which suggested that TLX3 over-expression repressed phosphorylation of STAT3 and EMT in vivo.
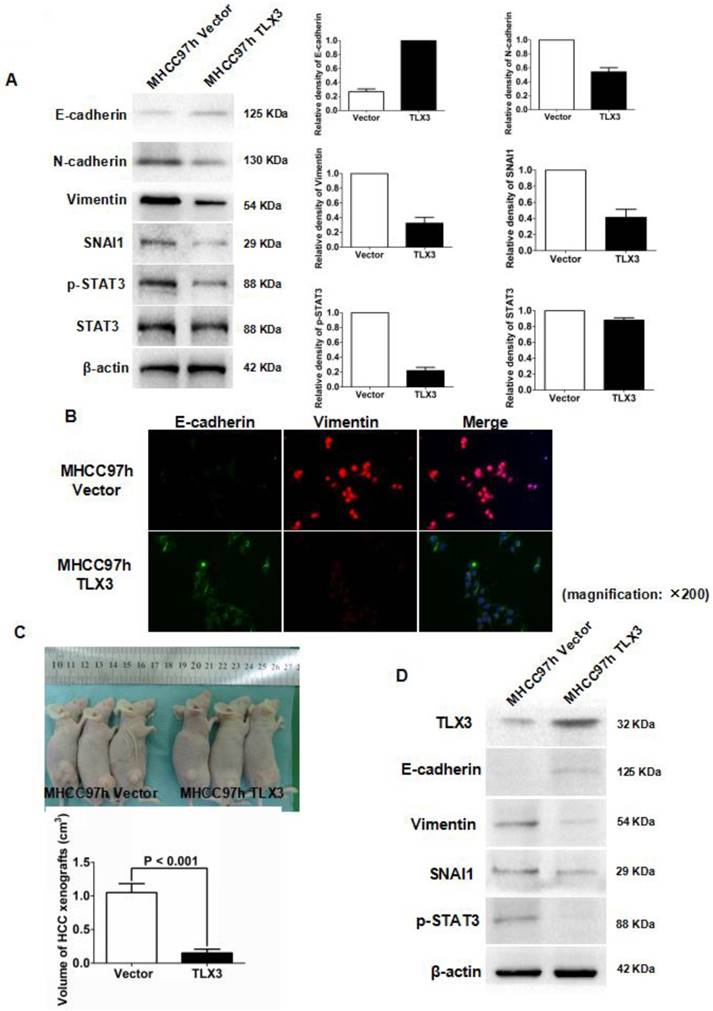
To address the effect of TLX3 on the growth of HCC cells in vivo, MHCC97h TLX3 cells and MHCC97h Vector cells were implanted subcutaneously into nude mice. As shown in Fig.3C, the volumes of HCC xenografts derived from MHCC97h TLX3 cells were smaller than those from MHCC97h Vector cells. In MHCC97h TLX3 xenografts compared to xenografts derived from MHCC97h Vector cells, in addition to increased TLX3 expression, there was increased E-cadherin and decreased p-STAT3, SNAI1, and Vimentin expression (Fig. 3D). These data strongly suggest that TLX3 overexpression reversed the EMT phenotype and inhibited HCC tumor growth.
Knockdown of TLX3 by siRNA resulted in EMT-like changes in HCC cells
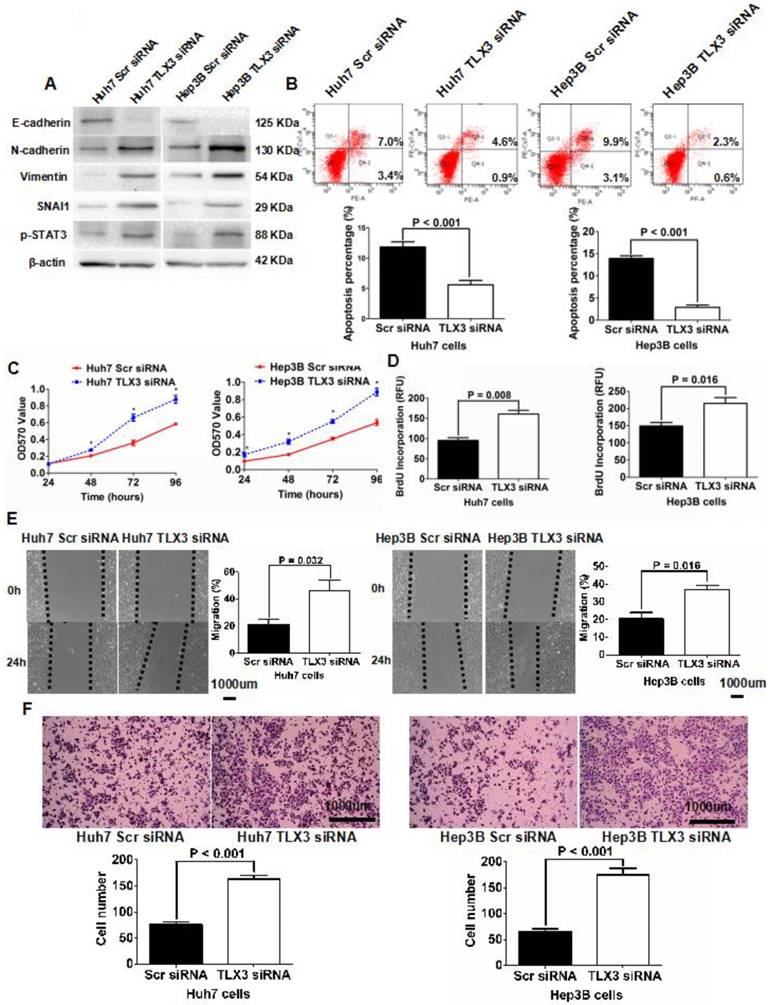
To further examine the role of TLX3 in mediating the EMT phenotype and chemoresistance of HCC cells, we repressed expression of TLX3 in both Huh7 and Hep3B cells via transfection with siRNAs targeting TLX3 sequences, which was confirmed by both qRT-PCR and Western immunoblotting assays (Supplementary Fig. 2C and 2D). Along with suppression of TLX3 expression, compared to control cells, both TLX3 siRNA transfected Huh7 and Hep3B cells displayed EMT-like expression profiles and cellular features including down-regulation of E-cadherin, and up-regulation of SNAI1, N-cadherin and Vimentin (Fig. 4A), suppression of cell apoptosis (Fig. 4B) and enhancement of cell viability (Fig. 4C), proliferation (Fig. 4D), migration (Fig. 4E) and invasion (Fig. 4F). Knockdown of TLX3 also resulted in increased expression of p-STAT3 in both Huh7 and Hep3B cells (Fig. 4A).
Silencing TLX3 increased STAT3 phosphorylation and induced EMT in HCC cells, while abating cell apoptosis and up-regulating cell viability, proliferation, migration and invasion. (A) Western immunoblotting assay displayed that knockdown of TLX3 increased expression of N-cadherin, Vimentin, SNAI1 and p-STAT3 whereas decreased E-cadherin expression significantly in both Huh7 and Hep3B cells; (B) Annexin V/PI flow cytometry assay showed that down-regulation of TLX3 attenuated cell apoptosis in both Huh7 and Hep3B cells; (C) Cell viability of both Huh7 and Hep3B cells was found by MTT assay to be accentuated by knockdown of TLX3; (D) BrdU ELISA assay showed that TLX3 repression resulted in up-regulation of cell proliferation in both Huh7 and Hep3B cells; (E) As assessed by Scratching wound healing assay, it was found that cell migration of both Huh7 and Hep3B cells was increased by knockdown of TLX3; (F) Invasion capacity of Huh7 cells was found reinforced by silencing TLX3 by Transwell assay. The similar results was obtain in Hep3B cells.
Enhanced expression of TLX3 sensitized HCC cells to 5-FU
5-FU has been used to treat HCC patients at the different stages as a component of both systemic and locoregional chemotherapy. Due to the inherent and acquired chemoresistance, 5-FU-based chemotherapy for HCC has not been shown to be highly effective. The EMT phenotype has been implicated in the phenomenon of chemoresistance of HCCs. Because TLX3 was found to reverse the EMT phenotype of HCC cells, we proposed the hypothesis that TLX3 could sensitize HCC cells to treatment with 5-FU through inhibition of the EMT. To determine the optimal therapeutic concentration, we treated MHCC97h cells with different concentrations of 5-FU for 48 h. As shown in Fig. 5A, MTT assays showed that treatment with 5-FU decreased the viability of MHCC97h cells in a dose-dependent manner. 20 μM was the lowest concentration at which 5-FU treatment resulted in marked suppression of HCC cell viability. As shown by Annexin V/PI flow cytometry assay, the apoptotic index was increased 43% by 5-FU treatment in MHCC97h TLX3 cells, while cell apoptosis of MHCC97h vector cells was enhanced 9% by 5-FU treatment (Fig. 5B). Measurement of caspase 3/7 activity also confirmed that there were more apoptotic cells induced by 5-FU treatment in MHCC97h TLX3 cells than in MHCC97h Vector cells (Fig. 5C). MTT proliferation assay displayed that MHCC97h Vector cells were more viable in contrast to MHCC97h TLX3 cells after 5-FU treatment (Fig. 5D).
TLX3 sensitized HCC cells to 5-FU. (A) MTT assay showed that 20μm was the lowest concentration at which 5-FU treatment caused the significantly repression of MHCC97h cell viability; TLX3 over-expression was found to strengthen the pro-apoptotic function of 5-FU treatment on MHCC97h cell by both annexin V/PI flow cytometry assay(B) and Caspase 3/7 activity assay (C); Consistently, TLX3 over-expression was confirmed to enhance the inhibitory effect of 5-FU treatment on MHCC97h cell viability by MTT assay (D); Orthotopic HCC models established by portal vein implantation of MHCC97h showed that TLX3 over-expression enhanced the anti-HCC activity of 5-FU treatment dramatically in vivo.
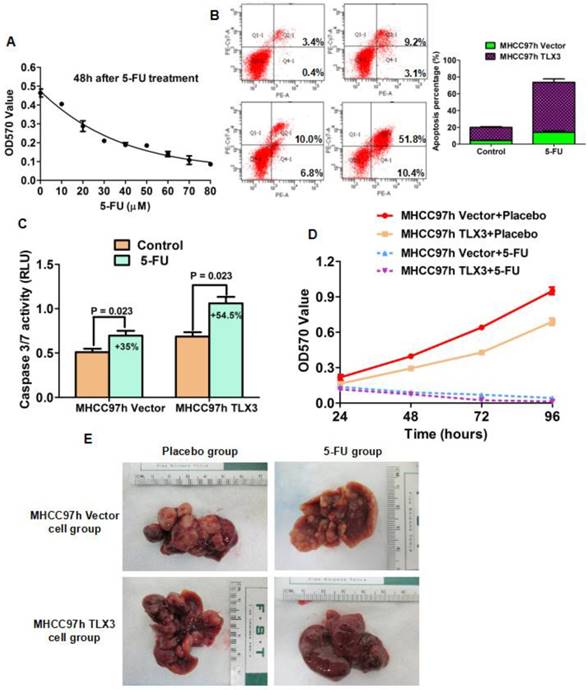
Consistent with the results of the subcutaneous HCC mouse model, an orthotopic implantation model of HCC showed fewer xenografts with smaller volumes derived from MHCC97h TLX3 cells with treated with placebo compared to MHCC97h Vector cells treated with placebo (Fig. 5E). Additionally, it confirmed that TLX3 enhanced the chemosensitivity of HCCs to 5-FU in vivo.
TLX3 attenuated IL-6/STAT3 signaling by binding directly to STAT3
IHC staining of HCC tissues showed a negative correlation between TLX3 and p-STAT3 expression. Therefore, we investigated whether TLX3 negatively regulates the IL-6/STAT3 pathway in HCC cells. Forced expression of TLX3 led to decreased expression of p-STAT3 in MHCC97h cells. Further, treatment of MHCC97h TLX3 cells with IL-6 did enhance STAT3 phosphorylation (Fig. 6A). In contrast, Huh7 TLX3 siRNA cells showed higher p-STAT3 protein expression than Huh7 Scr siRNA cells, and knockdown of TLX3 enhanced the effect of IL-6 treatment on STAT3 phosphorylation (Fig. 6A). To determine whether TLX3 directly interacts with STAT3, co-immunoprecipitation was performed using antibody against TLX3 in lysates from MHCC97h TLX3 cells. As shown in Fig. 6B, exogenous TLX3 protein was found to be bound to STAT3 protein in MHCC97h TLX3 cells. To confirm the interaction between TLX3 and STAT3 proteins, co-immunoprecipitation was also conducted in Huh7 cells which expressed endogenous TLX3 protein at a relatively high level. As shown in Fig. 6B, endogenous TLX3 protein was also shown to be bound to STAT3 protein in Huh7 cells.
TLX3 blocked IL-6-induced phosphorylation of STAT3 through binding with STAT3 protein directly and then restrained SNAI1 expression. (A) over-expression of TLX3 weakened phosphorylation of STAT3 induced by IL-6 treatment, while silencing TLX3 strengthened the positive regulatory effect of IL-6 treatment on STAT3 phosphorylation notably; (B) CO-IP assay confirmed that TLX3 protein was bound with STAT3 protein directly in both MHCC97h and Huh7 cells; (C) After searching UCSC Genome Browser, 11 potential p-STAT3 DNA binding sites was found in the promoter of SNAI1; (D) ChIP assay verified that p-STAT3 was bound directly with the -1301~-846 bp of SNAI1 promoter fragment.
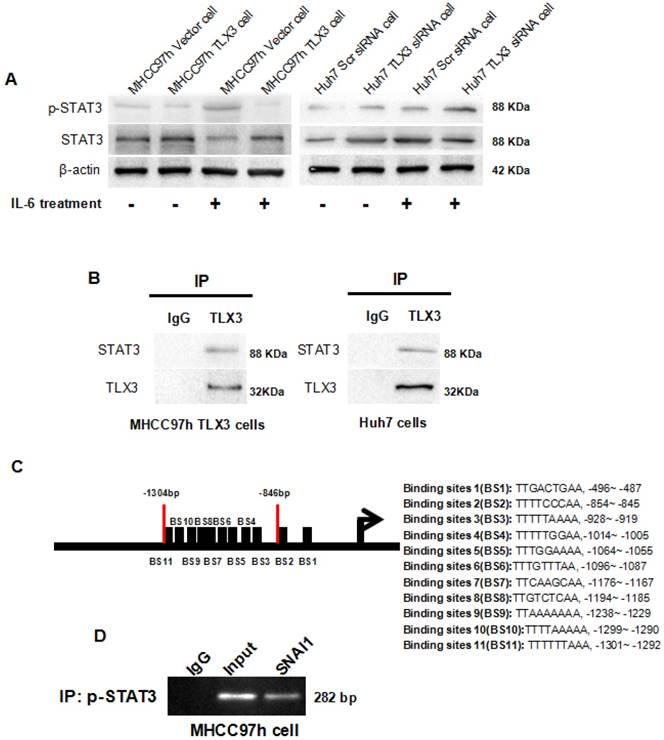
IL-6/STAT3 pathway induced EMT phenotype via promoting SNAI1 transcription in HCC cells
IL-6/STAT3 signaling has been implicated in the induction of EMT in a variety of cancers [40, 41]. However, the mechanism underlying the process is not completely understood. Kim et al. previously proposed that IL-6/JAK/STAT3 signaling accelerated EMT by up-regulating SNAI1 in HCC cells, but they did not determine how STAT3 regulated SNAI1 expression. By bio-informatics analysis, we identified 11 potential p-STAT3 DNA binding sites in the SNAI1 promoter region (Fig. 6C). Of these, 9 of the 11 candidate p-STAT3 DNA binding sites were located in the region of -1301~-846 bp upstream of the promoter. Based on this observation, we designed primers and performed a ChIP assay which confirmed that p-STAT3 protein was bound to the SNAI1 promoter within the -1301~-846 bp region in wild type MHCC97h cells, as shown in Fig. 6D. To address whether IL-6/STAT3 signaling mediated SNAI1 expression in HCC, we treated Huh7 cells with recombinant human IL-6 protein; the expression of both p-STAT3 and SNAI1 was increased, with concomitant up-regulation of both N-cadherin and Vimentin and repression of E-cadherin (Supplementary Fig. 3A). IL-6 also promoted cell migration and invasion of Huh7 cells (Supplementary Fig. 3B and 3C). Next, siRNA sequences targeting STAT3 were transfected into Huh7 cells and both qRT-PCR and Western immunoblotting assays confirmed the suppression of STAT3 in Huh7 cells (Supplementary Fig. 3D). After knockdown of STAT3, IL-6 treatment did not induce SNAI1 up-regulation and the EMT phenotype (Supplementary Fig. 3E). These data demonstrated that IL-6/STAT3 signaling mediated an EMT process driven by SNAI1. By ChIP assay, a -1301~-846 bp SNAI1 promoter fragment was identified as the p-STAT3 protein DNA-binding site. To test the functional effects of this promoter fragment, the -1301~-1 bp sequence upstream of the SNAI1 promoter was cloned into the pGL3-basic luciferase reporter vector. As assessed by a luciferase reporter assay, IL-6 treatment induced a significant increase in SNAI1 promoter activity (Supplementary Fig. 3F). However, silencing STAT3 by siRNA transfection attenuated the influence of IL-6 treatment on SNAI1 promoter activity (Supplementary Fig. 3F). Thus, the IL-6/STAT3 pathway appears to directly increase SNAI1 expression and then consequently induce the EMT phenotype.
Discussion
The EMT has been proposed to contribute to increased metastatic activity and chemoresistance of HCC cells, leading to poorer prognosis of HCC patients. It is therefore important to elucidate the underlying regulatory mechanisms in order to establish novel and effective targets for HCC treatment. Thus far, there have been few studies of the role of TLX3 in carcinogenesis [30, 31, 42]. Intriguingly, Tada et al. found that knockdown of TLX3 increased the resistance of bladder cancer cells to cisplatin, which suggested that aberrant down-regulation of TLX3 in cancer cells was involved in chemoresistance[42]. In this study, TLX3 was found to be frequently down-regulated in HCC tissues compared with adjacent liver tissues. Further, HCC cases with higher tumor TLX3 expression had better prognosis after liver resection and were less likely to have unfavorable clinical features such as larger tumor diameter, liver cirrhosis, high Edmonson-Steiner classification, advanced TNM stage, portal vein invasion, and intra-hepatic metastases. And multivariate analysis displayed that portal vein invasion, intra-hepatic metastases and lower TLX3 expression in HCC tissues were the independent post-surgical prognostic factors for HCCs. iTRAQ-based proteomic analysis also found that TLX3 expression was significantly lower in PVTT than in primary HCC tumors. Moreover, TLX3 expression in HCC tissues was positively associated with E-cadherin expression and negatively correlated with the EMT markers SNAI1, N-cadherin and Vimentin. These findings implied that TLX3 might exert anti-tumor effects on HCC progression through suppression of SNAI1-driven EMT. Furthermore, by gene expression microarray assay, forced expression of TLX3 was found to result in upregulation of E-cadherin and down-regulation of SNAI1, N-cadherin, and Vimentin, suggesting that TLX3 may reverse the EMT phenotype of HCC cells. Additional in vitro and in vivo experiments showed that TLX3 inhibited the cell growth, proliferation, migration and invasion of HCC cells and confirmed the anti-tumor effect of TLX3 in HCC. Enhanced expression of TLX3 suppressed SNAI1 expression in HCC cells with accompanying inhibition of the EMT. Silencing of TLX3 also confirmed that TLX3 expression inhibited the EMT of HCC cells. In addition, in both in vitro and in vivo experiments, TLX3 was found to sensitize HCC cells to 5-FU. Hence, inhibition of the EMT by TLX3 sensitized the treatment of 5-FU to HCC cells.
IL-6 is a multifunctional cytokine which is involved in immune responses, cell survival, apoptosis and proliferation in diverse diseases, including cancers[43]. A growing body of evidence has shown that IL-6 is released in response to viral hepatitis infection and systemic inflammation in the liver [44-47]. As a potent activator of STAT3, IL-6 exerts its biological functions by interacting with IL-6Rα on the cell surface, triggering the formation of a gp130 signaling complex, activating JAKs, and in turn increasing gp130 phosphorylation, which then recruits and phosphorylates cytosolic STAT3 protein. Phosphorylated STAT3 trans-locates to the cell nucleus and binds to the promoters of down-stream targets responsible for cancer cell proliferation, survival, suppression of the anti-tumor immune response, angiogenesis, and metastasis. IL-6/STAT3 signaling has been found to induce EMT in HCC cells, however, the underlying mechanism is incompletely understood. We found that the IL-6/STAT3 pathway is substantially inhibited by over-expression of TLX3 in MHCC97h cells. IHC staining assay of HCC tissues showed a negative relationship between TLX3 and p-STAT3 expression, and positive association between p-STAT3 and SNAI1 in HCC tissues. These data suggested that TLX3 could abolish SNAI1 up-regulation driven by IL-6/STAT3 signaling. Next, we showed that forced expression of TLX3 resulted in the decrease of p-STAT3 expression. By Co-IP assay, TLX3 was found to interact directly with endogenous STAT3 protein in Huh7 cells and with exogenous STAT3 protein in MHCC97h cells. These findings support the hypothesis that TLX3 restrains STAT3 phosphorylation by directly binding the STAT3 protein, and consequently inactivating IL-6/STAT3 signaling.
To further clarify the mechanism by which TLX3 attenuates the HCC EMT, we assessed the expression of both TLX3 and SNAI1 in HCC tissues and found a significant negative correlation between TLX3 and SNAI1. Since TLX3 acts as a transcription factor, we performed ChIP-sequencing, but found no SNAI1 promoter fragments in the DNA pool bound to TLX3. However, we found that IL-6 treatment increased the expression of both p-STAT3 and SNAI1. By bioinformatic analysis we identified several potential STAT3 binding sites in the SNAI1 promoter; subsequent ChIP assay with a p-STAT3 antibody confirmed that p-STAT3 protein was bound to the region -1301~-846 bp of the SNAI1 promoter. These results strongly suggest a pathway in which IL-6 accelerates STAT3 phosphorylation, and in turn, p-STAT3 directly augments SNAI1 transcription, which then induces the EMT phenotype of HCC cells. Inhibition of SNAI1 expression by TLX3 then serves to block the EMT in HCC.
In summary, this study shows that TLX3 is aberrantly repressed in HCC tissues and HCC cell lines. Overexpression of TLX3 represses HCC cell growth and metastasis both in vitro and in vivo. Moreover, TLX3 sensitizes HCC cells to 5-FU in association with suppression of the EMT. TLX3 was shown to prevent the activation of IL-6/STAT3 pathway by binding to STAT3 protein rather than through a direct function as a transcription factor. The IL-6/STAT3 pathway was verified to induce the EMT through direct up-regulation of SNAI1. TLX3 inhibits the EMT by blocking the IL-6/STAT3/SNAI1 pathway in HCC cells and thus exerted an anti-tumoral effect in HCC by inhibiting cell growth, migration and invasion, and by senisitizing tumor cells to 5-FU. Further investigations should explore the significance TLX3 action in clinical therapy and prognostic prediction for HCC patients.
Abbreviations
TLX3: T-cell leukemia homeobox 3; HCC: Hepatocellular carcinoma; IHC: Immunohisto-chemistry; STAT3: Signal Transducer and Activator of Transcription; TNM: Tumor-node-metastasis; IP: Immunoprecipitation; ChIP: Chromatin immune-precipitation; EMT: Epithelial-mesenchymal transition; qRT-PCR: Quantitative reverse-transcription-polymerase chain reaction; PBS: Phosphate Buffered Saline; FBS: Fetal bovine serum; iTRAQ: Isobaric tag for relative and absolute quantitation.
Supplementary Material
Supplementary figures and tables.
Acknowledgements
This study was supported by grants from Y (81301743 and 81572733 to Xin Zheng), Research Fund for the doctoral Program of High Education of China from Ministry of Education (No. 20120201120090 to Xin Zheng), Key Science and Technology Program of Shaanxi Province (No. 2014K11-01-01-21 and 2016SF-206 to Xin Zheng) and the Fundamental Research Funds for the Basic Research Operating expenses Program of Central College sponsored by Xi'an Jiaotong University to Xin Zheng.
Competing Interests
The authors have declared that no competing interest exists.
References
1. Torre LA, Bray F, Siegel RL, Ferlay J, Lortet-Tieulent J, Jemal A. Global cancer statistics, 2012. CA Cancer J Clin. 2015;65:87-108
2. Kudo M, Matsui O, Izumi N, Iijima H, Kadoya M, Imai Y. et al. JSH Consensus-Based Clinical Practice Guidelines for the Management of Hepatocellular Carcinoma: 2014 Update by the Liver Cancer Study Group of Japan. Liver Cancer. 2014;3:458-68
3. Song P, Tang W, Hasegawa K, Kokudo N. Systematic evidence-based clinical practice guidelines are ushering in a new stage of standardized management of hepatocellular carcinoma in Japan. Drug Discov Ther. 2014;8:64-70
4. Roayaie S, Jibara G, Tabrizian P, Park JW, Yang J, Yan L. et al. The role of hepatic resection in the treatment of hepatocellular cancer. Hepatology. 2015;62:440-51
5. Colecchia A, Schiumerini R, Cucchetti A, Cescon M, Taddia M, Marasco G. et al. Prognostic factors for hepatocellular carcinoma recurrence. World J Gastroenterol. 2014;20:5935-50
6. Kim JH, Sohn BH, Lee HS, Kim SB, Yoo JE, Park YY. et al. Genomic predictors for recurrence patterns of hepatocellular carcinoma: model derivation and validation. PLoS Med. 2014;11:e1001770
7. Nieto MA. Epithelial plasticity: a common theme in embryonic and cancer cells. Science. 2013;342:1234850
8. Nieto MA. The ins and outs of the epithelial to mesenchymal transition in health and disease. Annu Rev Cell Dev Biol. 2011;27:347-76
9. Chapman HA. Epithelial-mesenchymal interactions in pulmonary fibrosis. Annu Rev Physiol. 2011;73:413-35
10. Ye X, Weinberg RA. Epithelial-Mesenchymal Plasticity: A Central Regulator of Cancer Progression. Trends Cell Biol. 2015;25:675-86
11. Garofalo M, Croce CM. Role of microRNAs in maintaining cancer stem cells. Adv Drug Deliv Rev. 2015;81:53-61
12. Mitra A, Yan J, Xia X, Zhou S, Chen J, Mishra L. et al. IL6-mediated inflammatory loop reprograms normal to epithelial-mesenchymal transition+ metastatic cancer stem cells in preneoplastic liver of transforming growth factor beta-deficient beta2-spectrin+/- mice. Hepatology. 2017;65:1222-36
13. Wu X, Li X, Fu Q, Cao Q, Chen X, Wang M. et al. AKR1B1 promotes basal-like breast cancer progression by a positive feedback loop that activates the EMT program. J Exp Med. 2017
14. Kodama T, Newberg JY, Kodama M, Rangel R, Yoshihara K, Tien JC. et al. Transposon mutagenesis identifies genes and cellular processes driving epithelial-mesenchymal transition in hepatocellular carcinoma. Proc Natl Acad Sci U S A. 2016;113:E3384-93
15. Zheng X, Song T, Dou C, Jia Y, Liu Q. CtBP2 is an independent prognostic marker that promotes GLI1 induced epithelial-mesenchymal transition in hepatocellular carcinoma. Oncotarget. 2015;6:3752-69
16. Zheng X, Vittar NB, Gai X, Fernandez-Barrena MG, Moser CD, Hu C. et al. The transcription factor GLI1 mediates TGFbeta1 driven EMT in hepatocellular carcinoma via a SNAI1-dependent mechanism. PLoS One. 2012;7:e49581
17. Lv Q, Hu JX, Li YJ, Xie N, Song DD, Zhao W. et al. MiR-320a effectively suppresses lung adenocarcinoma cell proliferation and metastasis by regulating STAT3 signals. Cancer Biol Ther. 20170
18. Gamero AM, Young HA, Wiltrout RH. Inactivation of Stat3 in tumor cells: releasing a brake on immune responses against cancer? Cancer Cell. 2004;5:111-2
19. Wong R, Chen W, Zhong X, Rutka JT, Feng ZP, Sun HS. Swelling-induced Chloride Current in Glioblastoma Proliferation, Migration and Invasion. J Cell Physiol. 2017
20. Ye TH, Yang FF, Zhu YX, Li YL, Lei Q, Song XJ. et al. Inhibition of Stat3 signaling pathway by nifuroxazide improves antitumor immunity and impairs colorectal carcinoma metastasis. Cell Death Dis. 2017;8:e2534
21. Peinado H, Olmeda D, Cano A. Snail, Zeb and bHLH factors in tumour progression: an alliance against the epithelial phenotype? Nat Rev Cancer. 2007;7:415-28
22. Tang Y, Feinberg T, Keller ET, Li XY, Weiss SJ. Snail/Slug binding interactions with YAP/TAZ control skeletal stem cell self-renewal and differentiation. Nat Cell Biol. 2016;18:917-29
23. Grande MT, Sanchez-Laorden B, Lopez-Blau C, De Frutos CA, Boutet A, Arevalo M. et al. Snail1-induced partial epithelial-to-mesenchymal transition drives renal fibrosis in mice and can be targeted to reverse established disease. Nat Med. 2015;21:989-97
24. Zheng X, Carstens JL, Kim J, Scheible M, Kaye J, Sugimoto H. et al. Epithelial-to-mesenchymal transition is dispensable for metastasis but induces chemoresistance in pancreatic cancer. Nature. 2015;527:525-30
25. Batlle E, Sancho E, Franci C, Dominguez D, Monfar M, Baulida J. et al. The transcription factor snail is a repressor of E-cadherin gene expression in epithelial tumour cells. Nat Cell Biol. 2000;2:84-9
26. Dong C, Wu Y, Wang Y, Wang C, Kang T, Rychahou PG. et al. Interaction with Suv39H1 is critical for Snail-mediated E-cadherin repression in breast cancer. Oncogene. 2013;32:1351-62
27. Kondo T, Matsuoka AJ, Shimomura A, Koehler KR, Chan RJ, Miller JM. et al. Wnt signaling promotes neuronal differentiation from mesenchymal stem cells through activation of Tlx3. Stem Cells. 2011;29:836-46
28. Indulekha CL, Divya TS, Divya MS, Sanalkumar R, Rasheed VA, Dhanesh SB. et al. Hes-1 regulates the excitatory fate of neural progenitors through modulation of Tlx3 (HOX11L2) expression. Cell Mol Life Sci. 2012;69:611-27
29. Bernard OA, Busson-LeConiat M, Ballerini P, Mauchauffe M, Della Valle V, Monni R. et al. A new recurrent and specific cryptic translocation, t(5;14)(q35;q32), is associated with expression of the Hox11L2 gene in T acute lymphoblastic leukemia. Leukemia. 2001;15:1495-504
30. Cave H, Suciu S, Preudhomme C, Poppe B, Robert A, Uyttebroeck A. et al. Clinical significance of HOX11L2 expression linked to t(5;14)(q35;q32), of HOX11 expression, and of SIL-TAL fusion in childhood T-cell malignancies: results of EORTC studies 58881 and 58951. Blood. 2004;103:442-50
31. Ballerini P, Blaise A, Busson-Le Coniat M, Su XY, Zucman-Rossi J, Adam M. et al. HOX11L2 expression defines a clinical subtype of pediatric T-ALL associated with poor prognosis. Blood. 2002;100:991-7
32. Ferrando AA, Neuberg DS, Staunton J, Loh ML, Huard C, Raimondi SC. et al. Gene expression signatures define novel oncogenic pathways in T cell acute lymphoblastic leukemia. Cancer Cell. 2002;1:75-87
33. Mauvieux L, Leymarie V, Helias C, Perrusson N, Falkenrodt A, Lioure B. et al. High incidence of Hox11L2 expression in children with T-ALL. Leukemia. 2002;16:2417-22
34. Renou L, Boelle PY, Deswarte C, Spicuglia S, Benyoucef A, Calvo J. et al. Homeobox protein TLX3 activates miR-125b expression to promote T-cell acute lymphoblastic leukemia. Blood Adv. 2017;1:733-47
35. Dadi S, Le Noir S, Payet-Bornet D, Lhermitte L, Zacarias-Cabeza J, Bergeron J. et al. TLX homeodomain oncogenes mediate T cell maturation arrest in T-ALL via interaction with ETS1 and suppression of TCRalpha gene expression. Cancer Cell. 2012;21:563-76
36. Zheng X, Yao Y, Xu Q, Tu K, Liu Q. Evaluation of glioma-associated oncogene 1 expression and its correlation with the expression of sonic hedgehog, E-cadherin and S100a4 in human hepatocellular carcinoma. Mol Med Rep. 2010;3:965-70
37. Zheng X, Xu M, Yao B, Wang C, Jia Y, Liu Q. IL-6/STAT3 axis initiated CAFs via up-regulating TIMP-1 which was attenuated by acetylation of STAT3 induced by PCAF in HCC microenvironment. Cell Signal. 2016;28:1314-24
38. Gai X, Lu Z, Tu K, Liang Z, Zheng X. Caveolin-1 is up-regulated by GLI1 and contributes to GLI1-driven EMT in hepatocellular carcinoma. PLoS One. 2014;9:e84551
39. Gai X, Tu K, Li C, Lu Z, Roberts LR, Zheng X. Histone acetyltransferase PCAF accelerates apoptosis by repressing a GLI1/BCL2/BAX axis in hepatocellular carcinoma. Cell Death Dis. 2015;6:e1712
40. Li H, Rokavec M, Jiang L, Horst D, Hermeking H. Antagonistic Effects of p53 and HIF1A on microRNA-34a Regulation of PPP1R11 and STAT3 and Hypoxia-induced Epithelial to Mesenchymal Transition in Colorectal Cancer Cells. Gastroenterology. 2017
41. Rokavec M, Oner MG, Li H, Jackstadt R, Jiang L, Lodygin D. et al. IL-6R/STAT3/miR-34a feedback loop promotes EMT-mediated colorectal cancer invasion and metastasis. J Clin Invest. 2014;124:1853-67
42. Tada Y, Yokomizo A, Shiota M, Tsunoda T, Plass C, Naito S. Aberrant DNA methylation of T-cell leukemia, homeobox 3 modulates cisplatin sensitivity in bladder cancer. Int J Oncol. 2011;39:727-33
43. Kishimoto T. Interleukin-6: from basic science to medicine-40 years in immunology. Annu Rev Immunol. 2005;23:1-21
44. Wang C, Yang W, Yan HX, Luo T, Zhang J, Tang L. et al. Hepatitis B virus X (HBx) induces tumorigenicity of hepatic progenitor cells in 3,5-diethoxycarbonyl-1,4-dihydrocollidine-treated HBx transgenic mice. Hepatology. 2012;55:108-20
45. Bergmann J, Muller M, Baumann N, Reichert M, Heneweer C, Bolik J. et al. IL-6 trans-signaling is essential for the development of hepatocellular carcinoma in mice. Hepatology. 2017;65:89-103
46. Xu E, Pereira MMA, Karakasilioti I, Theurich S, Al-Maarri M, Rappl G. et al. Temporal and tissue-specific requirements for T-lymphocyte IL-6 signalling in obesity-associated inflammation and insulin resistance. Nat Commun. 2017;8:14803
47. Xu MJ, Feng D, Wu H, Wang H, Chan Y, Kolls J. et al. Liver is the major source of elevated serum lipocalin-2 levels after bacterial infection or partial hepatectomy: a critical role for IL-6/STAT3. Hepatology. 2015;61:692-702
Author contact
![]() Corresponding author: Xin Zheng MD., Ph.D., Department of Hepatobiliary Surgery, The First Affiliated Hospital of Xi'an Jiaotong University, 277 Yanta West Road, 710061 Xi`an, China, E-mail: xin.zheng.xjtucom; OR Lewis R. Roberts M.B. Ch.B., Ph.D., Division of Gastroenterology and Hepatology, Mayo Clinic College of Medicine and Science, 200 First Street SW 55905, Rochester, MN, USA; E-mail: roberts.lewisedu
Corresponding author: Xin Zheng MD., Ph.D., Department of Hepatobiliary Surgery, The First Affiliated Hospital of Xi'an Jiaotong University, 277 Yanta West Road, 710061 Xi`an, China, E-mail: xin.zheng.xjtucom; OR Lewis R. Roberts M.B. Ch.B., Ph.D., Division of Gastroenterology and Hepatology, Mayo Clinic College of Medicine and Science, 200 First Street SW 55905, Rochester, MN, USA; E-mail: roberts.lewisedu