ISSN: 1449-2288International Journal of Biological Sciences

Int J Biol Sci 2023; 19(16):5145-5159. doi:10.7150/ijbs.83906 This issue Cite
Research Paper
PTEN-induced kinase 1 exerts protective effects in diabetic kidney disease by attenuating mitochondrial dysfunction and necroptosis
Min-Ji Sung1, Hyun-Ju An1, Min Heui Ha1, Seon Hwa Park2, Hye Yun Jeong1, Jihyun Baek1, Sang Ho Lee2, Yu Ho Lee1 ![]() , So-Young Lee1
, So-Young Lee1 ![]()
1. Devision of Nephrology, Department of Internal Medicine, CHA Bundang Medical Center, CHA University, Seongnam, South Korea.
2. Devision of Nephrology, Department of Internal Medicine, Kyung Hee University Hospital at Gangdong, Kyung Hee University, Seoul, South Korea.
Abstract

Mitochondrial dysfunction plays a pivotal role in diabetic kidney disease initiation and progression. PTEN-induced serine/threonine kinase 1 (PINK1) is a core organizer of mitochondrial quality control; however, its function in diabetic kidney disease remains controversial. Here, we aimed to investigate the pathophysiological roles of PINK1 in diabetic tubulopathy, focusing on its effects on mitochondrial homeostasis and tubular cell necroptosis, which is a specialized form of regulated cell death. PINK1-knockout mice showed more severe diabetes-induced tubular injury, interstitial fibrosis, and albuminuria. The expression of profibrotic cytokines significantly increased in the kidneys of diabetic Pink1-/- mice, which eventually culminated in aggravated interstitial fibrosis. Additionally, the knockdown of PINK1 in HKC-8 cells upregulated the fibrosis-associated proteins, and these effects were rescued by PINK1 overexpression. PINK1 deficiency was also associated with exaggerated hyperglycemia-induced mitochondrial dysfunction and defective mitophagic activity, whereas PINK1 overexpression ameliorated these negative effects and restored mitochondrial homeostasis. Mitochondrial reactive oxygen species triggered tubular cell necroptosis under hyperglycemic conditions, which was aggravated by PINK1 deficiency and improved by its overexpression. In conclusion, PINK1 plays a pivotal role in suppressing mitochondrial dysfunction and tubular cell necroptosis under high glucose conditions and exerts protective effects in diabetic kidney disease.
Keywords: PINK1, diabetic kidney disease, diabetic tubulopathy, mitochondria, necroptosis
Introduction
Mitochondria are energy generators in cells and are critical to cell metabolism, reactive oxygen species (ROS) production, intracellular calcium homeostasis, and cell survival [1]. The kidney, which is rich in mitochondria, has a high resting metabolic rate requiring sufficient adenosine triphosphate (ATP) to remove waste and excess fluid from the blood, maintain the acid-base balance, and re-absorb nutrients [2]. Recent studies have investigated the role of mitochondria in kidney disease to explore potential therapeutic targets [3].
Necroptosis is a form of programmed cell death mimicking features of apoptosis and necrosis that has attracted attention in various human diseases [4]. Necroptotic cell death is initiated when receptor-interacting protein kinase (RIPK) 1 is activated and phosphorylates RIPK3, which triggers phosphorylation of mixed lineage kinase domain-like protein (MLKL) and ultimately leads to plasma membrane disruption and cell lysis [4]. Necroptosis has been implicated in the development of acute kidney injury and chronic kidney disease [5-7]. The necrosome, which comprises phospho-forms of RIPK1, RIPK3, and MLKL, increases in the proximal tubular cells after acute kidney injury, and drugs inhibiting necroptosis improve cell viability [8-10]. Suppression of necroptosis also ameliorated subtotal nephrectomy- and crystal-induced kidney injury models in animal experiments [7,11].
Diabetic kidney disease (DKD) is the leading cause of end-stage kidney disease worldwide. Growing evidence suggests that renal tubular epithelial injuries play an important role in the initiation and progression of DKD [4,12]. Among the various factors involved in the pathogenesis of diabetic tubular injury, mitochondrial dysfunction is one the most important components contributing to progressive kidney fibrosis [13]. We previously demonstrated impaired mitochondrial biogenesis and dynamics along with reduced ATP production in the renal tubular epithelial cells of diabetic mice. It was also observed that reversing mitochondrial abnormalities could diminish albuminuria and renal fibrosis in diabetic kidneys [14].
PTEN-induced serine/threonine kinase 1 (PINK1) is one of the core organizers of mitochondrial quality control and contributes to mitochondrial homeostasis. We previously demonstrated that peroxisome proliferator-activated receptor gamma coactivator 1-alpha (PGC1α) is involved in mitochondrial dynamics and autophagy in diabetic tubulopathy [15,16]. Because PINK1 is a candidate downstream gene of PGC1α [14,17], PINK1 may also play specific roles in the pathogenesis of DKD. Therefore, we aimed to investigate the relationship between PINK1 and tubular cell necroptosis under high glucose conditions and explore its effects on DKD progression.
Methods
Animal studies
Pink1-knockout mice and their littermates were used in this study. The genotype and phenotype of Pink1-knockout mice were confirmed previously [18]. Diabetes was induced in 8-week-old male mice by intraperitoneal injection of streptozotocin (STZ; Sigma Aldrich, Burlington, MA) at 50 mg/kg for 5 consecutive days. In the intervention study, four groups of mice were used (n=7 in each group) as follows: (1) normoglycemic Pink1+/+, (2) normoglycemic Pink1-/-, (3) diabetic Pink1+/+, and (4) diabetic Pink1-/-. All mice were sacrificed 16 weeks after STZ administration, and their kidney tissue samples were collected for analysis. During the experiments, body weights and serum glucose concentrations were measured weekly. All animal experiments were performed in strict accordance with the recommendations of the Guide for the Care and Use of Laboratory Animals of the Korea National Institutes of Health. All animal experiments were performed in compliance with the guidelines of the Animal Research Ethics Committee and the Institutional Animal Care and Use Committee of CHA bio complex (No. 200012).
Measurements of serum creatinine and urea nitrogen levels
Plasma samples were collected from each mouse at the time of sacrifice. Plasma creatinine levels were measured using a creatinine ELISA kit (Creatinine Assay kit, Abcam, ab65340, Cambridge, UK) following the manufacturer's instructions. Similarly, urea nitrogen levels were assessed using a commercial ELISA kit (Invitrogen, EIABUN, Waltham, MA) according to the manufacturer's instructions.
Cell culture
The human renal proximal tubular epithelial cell line HKC-8 was obtained from Dr. L. Rausen (Johns Hopkins University, Baltimore, MD) and maintained in Dulbecco's modified Eagle medium supplemented with Ham's F12 medium (DMEM/F12), 5% fetal bovine serum, and 1% penicillin/streptomycin (WelGENE, Daegu, Korea). HKC-8 cells were cultured with 5- or 30-mM D-glucose for 48 hours and were collected for analysis.
Primary renal proximal tubular epithelial cells were isolated from the kidney cortex of 4-week-old Pink1+/+ and Pink1-/- mice, washed with sterile phosphate buffer saline (PBS), minced, and digested in type 1 collagenase solution at 37°C for 1 hour. After enzyme digestion, cells were washed with PBS, passed through a 100-µm cell strainer (SPL life sciences, Gyeonggi-do, Korea), centrifuged, and resuspended in DMEM/F12 containing 5% fetal bovine serum and 1% penicillin-streptomycin. Cells were placed in 100-mm culture plates and maintained at 37℃ with 5% CO2.
Transfection with RNA oligonucleotides
Small interfering RNA (siRNA) duplex oligonucleotides targeting Pink1 (siPink1; catalog no. 44598) and scrambled negative control siRNA (catalog no. 37007) were purchased from Santa Cruz Biotechnology (Dallas, TX). For functional analyses, cells were transfected with the siRNA oligonucleotides at a final concentration of 60 nM using Lipofectamine RNAiMAX (Gibco-Invitrogen) according to the manufacturer's recommendations.
Overexpression of PINK1
We used lentiviral expression vector cloned PINK1 human tagged ORF (CAT#: RC206970L4, Origene, Rockville, MD), the pLenti-C-mGFP-P2A lentiviral vector. Pink1 and control lentiviruses were produced by transfecting Lenti-X 293 T cells (Clontech, Mountain View, CA) with the pLenti-C-mGFP-P2A-Puro-Pink1, pLenti-C-mGFP-P2A-Puro (control), and packaging (pCMV-VSV-G, pMDLg/pRRE, and pRSV-Rev; Addgene, Watertown, MA) plasmids using Lipofectamine 3000 (Gibco-Invitrogen). Infectious lentiviruses were harvested 48 hours post-transfection and subsequently used to infect the HKC-8 cells with 4 μg/ml polybrene (Sigma Aldrich).
Western blot analysis
Cells and kidney tissue samples were washed with PBS and lysed in ice-cold lysis buffer containing a protease inhibitor cocktail (Roche Diagnostics, Mannheim, Germany). Proteins were separated by 8%-15% SDS-PAGE and subsequently transferred into a polyvinylidene difluoride membrane (Merck-Millipore, Madrid, Spain) by electroblotting. The membranes were blocked for 1 hour at 20°C and subsequently incubated overnight at 4°C with anti-PINK1 for mouse (1:200, Abcam, ab23707), anti-α-SMA (alpha-smooth muscle actin, 1:1000, Abcam, ab5694), anti-Fibronectin (1:2000, Abcam, ab2413), anti-TGF-β1 (transforming growth factor-beta 1, 1:1000, Abcam, ab215715), anti-TNFα (tumor necrosis factor-alpha 1, Gibco-Invitrogen, PA1-40281), anti-phospho-MLKL (1:1000, Cell Signaling Technology, #37333, Danvers, MA), anti-phospho-RIPK3 (1:1000, Cell Signaling Technology, #91702), anti-phospho-RIPK1 (S161, 1:1000, Gibco-Invitrogen, PA5-105640), anti-phospho-RIPK1 (S166, 1:1000, Cell Signaling Technology, #44590), anti-MLKL (1:1000, Cell Signaling Technology, #37705), anti-RIPK1 (1:1000, Santa Cruz Biotechnology, sc-133102), anti-RIPK3 (1:1000, Santa Cruz Biotechnology, sc-374639), anti-E-cadherin (1:1000, Santa Cruz Biotechnology, sc-8426), and anti-PINK1 (1:500, Santa Cruz Biotechnology, sc-517353) for human primary antibodies. Subsequently, the membranes were stained with horseradish peroxidase (HRP)-conjugated goat anti-rabbit or -mouse immunoglobulin G (1:5000, Enzo Life Sciences Inc., ADI-SAB-300-J, Farmingdale, NY). Immunoreactive bands were detected using chemiluminescence (enhanced chemiluminescence; Bio-Rad Laboratories, Hercules, CA). Glyceraldehyde 3-phosphate dehydrogenase (GAPDH) (1:3000, Santa Cruz Biotechnology, sc-47724) and β-actin (1:2000, Santa Cruz Biotechnology, sc-47778) were used as the internal controls.
Isolation of RNA and real-time quantitative PCR
Total RNA was isolated from cultured cells or frozen kidney tissues using TRIzol® reagent (Gibco-Invitrogen) or the RNeasy Mini kit (Qiagen, Venlo, Limburg, Netherlands), respectively, according to the manufacturer's protocols. To quantify mRNA expression, total RNA (1 µg) was reverse transcribed into cDNA using an AMPIGENE® cDNA Synthesis kit (Enzo Life Sciences Inc.). The reaction mixtures were incubated sequentially at 42°C for 30 minutes and 85°C for 10 minutes. Real-time quantitative PCR (qPCR) for mRNA determination was performed using Fast Start Universal SYBR Green Master (Enzo Life Sciences Inc.) and an iCycler real-time PCR detection system (Bio-Rad Laboratories) according to the manufacturer's protocols. The qPCR reaction conditions were as follows: denaturation at 95°C for 2 minutes, followed by 40 cycles of 95°C for 5 seconds, 60°C for 30 seconds, and 72°C for 30 seconds. The sequences of specific primers used for qPCR analyses of mRNA are listed in Table S1. The mRNA expression levels were calculated using the 2-ΔΔCq method.
Renal histopathology and immunohistochemical staining
Paraffin-embedded sections of mouse kidney specimens were prepared and used for periodic acid-Schiff and Masson trichrome staining. The semiquantitative assessment of tubular injury and interstitial fibrosis was performed in a blinded manner, and the specific scoring system used in these evaluations has been previously described [19]. In brief, assessment of tubular injury involved grading from 0 to 3 based on the extent of tubular dilatation and epithelial cell destruction: 0 for absence of injury, 1 for 1-25% affected, 2 for 26-50% affected, and 3 for >50% affected. Interstitial fibrosis was quantified by calculating the percentage of positive fibrotic area in Masson-Trichrome-stained tissues.
Immunohistochemistry of kidney tissue samples was performed using a ready-to-use IHC/ICC kit (BioVision, Milpitas, CA) according to the manufacturer's protocol. Briefly, mouse kidney tissue samples were fixed with 4% formaldehyde at 20°C for 24 hours. Next, the paraffin-embedded tissues were cut into 4-µm‑thick sections, deparaffinized, rehydrated, and microwaved in citrate buffer (Abcam, ab93678) and subsequently used for antigen retrieval. The slides were incubated in 3% H2O2 at 20°C for 30 minutes to quench the endogenous peroxidase activity, and subsequently, blocked-in blocking buffer (BioVision) at 20°C for 15 minutes, followed by incubation with 8-hydroxy-2'-deoxyguanosine (8-OHdG, 1:2000, Santa Cruz Biotechnology, sc-66036), α-SMA (1:500, Cell Signaling Technology, ab5694), phospho-RIPK3 (1:200, Cell Signaling Technology, #91702), phospho-MLKL (1:100, Cell Signaling Technology, #37333), TNFα (1:100, Abcam, PA1-40281), and fibronectin (1:100, Abcam, ab2413) antibodies at 20°C for 30 minutes. After incubation with HRP-anti-mouse or -rabbit IgG polymer at 20°C for 20 minutes and washing with PBS, the tissue sections were treated with 3,3'-diaminobenzidine at 20°C for 10 minutes, followed by counterstaining with hematoxylin at 20°C for 1 minute. Images were captured using an ECLIPSE Ts2 microscope (magnification ×200; Nikon Instruments Inc., Melville, NY). Immunohistochemistry quantification was performed using pixel density analysis in Photoshop. After immunostaining, all tissue slides were scanned using a slide scanner, and 10 sections per a slide were selected at 200x magnification. The stained area's color was identified, and the number of pixels was measured with a fixed color range to ensure consistency. The evaluation entailed determining the proportion of stained areas relative to the total number of image pixels.
Measurement of mitophagic activity
Mitochondria targeted Keima-Red-Mito-7 (mt-Keima, Addgene, plasmid #56018) were transfected using Lipofectamine 3000 according to the manufacturer's protocol. After incubation in the plasmid solution for 24 hours, the cells were incubated with DMEM/F12 under 5- or 30-mM D-glucose for an additional 48 hours. The cells were counterstained with 4′,6-diamidino-2-phenylindole (DAPI) to delineate the nuclei and examined through confocal microscopy (LSM-700; Carl Zeiss, Jena, Germany). Photoshop program was utilized to select the fluorescence color of each image pixel. A fixed range value for this color was established and consistently maintained across all experimental groups. The number of selected pixels was then measured, allowing for an accurate assessment of mt-Keima levels in the studied samples. Mitophagic activity was expressed as ratios between the measured values of 458nm (green) and 561nm (red) fluorescence.
Measurement of reactive oxygen species
To assess intracellular and mitochondrial reactive oxygen species (ROS) production, cells were incubated with dihydroethidium (DHE) (15 µM, Life Technologies, Seoul, Korea) and MitoSOX (5 µM, Life Technologies) at 37°C for 30 minutes and examined using confocal microscopy (LSM-700; Carl Zeiss). DHE was excited at 518 nm, and the fluorescence emission at 610 nm was measured. In contrast, MitoSOX Red was excited at 510 nm, and the fluorescence emission at 580 nm was measured.
Measurement of mitochondrial membrane potential
The mitochondrial inner membrane electrochemical potential (ΔΨm) was assessed using JC-1 dye according to the manufacturer's instructions (mitochondrial membrane potential assay kit, #ab113850, Abcam). JC-1 is a lipophilic fluorescent cation that emits green and red fluorescence at low ΔΨm and high ΔΨm, respectively. HKC-8 cells were collected and stained with 10 µg/mL JC-1 at 37°C in the dark for 15 minutes, followed by measurement of the absorbance at 590 nm (aggregate emission) and 530 nm (monomer species) in a microplate reader (Molecular Devices, Sunnyvale, CA).
Mutant mitochondrial DNA detection
Genomic DNA was isolated to screen for the 4,977-bp and 3,860-bp deletions in human mitochondrial DNA (mtDNA) and mouse mtDNA, respectively. The primers used for mtDNA detection are provided in Table S1. qPCR conditions for human mtDNA were as follows: pre-denaturation at 94°C for 5 minutes; 30 cycles at 94°C for 10 seconds, 58°C for 45 seconds, and 7°C for 50 seconds; and a final extension at 72°C for 10 minutes. qPCR conditions for mouse mtDNA were as follows: pre-denaturation at 94°C for 5 minutes; 35 cycles at 94°C for 15 seconds, 59°C for 30 seconds, and 72°C for 50 seconds; and a final extension at 72°C for 10 minutes. To quantify the mtDNA/genomic DNA ratio, qPCR was used to amplify one gene from the mitochondrial genome (COX1) and one from the nuclear genome (nuclear β-actin).
Electron microscopy
After the removal of the kidneys, the tissues were immediately diced into 1-mm3 pieces and fixed with 2.5% glutaraldehyde and 2% paraformaldehyde in sodium cacodylate buffer (pH 7.2) at 4°C. Subsequently, tissue specimens were post-fixed in 1% osmium tetroxide (OsO4) containing 1.5% potassium ferrocyanide for 30 minutes at 4°C. Kidney tissue samples were cut into semi-thin (1 μm) and ultra-thin sections (80 nm) and stained with 1% uranyl acetate and lead citrate. The ultrastructure of the cells and mitochondria was analyzed using transmission electron microscopy (JEM-1230, Jeol, Japan). Mitochondrial area and length in renal proximal tubular cells were quantified by averaging ten random electron microscopic sections.
Seahorse assays
Cellular and mitochondrial respiration was quantified using the Seahorse Extracellular Flux Analyzer XF-e24 (Seahorse Agilent Technologies) and the commercial XF Cell Mito Stress Test kit (Agilent Technologies, Santa Clara, CA), respectively. Each 6-well Seahorse cell culture plate was precoated with rat tail collagen type I (Sigma). Naive and differentiated HKC-8 cells were detached using 0.05% trypsin-EDTA, counted, and plated at 3,000 cells/well density. Cells were allowed to attach for 16-20 hours. The initial incubation medium was replaced with Seahorse XF base DMEM medium, and the plate was transferred into the XF-e24 analyzer for calibration and measurement of the oxygen consumption rate (OCR). The duration of each step within a measurement cycle was adjusted to 3 minutes of mixing and 3 minutes of measurement time. Respiration of cells was quantified as OCR at baseline and after treatment of each well with appropriate mitochondrial modulators, such as oligomycin (1.5 μM), FCCP (0.5 μM), and rotenone and antimycin A (0.5 μM).
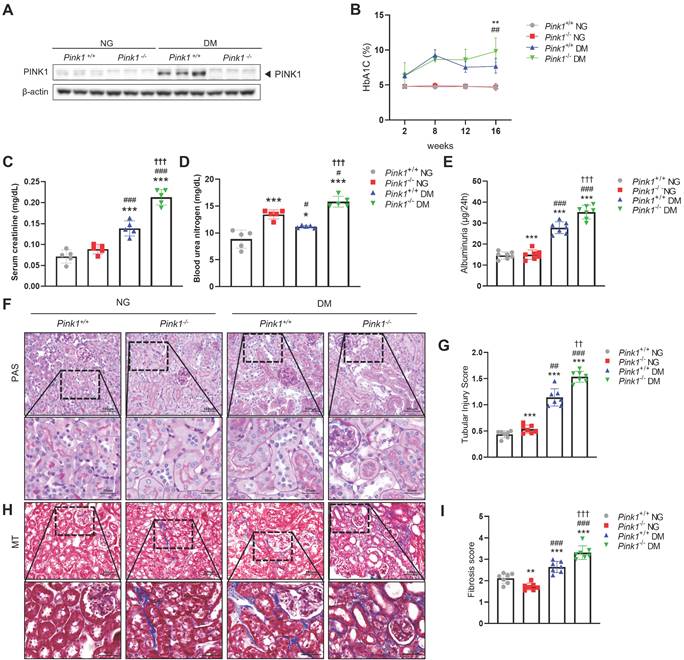
PINK1 deficiency aggravates kidney dysfunction, albuminuria, and renal morphological changes in the kidneys of diabetic mice. (A) Western blotting of PINK1 in whole kidney lysate obtained from Pink1+/+ and Pink1-/- mice with normal or high blood glucose levels. (B) % of HbA1c during a 16-week period. (C and D) Levels of serum creatinine (C) and blood urea nitrogen (D) across groups. (E) Quantification of 24-hour albuminuria. (F) Representative photomicrographs of periodic acid-Schiff-stained kidneys of Pink1+/+ and Pink1-/- mice with normal or high serum glucose levels. (G) A semiquantitative assessment of the tubular injury score was performed. (H) Representative photomicrographs of Masson trichrome-stained kidneys of Pink1+/+ and Pink1-/- mice with normal or high serum glucose levels. (I) A semiquantitative assessment of renal fibrosis was performed. Scale bar: (F and H) non-magnified images (upper panels) = 100 μm, magnified images (lower panels) = 50 μm. Values are expressed as mean ± standard error. n = 7 per group, *p < 0.05, **p < 0.01, ***p < 0.001 vs Pink1+/+ NG, #p < 0.05, ##p < 0.01, ###p < 0.001 vs Pink1-/- NG, †p < 0.05, ††p < 0.01 vs Pink1+/+ DM. Abbreviations: PINK1, PTEN-induced serine/threonine kinase 1; HbA1c, glycated hemoglobin; NG, normoglycemia; DM, diabetes mellitus; PAS, periodic acid-Schiff; MT, Masson trichrome.
Statistics
Data are expressed as mean ± standard errors. An independent t-test was used to compare the differences between the two groups, and a one-way analysis of variance with a post hoc Tukey's test was performed to compare the differences between more than two groups. p-value less than 0.05 was considered as statistically significant.
Results
PINK1 deficiency aggravates kidney dysfunction, albuminuria, and renal morphological changes and in STZ-induced diabetic mice
To determine the effect of PINK1 deficiency on DKD in vivo, we first induced hyperglycemia in Pink1+/+ and Pink1-/- mice through STZ injection. PINK1 deficiency in Pink1-/- mice was confirmed by western blotting (Figure 1A). Diabetes induced an increase in PINK1 expression in the kidneys. Both Pink1+/+ and Pink1-/- diabetic mice had higher glycated hemoglobin (HbA1c) levels than mice with normal blood glucose, and no significant difference was observed in the HbA1c levels between Pink1+/+ and Pink1-/- mice (Figure 1B). In diabetic mice, serum creatinine and urea nitrogen levels were significantly increased compared to control mice, and the absence of PINK1 further exacerbated diabetes-induced kidney dysfunction (Figure 1C and 1D). Albuminuria significantly increased in diabetic Pink1-/- mice compared with that in diabetic Pink1+/+ mice (Figure 1E). Subsequently, we examined the loss of PINK1 in developing tubular injury and interstitial fibrosis using periodic acid-Schiff and Masson trichrome stain. Histological analyses showed tubular dilatation and epithelial disruption in the diabetic mice group. Notably, the tubular injury was most prominent in the kidneys of diabetic Pink1-/-mice (Figure 1F and 1G). Diabetic mice demonstrated a marked increase in renal interstitial collagen deposition, and loss of PINK1 significantly aggravated interstitial fibrosis (Figure 1H and 1I).
These results suggest that PINK1 plays an important role in tubulointerstitial injury and fibrosis in DKD.
Loss of PINK1 promotes profibrotic phenotypes of renal tubular epithelial cells in diabetic mice
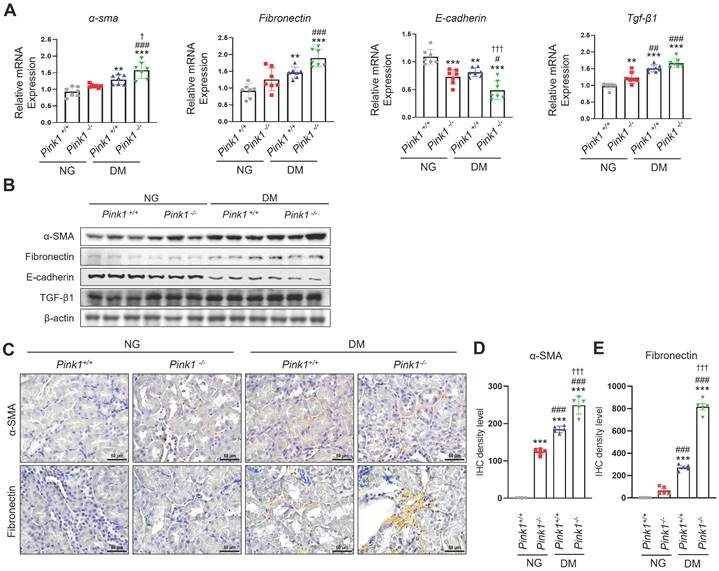
After kidney injury, renal tubular epithelial cells produce profibrotic cytokines, contributing to renal fibrogenesis [20]. We observed that α-SMA and fibronectin mRNA and protein expression, which are profibrotic markers, significantly increased, whereas E-cadherin levels, which are epithelial markers, decreased in the kidneys of PINK1-deficient diabetic mice compared with PINK1-wild-type diabetic mice (Figure 2A, 2B, and Figure S1). TGF-β1 expression, which is a critical mediator of kidney fibrosis released by damaged renal epithelial cells [21], was also increased in the kidneys of PINK1-deficient mice. Immunohistochemical analysis showed that the expression of α-SMA and fibronectin increased in diabetic kidneys from PINK1-deficient mice (Figure 2C-E).
These results suggest that renal tubular epithelial cells acquire profibrotic phenotypes under hyperglycemic conditions, and PINK1 deficiency further accelerates these effects.
PINK1 regulates renal tubular epithelial phenotypes under high glucose conditions in vitro
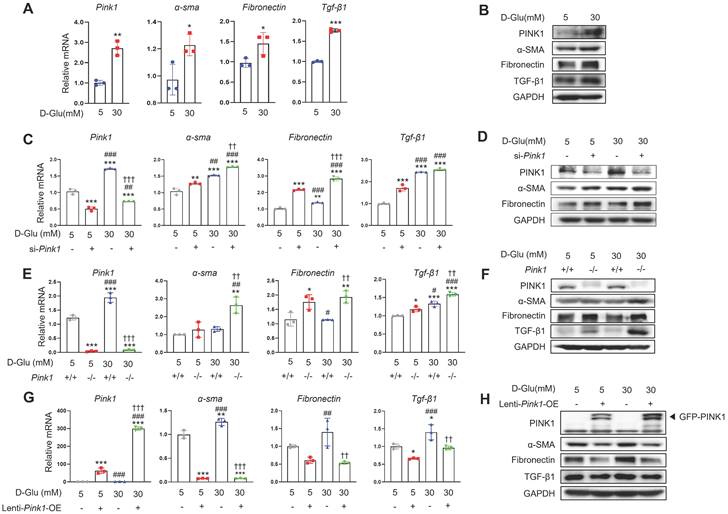
Next, we explored the pathophysiologic roles of PINK1 in diabetic tubulopathy using HKC-8 cells. Hyperglycemia upregulated the expression of PINK1 and profibrotic markers in these cells, which is consistent with our in vivo data (Figure 3A, 3B, and Figure S2A). To investigate whether PINK1 could modulate phenotypic alterations of renal tubular epithelial cells under high glucose conditions, we constructed Pink1 knockdown cells with Pink1-siRNA transfection and Pink1 overexpression cells with lentiviral vectors. Pink1 siRNA significantly enhanced the profibrotic phenotype in renal proximal tubular epithelial cells in high glucose media (Figure 3C, 3D, and Figure S2B). These effects were consistently observed in primary cultured renal tubular epithelial cells obtained from Pink1+/+ and Pink1-/- mice (Figure 3E, 3F, and Figure S2C). In contrast, Pink1 overexpression significantly attenuated hyperglycemia-induced phenotypic changes in HKC-8 cells (Figure 3G, 3H, and Figure S2D).
These data suggest that the PINK1 level is important in regulating renal tubular epithelial phenotypes in diabetic environments.
PINK1 regulates mitochondrial integrity and mitophagy in renal tubular epithelial cells
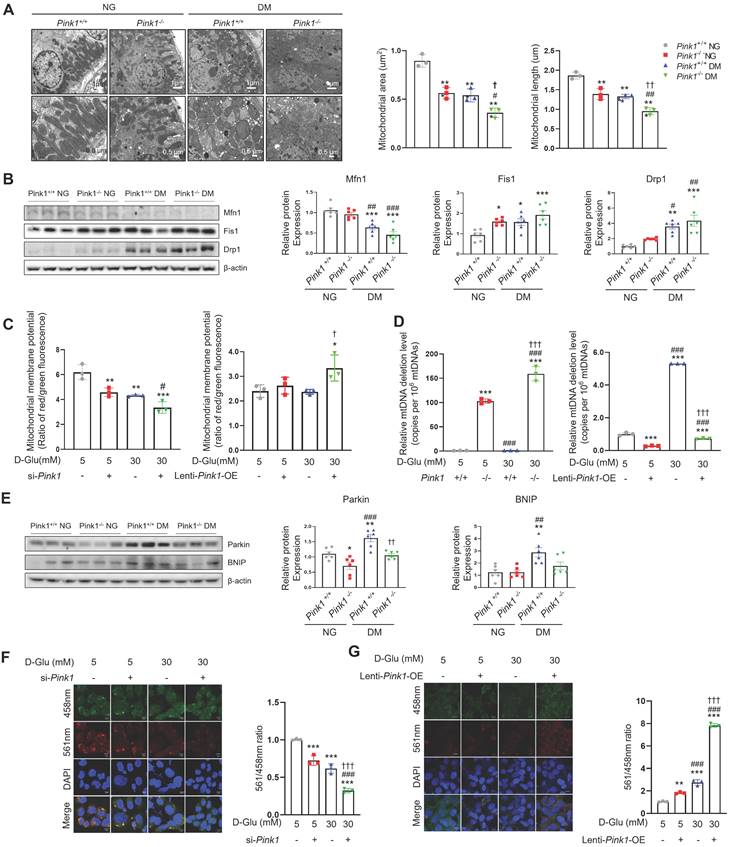
Mitochondria are dynamic organelles that continuously fuse and divide to maintain their networks. Mitochondrial fragmentation is linked with mitochondrial dysfunction, including loss of mitochondrial membrane potential, impaired respiration, oxidative phosphorylation, and increased mitochondrial ROS formation [19]. PINK1 deficiency accelerated hyperglycemia-induced mitochondrial fission in the renal tubular cells of diabetic mice (Figure 4A). Western blot analysis consistently revealed that sustained hyperglycemia resulted in reduced expression of mitofusin 1 (Mfn1), an indicator of mitochondrial fusion (Figure 4B). Additionally, there was an increase in the expression of mitochondrial fission 1 (Fis1) and dynamin-related protein 1 (Drp1), markers of mitochondrial fission. Moreover, these alterations were exacerbated by loss of PINK1. The siRNA for Pink1 significantly reduced mitochondrial membrane potential, whereas Pink1 overexpression restored it in HKC-8 cells under high glucose conditions (Figure 4C). We assessed the frequency of mitochondrial DNA deletion (D17), which is coupled with damaged mitochondria [19,22]. Pink1 downregulation caused an increased mouse mtDNA 3,860-bp deletion in primary cultures of kidney proximal tubule cells, whereas Pink1 upregulation was associated with less frequent human mtDNA 4,977-bp deletion in renal tubular epithelial cells under hyperglycemic conditions (Figure 4D). Next, we examined the associations between PINK1 and mitophagy, a cellular process to remove dysfunctional mitochondria via the autophagic machinery [23]. Western blot analysis demonstrated an elevation in the expressions of Parkin and Bcl-2/adenovirus E1B 19 kD-interacting protein 3 (BNIP3), both indicative of mitophagy, in the kidneys of diabetic mice (Figure 4E). However, their expressions were significantly reduced by loss of PINK1. We also used the mt-Keima probe to detect functional mitophagy as indicated by red puncta. Mitophagic function was suppressed under high glucose conditions, and Pink1 knockdown further suppressed it (Figure 4F). In contrast, hyperglycemia-induced mitophagic dysfunction was successfully rescued by Pink1 overexpression (Figure 4G).
PINK1 deficiency increases the expression of profibrotic molecules in the kidneys of diabetic mice. (A and B) mRNA levels (A) and western blotting (B) of α-SMA, fibronectin, E-cadherin, and TGF-β1 in the kidneys of Pink1+/+ and Pink1-/- mice with normal or high serum glucose levels. (C) Representative immunohistochemical staining of α-SMA and fibronectin in the kidneys of Pink1+/+ and Pink1-/- mice with normal or high serum glucose levels. (D and E) A semiquantitative assessment of the staining intensity in the renal tubules was performed. Quantitative analysis of Figure 2B are shown in Figure S1. (C) Scale bar = 100 μm. Data are representative of three independent experiments and is expressed as means ± standard error. n = 7 per group, *p < 0.05, **p < 0.01, ***p < 0.001 vs Pink1+/+ NG, #p < 0.05, ##p < 0.01 vs Pink1-/- NG, †p < 0.05 vs Pink1+/+ DM. Abbreviations: PINK1, PTEN-induced serine/threonine kinase 1; α-SMA, alpha-smooth muscle actin; TGF-β1, transforming growth factor-β1; NG, normoglycemic; DM, diabetes mellitus; IHC, immunohistochemistry.
PINK1 regulates the profibrotic phenotypes of renal tubular epithelial cells under high glucose conditions. (A) mRNA levels of Pink1, α-SMA, fibronectin, and TGF-β1 in human renal proximal tubular cells (HKC-8) after treatment with 5- or 30-mM D-glucose. (B) Western blotting of PINK1, α-SMA, fibronectin, and TGF-β1 in HKC-8 cell lysates after treatment with 5- or 30-mM D-glucose. (C) Quantification of the expression of Pink1, α-SMA, fibronectin, and TGF-β1 mRNAs in HKC-8 cells with control siRNA or Pink1 siRNA under 5- or 30-mM D-glucose. (D) Western blotting of PINK1, α-SMA, and fibronectin in control or PINK1 siRNA-treated HKC-8 cells under 5- or 30-mM D-glucose. (E) Quantification of the expression of Pink1, α-SMA, fibronectin, and TGF-β1 mRNA in primary renal tubular epithelial cells of Pink1+/+ and Pink1-/- mice after treatment with 5- or 30-mM D-glucose. (F) Western blotting of α-SMA, fibronectin, and TGF-β1 in 5- or 30-mM D-glucose-treated primary renal tubular epithelial cells obtained from Pink1+/+ or Pink1-/- mice. (G) Quantification of the expression of Pink1, α-SMA, fibronectin, and TGF-β1 mRNA in control or GFP-Pink1 infected HKC-8 cells after treatment with 5- or 30-mM D-glucose. (H) Western blotting of α-SMA, fibronectin, and TGF-β1 in PINK1-overexpressed HKC-8 cells after treatment with 5- or 30-mM D-glucose. Quantitative analysis of Figure 3B, 3D, 3F, and 3H are shown in Figure S2. Shown are representatives of three independent experiments and are expressed as means ± standard error. *p < 0.05, **p < 0.01, ***p < 0.001 vs Pink1+/+ NG, #p < 0.05, ##p < 0.01 vs Pink1-/- NG, ††p < 0.01, †††p < 0.001 vs Pink1+/+ DM. Abbreviations: PINK1, PTEN-induced serine/threonine kinase; α-SMA, alpha-smooth muscle actin; TGF-β1, transforming growth factor-β1; NG, normal glucose; DM, diabetes mellitus; GAPDH, glyceraldehyde 3-phosphate dehydrogenase; OE, overexpression; GFP, green fluorescent protein.
PINK1 is involved in mitochondrial electron transport chain complex expressions and cellular oxygen consumption
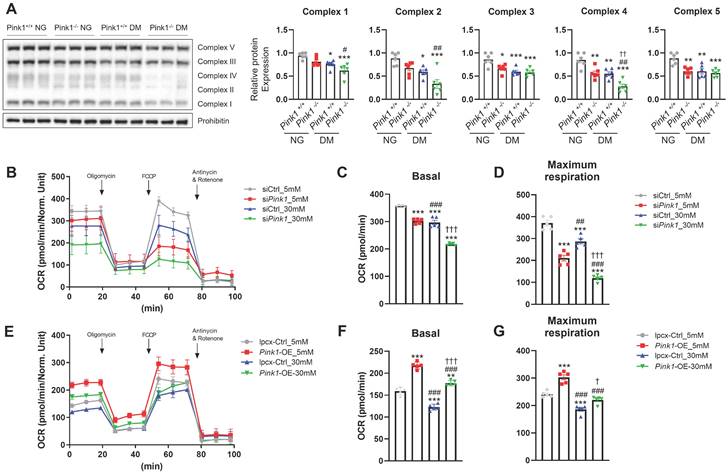
The electron transport chain (ETC) is a cascade of electron transporters that play a pivotal role in generating large number of ATPs and also serve as a major source of mitochondrial ROS within the renal proximal tubular cells [24]. Western blot analysis of whole kidney lysates showed that demonstrated that diabetes induced significant reductions in the expressions of all the mitochondrial ETC complexes (Figure 5A). Moreover, the absence of PINK1 resulted in additional decreases in the expressions of ETC complex II and IV, while complexes I, III, and V remained unaffected. Seahorse assay showed that Pink1 deficiency aggravated hyperglycemia-induced decreases in basal and maximal oxygen consumption rates, which are indicators of mitochondrial dysfunction (Figure 5B-D). The hyperglycemia-induced mitochondrial stress was ameliorated by Pink1 overexpression (Figure 5E-G).
PINK1 controls the formation of reactive oxygen species in renal tubular epithelial cells
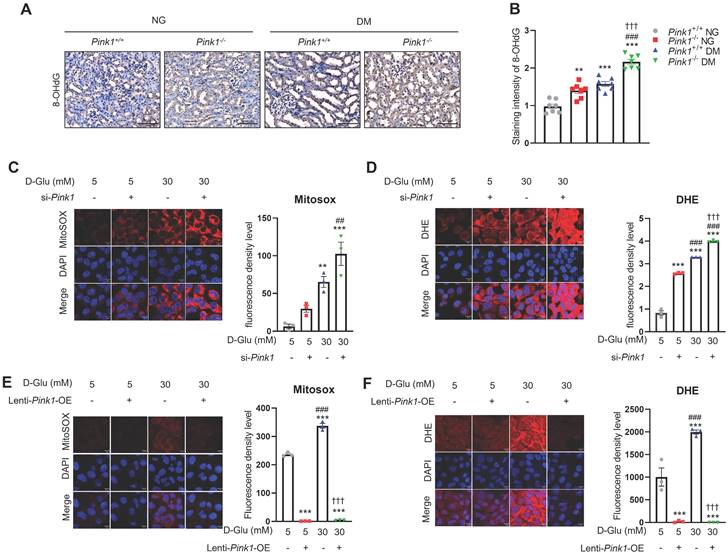
Sustained hyperglycemic stimuli are known to increase ROS generation in the renal tubules [25]. Immunofluorescence staining showed a significant increase in 8-OHdG, which is an indicator of oxidative stress, in renal tubular cells of diabetic mice (Figure 6A and 6B). Moreover, PINK1 deficiency worsened diabetes-induced intrarenal ROS formation. Consistently, in vitro experiments demonstrated that Pink1 depletion augmented hyperglycemia-induced overproduction of mitochondrial and cellular ROS (Figure 6C and 6D), whereas its overexpression ameliorated ROS generation in HKC-8 cells (Figure 6E and 6F).
Together, these data suggest that PINK1 has protective roles against mitochondrial dysfunction and ROS production in renal tubular epithelial cells under high glucose conditions.
PINK1 maintain mitochondrial homeostasis and mitophagic function in renal tubular epithelial cells under high glucose conditions. (A) Representative electron microscopy images and the quantification of mitochondrial area and length in renal proximal tubular epithelial cells of Pink1+/+ and Pink1-/- mice with normal or high serum glucose levels. (B) Western blotting of mitofusin 1 (Mfn1), mitochondrial fission 1 (Fis1), and dynamin-related protein 1 (Drp1) in the kidneys of Pink1+/+ and Pink1-/- mice with normal or high serum glucose levels, and their quantification. (C) The mitochondrial membrane potential of HKC-8 cells with Pink1 siRNA and GFP-Pink1 infected HKC-8 cells after treatment with 5- or 30-mM D-glucose. (D) The mouse mitochondrial DNA 3,860-bp deletion in primary cultures of kidney proximal tubule cells obtained from Pink1+/+ or Pink1-/- mice and the human mitochondrial DNA 4,977-bp deletion in control or GFP-Pink1 infected HKC-8 cells after treatment with 5- or 30-mM D-glucose. (E) Western blotting of Parkin and Bcl-2/adenovirus E1B 19 kD-interacting protein 3 (BNIP3) in the kidneys of Pink1+/+ and Pink1-/- mice with normal or high serum glucose levels, and their quantification. (F) Representative fluorescence images of the mt-Keima and their quantification in HKC-8 cells with control or Pink1 siRNA after treatment with 5- or 30-mM D-glucose. (G) Representative fluorescence images of the mt-Keima and their quantification in control or GFP-Pink1 infected HKC-8 cells after treatment with 5- or 30-mM D-glucose. Scale bar: (A) 1 μm and 0.5 μm in upper and lower images, respectively, (F and G) 10 μm. (A, B, and E) n = 6 per group. (C, D, F, and G) Data are representative of three independent experiments and are expressed as means ± standard error. n = 3 per group. **p < 0.01, ***p < 0.001 vs Pink1+/+ NG, #p < 0.05, ##p < 0.01, ###p < 0.001 vs Pink1-/-, NG, †p < 0.05, ††p < 0.01, †††p < 0.001 vs Pink1+/+ DM. Abbreviations: PINK1, PTEN-induced serine/threonine kinase 1; NG, normal glucose; DM, diabetes mellitus; Mfn, mitofusin 1; Fis1, mitochondrial fission 1; Drp1, dynamin-related protein 1; OE, overexpression; mtDNA, mitochondrial DNA; BNIP, Bcl-2/adenovirus E1B 19 kD-interacting protein 3; mt-Keima, mitochondria-targeted Keima.
PINK1 is involved in mitochondrial electron transport chain complex expressions and cellular oxygen consumption. (A) Western blotting of electron transport chain complex I-V in the kidneys of Pink1+/+ and Pink1-/- mice with normal or high serum glucose levels. (B-D) Representative Seahorse assay traces of HKC-8 cells with control or Pink1 siRNA after treatment with 5- or 30-mM D-glucose and the quantification of OCR at basal and maximal respiration. (E-G) Representative Seahorse assay traces of control or GFP-Pink1 infected HKC-8 cells after treatment with 5- or 30-mM D-glucose and the quantification of OCR at basal and maximal respiration. (A) n = 6 per group, (B-G) Data are representative of five independent experiments and are expressed as means ± standard error. **p < 0.01, ***p < 0.001 vs Pink1+/+ NG, #p < 0.05, ##p < 0.01, ###p < 0.001 vs Pink1-/-, NG, †p < 0.05, ††p < 0.01, †††p < 0.001 vs Pink1+/+ DM. Abbreviations: PINK1, PTEN-induced serine/threonine kinase 1; NG, normal glucose; DM, diabetes mellitus; OCR, oxygen consumption rate; OE, overexpression.
PINK1 inhibits hyperglycemia-associated necroptotic cell death in renal tubular epithelial cells
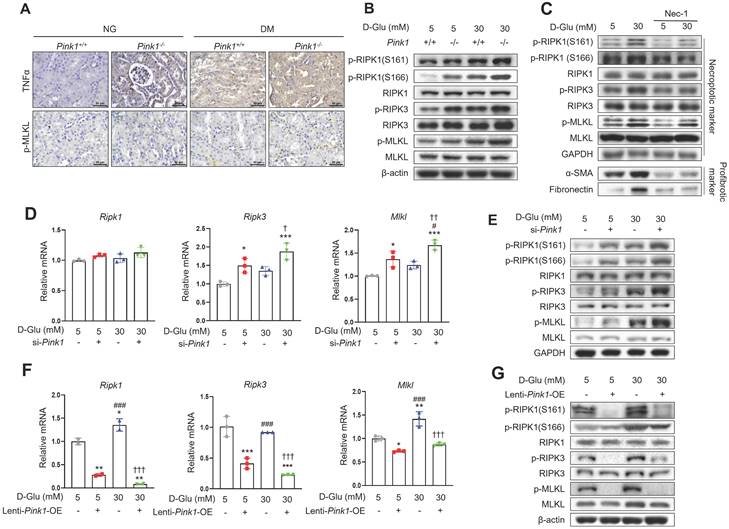
Finally, we explored whether diabetic tubulopathy accelerated by Pink1 deficiency is implicated in necroptosis. Immunohistochemical staining showed that the expression of TNFα, which is an upstream protein in the necroptosis signaling pathway, and phospho-MLKL, a final component of the necroptosis pathway, were increased by hyperglycemia, and hyperglycemia further increased their expression in the renal tubules (Figure 7A). Previous studies demonstrated that RIPK1 phosphorylation at S161 or 166 was involved in the necroptotic signaling pathway initiation [22,26]. Particularly, S161, which is an autophosphorylation site of RIPK1, is induced by mitochondrial ROS [22]. Primary cultured renal tubular epithelial cells demonstrated that hyperglycemia was associated with increased levels of phospho-RIPK1 at S161 and S166 (Figure 7B and Figure S3A). Notably, hyperglycemia-associated elevations in phospho-RIPK1 levels were augmented by PINK1 deficiency. These alterations ultimately increased phospho-MLKL. Necrostatin-1, which is an inhibitor of necroptotic cell death, suppressed the phosphorylation of PINK1 and its downstream proteins and the profibrotic proteins in HKC-8 cells exposed to high glucose media (Figure 7C and Figure S3B). Pink1 siRNA enhanced the expression of necroptosis-related markers (Figure 7D, 7E, and Figure S3C), whereas Pink1 overexpression effectively decreased the expression of key necroptosis components (Figure 7F, 7G, and Figure S3D).
Together, our results demonstrate that necroptosis is relevant to diabetic tubulopathy, and importantly, PINK1 restricts necroptosis-related protein expression in tubular epithelial cells under high glucose conditions.
Discussion
In this study, we investigated the role of PINK1 in DKD. We found that PINK1 deficiency significantly increased albuminuria and aggravated renal tubulointerstitial fibrosis in STZ-induced diabetic mice. Knockdown of PINK1 promoted profibrotic phenotypes in renal tubular epithelial cells associated with hyperglycemia-induced mitophagic activation suppression and an increase in intracellular ROS, whereas Pink1 overexpression significantly ameliorated these negative effects. The intracellular stresses caused by PINK1 deficiency ultimately caused enhanced necroptotic responses in renal tubular epithelial cells under hyperglycemic conditions. Together, our data suggest that PINK1 plays an important role in maintaining mitochondrial integrity under hyperglycemic stress; however, its deficiency aggravates DKD through profibrotic transitions and necroptotic cell death of renal proximal epithelial cells.
PINK1 regulates the generation of reactive oxygen species in renal tubular epithelial cells under high glucose conditions. (A and B) Representative immunohistochemical staining of 8-OHdG in the kidneys of Pink1+/+ and Pink1-/- mice with normal or high serum glucose levels. A semiquantitative assessment of the staining intensity in the renal tubules was performed. (C) Representative images of MitoSOX red staining of superoxide radicals and their quantification in HKC-8 cells with control siRNA or Pink1 siRNA after treatment with 5- or 30-mM D-glucose. (D) Immunofluorescence images showing DHE staining and their quantification in HKC-8 cells with control or Pink1 siRNA after treatment with 5- or 30-mM D-glucose. (E) Representative images of MitoSOX red staining of superoxide radicals and their quantification in control or GFP-Pink1 infected HKC-8 cells after treatment with 5- or 30-mM D-glucose. (F) Immunofluorescence images of DHE staining and their quantification in control or GFP-Pink1 infected HKC-8 cells after treatment with 5- or 30-mM D-glucose. Scale bar: (A) 100 μm, (C-F) 100 μm. (A) n = 7 per group, (C-F) Data is representative of three independent experiments and expressed as means ± standard error. n = 3 per group. **p < 0.01, ***p < 0.001 vs Pink1+/+ NG, #p < 0.05, ##p < 0.01, ###p < 0.001 vs Pink1-/-, NG, †p < 0.05, ††p < 0.01, †††p < 0.001 vs Pink1+/+ DM. Abbreviations: PINK1, PTEN-induced serine/threonine kinase 1; NG, normal glucose; DM, diabetes mellitus; 8-OHdG, 8-hydroxy-2′-deoxyguanosine; DHE, dihydroethidium; OE, overexpression.
PINK1 inhibits necroptosis in renal tubular epithelial cells under high glucose conditions. (A) Representative immunohistochemical images of TNFα and p-MLKL in the kidneys of Pink1+/+ and Pink1-/- with normal or high blood glucose levels. Scale bar = 50 μm. (B) Western blotting of necroptosis-related proteins in primary renal tubular epithelial cells of Pink1+/+ and Pink1-/- mice after treatment with 5- or 30-mM D-glucose. (C) Western blotting of necroptosis-related and profibrotic proteins in necrostatin-1-treated HKC-8 cells under 5- or 30-mM D-glucose. (D) Quantification of the mRNA expression of necroptosis-related molecules in HKC-8 cells with control or Pink1 siRNA after treatment with 5- or 30-mM D-glucose. (E) Western blotting of necroptosis-related proteins in control or PINK1 siRNA-treated HKC-8 cells under 5- or 30-mM D-glucose. (F) Quantification of the mRNA expression of necroptosis-related molecules in control or GFP-Pink1 infected HKC-8 cells after treatment with 5- or 30-mM D-glucose. (G) Western blotting of necroptosis-related proteins in PINK1-overexpressed HKC-8 cells after treatment with 5- or 30-mM D-glucose. Quantitative analysis of Figure 7B, 7C, 7E, and 7G are shown in Figure S3. (B-G) Data are representative of three independent experiments and are expressed as means ± standard error. *p < 0.05, **p < 0.01, ***p < 0.001 vs Pink1+/+ NG, ###p < 0.001 vs Pink1-/- NG, ††p < 0.01, †††p < 0.001 vs Pink1+/+ DM. Abbreviations: PINK1, PTEN-induced serine/threonine kinase 1; NG, normal glucose; DM, diabetes mellitus; TNFα, tumor necrosis factor α; MLKL, mixed lineage kinase domain-like pseudokinase; RIPK, receptor-interacting protein kinase; α-SMA, alpha-smooth muscle actin; OE, overexpression.
Kidney fibrosis is a complex pathophysiological process that causes the irreversible accumulation of matrix-producing myofibroblasts. Previous studies consistently demonstrated that proximal tubular injury could contribute to the initiation and progression of kidney fibrosis [27-29]. We previously reported that the secretion of profibrotic cytokines in the renal tubular epithelial cells is one of the major pathophysiological processes in diabetic tubulopathy initiation and progression, and the restoration of mitochondrial homeostasis was associated with significant improvements in hyperglycemia-associated kidney fibrosis [16,19,21,30]. Here, we demonstrated that impaired mitophagic activity in renal tubular epithelial cells contributes to diabetic tubulopathy aggravation, further highlighting the importance of mitochondrial homeostasis in DKD pathogenesis.
Several previous studies have investigated the clinical relevance of PINK1 in the kidneys under diabetic conditions [8,31-38]. However, these studies have produced inconsistent results, possibly attributable to significant variations in experimental designs, diabetes induction methods, sacrifice timings, and the use of different animal models. Moreover, the causality between renal PINK1 expression and sustained hyperglycemia remains uncertain. [8,31,32,35,38]. To overcome the limitations of previous research, we conducted our study utilizing PINK1 knockout mice, providing an opportunity to elucidate the pathophysiological roles and cellular mechanisms of PINK1 in DKD. Here, we observed that PINK1 expression significantly increased in renal tubular epithelial cells under hyperglycemic conditions sand that PINK1 deficiency results in defective mitophagic activity and mitochondrial dysfunction, which ultimately worsens hyperglycemia-induced kidney fibrosis. In addition, we successfully established a mechanistic connection between impaired mitophagy and tubular cell necroptosis, a regulated form of cell death not highlighted in DKD. These findings shed light on a novel pathophysiology underlying diabetic tubulopathy and offer potential therapeutic targets for DKD. Notably, PINK1 exerted protective roles in cisplatin-induced acute kidney injury [39], suggesting that PINK1-mediated mitophagic activation represents a common defense mechanism against various types of kidney injuries.
We observed that the loss of Pink1 was associated with significantly aggravated tubulointerstitial injury and fibrosis in diabetic and in non-diabetic mice (Figure 1). These findings suggest that PINK1 plays a role in maintaining kidney homeostasis despite low basal mitophagic activity in renal proximal tubular cells under no-stress conditions [40,41]. Therefore, isolated PINK1 deficiency might be sufficient to induce overt kidney injury. Consistently, isolated PINK1 deficiency in HKC-8 cells could perturb mitochondrial homeostasis and induce phenotypic alterations even without hyperglycemic stimuli (Figure 3-5).
We examined the effect of PINK1 on the phenotypes of renal tubular epithelial cells using in vitro experiments and found that knockdown of Pink1 increased the expression of profibrotic proteins, including α-SMA, fibronectin, and TGF-β1, under hyperglycemic conditions. Moreover, Pink1 overexpression significantly attenuated hyperglycemia-induced upregulation of these cytokines, and the restoration of mitochondrial integrity and suppression of ROS production accompanied these beneficial effects. These data indicate that PINK1 is a therapeutic target for treating DKD. Therefore, it is necessary to determine whether drugs that enhance PINK1-mediated mitophagy are also effective in preventing DKD progression.
It is important to address the pathophysiologic roles of PINK1 in mesangial cells and podocytes, as these are critical cell types involved in diabetic glomerulopathy. Previous studies have shown that exposure to hyperglycemic conditions leads to a reduction in PINK1 expression in podocytes, in contrast to the findings in proximal tubular cells as demonstrated in our own data [8,36,37]. However, this decrease in PINK1 expression resulted in excessive ROS generation and mitophagic dysfunction, ultimately culminating in podocyte apoptosis. Moreover, the restoration of PINK1 expression was found to reverse the cellular stresses induced by hyperglycemia, highlighting its significance in mitigating these adverse effects on podocytes. Similar to the observations in podocytes, hyperglycemic stimuli were found to downregulate PINK1 expression in mesangial cells, subsequently leading to increased mitochondrial fragmentation and ROS production [42]. Collectively, these data emphasize the potential importance of PINK1 in maintaining mitochondrial homeostasis and cell function across different cell types within the diabetic glomerulus.
Programmed cell death is increasingly recognized as a major type of renal tubular cell death and is involved in various renal pathophysiology, including kidney fibrosis [43]. Although several studies have demonstrated relevant associations between DKD and ferroptosis, which is another form of regulated necrosis [44-46], , the role of necroptosis in DKD has not been well established. Here, we found that PINK1 deficiency and associated mitochondrial dysfunction were linked to necroptosis in renal tubular epithelial cells. Notably, a link between mitophagy and necroptosis in epithelial cells has also been demonstrated in chronic obstructive pulmonary disease pathogenesis [47].
Interestingly, we observed that hyperglycemia-treated and/or PINK1-deficient HKC-8 cells exhibited increased levels of phospho-RIPK1 at S161 and S166, respectively, both of which were involved in necroptosis initiation [26,48]. Particularly, Zhang et al. demonstrated that mitochondrial ROS prosecuted necroptotic cell death through S161 autophosphorylation of RIPK1 [48]. They also showed that the activated RIPK3 generated intracellular ROS and facilitated necrosome formation, thereby completing the positive feedback loop of ROS and necroptosis [48,49]. We speculate that phospho-RIPK at S161 might be primarily responsible for the occurrence of hyperglycemia-induced necroptosis, given the direct associations between hyperglycemia-induced mitophagic dysfunction and mitochondrial ROS (Figure 5). However, since necroptosis is reported to be cell-type dependent [50-54], further investigations are required to confirm this hypothesis.
In conclusion, we demonstrated that PINK1 plays a key role in maintaining mitochondrial homeostasis, and that the loss of its function results in DKD aggravation. We also demonstrated that Pink1 overexpression protected against high glucose-induced mitochondrial dysfunction and necroptosis in renal tubular epithelial cells. These findings might provide novel insights into the mechanisms underlying hyperglycemia-induced renal fibrosis and contribute to developing treatment approaches for DKD. Therefore, further investigations are needed to examine whether pharmacological PINK1 activators can be a novel therapeutic strategy for treating DKD.
Supplementary Material
Supplementary figures and table.
Acknowledgements
Funding
This research was supported by the Basic Science Research Program through the National Research Foundation of Korea (NRF) funded by the Ministry of Education (NRF-2022R1A2C2006713, NRF-2022R1F1A1073067, and RS-2023-00213976).
Data availability
All data generated and analyzed during this study are included in this published article.
Author contributions
YHL and SYL devised the conceptual ideas. MJS, YHL, and SYL contributed to the research design. MJS, HJA, and MHH performed in vivo and in vitro studies. SHP performed histological analysis. MS, YHL, and SYL analyzed data; HYJ, JB, YHL, SHL, and SHL contributed to the discussion. MS, YHL, and SYL wrote the article. All authors have approved the final version of the article.
Competing Interests
The authors have declared that no competing interest exists.
References
1. Emma F, Montini G, Parikh SM, Salviati L. Mitochondrial dysfunction in inherited renal disease and acute kidney injury. Nat Rev Nephrol. 2016;12:267-280
2. Andersson SG, Zomorodipour A, Andersson JO, Sicheritz-Ponten T, Alsmark UC, Podowski RM. et al. The genome sequence of Rickettsia prowazekii and the origin of mitochondria. Nature. 1998;396:133-140
3. Duann P, Lin PH. Mitochondria Damage and Kidney Disease. Adv Exp Med Biol. 2017;982:529-551
4. Chen J, Kos R, Garssen J, Redegeld F. Molecular Insights into the Mechanism of Necroptosis: The Necrosome As a Potential Therapeutic Target. Cells. 2019 8
5. Belavgeni A, Meyer C, Stumpf J, Hugo C, Linkermann A. Ferroptosis and Necroptosis in the Kidney. Cell Chem Biol. 2020;27:448-462
6. Landau SI, Guo X, Velazquez H, Torres R, Olson E, Garcia-Milian R. et al. Regulated necrosis and failed repair in cisplatin-induced chronic kidney disease. Kidney Int. 2019;95:797-814
7. Zhu Y, Cui H, Xia Y, Gan H. RIPK3-Mediated Necroptosis and Apoptosis Contributes to Renal Tubular Cell Progressive Loss and Chronic Kidney Disease Progression in Rats. PLoS One. 2016;11:e0156729
8. Li W, Du M, Wang Q, Ma X, Wu L, Guo F. et al. FoxO1 Promotes Mitophagy in the Podocytes of Diabetic Male Mice via the PINK1/Parkin Pathway. Endocrinology. 2017;158:2155-2167
9. Shen B, Mei M, Pu Y, Zhang H, Liu H, Tang M. et al. Necrostatin-1 Attenuates Renal Ischemia and Reperfusion Injury via Meditation of HIF-1alpha/mir-26a/TRPC6/PARP1 Signaling. Mol Ther Nucleic Acids. 2019;17:701-713
10. Wang JN, Liu MM, Wang F, Wei B, Yang Q, Cai YT. et al. RIPK1 inhibitor Cpd-71 attenuates renal dysfunction in cisplatin-treated mice via attenuating necroptosis, inflammation and oxidative stress. Clin Sci (Lond). 2019;133:1609-1627
11. Mulay SR, Desai J, Kumar SV, Eberhard JN, Thomasova D, Romoli S. et al. Cytotoxicity of crystals involves RIPK3-MLKL-mediated necroptosis. Nat Commun. 2016;7:10274
12. Liu BC, Tang TT, Lv LL, Lan HY. Renal tubule injury: a driving force toward chronic kidney disease. Kidney Int. 2018;93:568-579
13. Bhatia D, Capili A, Choi ME. Mitochondrial dysfunction in kidney injury, inflammation, and disease: Potential therapeutic approaches. Kidney Res Clin Pract. 2020;39:244-258
14. Choi J, Ravipati A, Nimmagadda V, Schubert M, Castellani RJ, Russell JW. Potential roles of PINK1 for increased PGC-1alpha-mediated mitochondrial fatty acid oxidation and their associations with Alzheimer disease and diabetes. Mitochondrion. 2014;18:41-48
15. Baek J, Lee YH, Jeong HY, Lee SY. Mitochondrial quality control and its emerging role in the pathogenesis of diabetic kidney disease. Kidney Res Clin Pract. 2023
16. Lee SY, Kang JM, Kim DJ, Park SH, Jeong HY, Lee YH. et al. PGC1alpha Activators Mitigate Diabetic Tubulopathy by Improving Mitochondrial Dynamics and Quality Control. J Diabetes Res. 2017;2017:6483572
17. Zhang Q, Lei YH, Zhou JP, Hou YY, Wan Z, Wang HL. et al. Role of PGC-1alpha in Mitochondrial Quality Control in Neurodegenerative Diseases. Neurochem Res. 2019;44:2031-2043
18. Lee SY, An HJ, Kim JM, Sung MJ, Kim DK, Kim HK. et al. PINK1 deficiency impairs osteoblast differentiation through aberrant mitochondrial homeostasis. Stem Cell Res Ther. 2021;12:589
19. Lee YH, Kim SH, Kang JM, Heo JH, Kim DJ, Park SH. et al. Empagliflozin attenuates diabetic tubulopathy by improving mitochondrial fragmentation and autophagy. Am J Physiol Renal Physiol. 2019;317:F767-F780
20. Sheng L, Zhuang S. New Insights Into the Role and Mechanism of Partial Epithelial-Mesenchymal Transition in Kidney Fibrosis. Front Physiol. 2020;11:569322
21. Zhou D, Liu Y. Renal fibrosis in 2015: Understanding the mechanisms of kidney fibrosis. Nat Rev Nephrol. 2016;12:68-70
22. Zhang Y, Ma Y, Bu D, Liu H, Xia C, Zhang Y. et al. Deletion of a 4977-bp Fragment in the Mitochondrial Genome Is Associated with Mitochondrial Disease Severity. PLoS One. 2015;10:e0128624
23. Palikaras K, Lionaki E, Tavernarakis N. Mechanisms of mitophagy in cellular homeostasis, physiology and pathology. Nat Cell Biol. 2018;20:1013-1022
24. Bhargava P, Schnellmann RG. Mitochondrial energetics in the kidney. Nat Rev Nephrol. 2017;13:629-646
25. Munusamy S, MacMillan-Crow LA. Mitochondrial superoxide plays a crucial role in the development of mitochondrial dysfunction during high glucose exposure in rat renal proximal tubular cells. Free Radic Biol Med. 2009;46:1149-1157
26. Laurien L, Nagata M, Schunke H, Delanghe T, Wiederstein JL, Kumari S. et al. Autophosphorylation at serine 166 regulates RIP kinase 1-mediated cell death and inflammation. Nat Commun. 2020;11:1747
27. Chevalier RL. The proximal tubule is the primary target of injury and progression of kidney disease: role of the glomerulotubular junction. Am J Physiol Renal Physiol. 2016;311:F145-161
28. Grgic I, Campanholle G, Bijol V, Wang C, Sabbisetti VS, Ichimura T. et al. Targeted proximal tubule injury triggers interstitial fibrosis and glomerulosclerosis. Kidney Int. 2012;82:172-183
29. Takaori K, Nakamura J, Yamamoto S, Nakata H, Sato Y, Takase M. et al. Severity and Frequency of Proximal Tubule Injury Determines Renal Prognosis. J Am Soc Nephrol. 2016;27:2393-2406
30. Dugan LL, You YH, Ali SS, Diamond-Stanic M, Miyamoto S, DeCleves AE. et al. AMPK dysregulation promotes diabetes-related reduction of superoxide and mitochondrial function. J Clin Invest. 2013;123:4888-4899
31. Zhan M, Usman IM, Sun L, Kanwar YS. Disruption of renal tubular mitochondrial quality control by Myo-inositol oxygenase in diabetic kidney disease. J Am Soc Nephrol. 2015;26:1304-1321
32. Xiao L, Xu X, Zhang F, Wang M, Xu Y, Tang D. et al. The mitochondria-targeted antioxidant MitoQ ameliorated tubular injury mediated by mitophagy in diabetic kidney disease via Nrf2/PINK1. Redox Biol. 2017;11:297-311
33. Smith MA, Covington MD, Schnellmann RG. Loss of calpain 10 causes mitochondrial dysfunction during chronic hyperglycemia. Arch Biochem Biophys. 2012;523:161-168
34. Liu X, Wang W, Song G, Wei X, Zeng Y, Han P. et al. Astragaloside IV ameliorates diabetic nephropathy by modulating the mitochondrial quality control network. PLoS One. 2017;12:e0182558
35. Liu X, Lu J, Liu S, Huang D, Chen M, Xiong G. et al. Huangqi-Danshen decoction alleviates diabetic nephropathy in db/db mice by inhibiting PINK1/Parkin-mediated mitophagy. Am J Transl Res. 2020;12:989-998
36. Li W, Wang Q, Du M, Ma X, Wu L, Guo F. et al. Effects of overexpressing FoxO1 on apoptosis in glomeruli of diabetic mice and in podocytes cultured in high glucose medium. Biochem Biophys Res Commun. 2016;478:612-617
37. Zhou D, Zhou M, Wang Z, Fu Y, Jia M, Wang X. et al. PGRN acts as a novel regulator of mitochondrial homeostasis by facilitating mitophagy and mitochondrial biogenesis to prevent podocyte injury in diabetic nephropathy. Cell Death Dis. 2019;10:524
38. Jiang XS, Chen XM, Hua W, He JL, Liu T, Li XJ. et al. PINK1/Parkin mediated mitophagy ameliorates palmitic acid-induced apoptosis through reducing mitochondrial ROS production in podocytes. Biochem Biophys Res Commun. 2020;525:954-961
39. Wang Y, Tang CY, Cai J, Chen GC, Zhang DS, Zhang ZH. et al. PINK1/Parkin-mediated mitophagy is activated in cisplatin nephrotoxicity to protect against kidney injury. Cell Death & Disease. 2018 9
40. Hartleben B, Godel M, Meyer-Schwesinger C, Liu S, Ulrich T, Kobler S. et al. Autophagy influences glomerular disease susceptibility and maintains podocyte homeostasis in aging mice. J Clin Invest. 2010;120:1084-1096
41. McWilliams TG, Prescott AR, Allen GF, Tamjar J, Munson MJ, Thomson C. et al. mito-QC illuminates mitophagy and mitochondrial architecture in vivo. J Cell Biol. 2016;214:333-345
42. Yi X, Yan W, Guo T, Liu N, Wang Z, Shang J. et al. Erythropoietin Mitigates Diabetic Nephropathy by Restoring PINK1/Parkin-Mediated Mitophagy. Front Pharmacol. 2022;13:883057
43. Ruiz-Ortega M, Rayego-Mateos S, Lamas S, Ortiz A, Rodrigues-Diez RR. Targeting the progression of chronic kidney disease. Nat Rev Nephrol. 2020;16:269-288
44. Feng X, Wang S, Sun Z, Dong H, Yu H, Huang M. et al. Ferroptosis Enhanced Diabetic Renal Tubular Injury via HIF-1alpha/HO-1 Pathway in db/db Mice. Front Endocrinol (Lausanne). 2021;12:626390
45. Kim S, Kang SW, Joo J, Han SH, Shin H, Nam BY. et al. Correction: Characterization of ferroptosis in kidney tubular cell death under diabetic conditions. Cell Death Dis. 2021;12:382
46. Wang Y, Bi R, Quan F, Cao Q, Lin Y, Yue C. et al. Ferroptosis involves in renal tubular cell death in diabetic nephropathy. Eur J Pharmacol. 2020;888:173574
47. Mizumura K, Cloonan SM, Nakahira K, Bhashyam AR, Cervo M, Kitada T. et al. Mitophagy-dependent necroptosis contributes to the pathogenesis of COPD. J Clin Invest. 2014;124:3987-4003
48. Zhang Y, Su SS, Zhao S, Yang Z, Zhong CQ, Chen X. et al. RIP1 autophosphorylation is promoted by mitochondrial ROS and is essential for RIP3 recruitment into necrosome. Nat Commun. 2017;8:14329
49. Schenk B, Fulda S. Reactive oxygen species regulate Smac mimetic/TNFalpha-induced necroptotic signaling and cell death. Oncogene. 2015;34:5796-5806
50. He S, Wang L, Miao L, Wang T, Du F, Zhao L. et al. Receptor interacting protein kinase-3 determines cellular necrotic response to TNF-alpha. Cell. 2009;137:1100-1111
51. Lin J, Li H, Yang M, Ren J, Huang Z, Han F. et al. A role of RIP3-mediated macrophage necrosis in atherosclerosis development. Cell Rep. 2013;3:200-210
52. Lin Y, Choksi S, Shen HM, Yang QF, Hur GM, Kim YS. et al. Tumor necrosis factor-induced nonapoptotic cell death requires receptor-interacting protein-mediated cellular reactive oxygen species accumulation. J Biol Chem. 2004;279:10822-10828
53. Sawai H, Ogiso H, Okazaki T. Differential changes in sphingolipids between TNF-induced necroptosis and apoptosis in U937 cells and necroptosis-resistant sublines. Leuk Res. 2015;39:964-970
54. Tait SW, Oberst A, Quarato G, Milasta S, Haller M, Wang R. et al. Widespread mitochondrial depletion via mitophagy does not compromise necroptosis. Cell Rep. 2013;5:878-885
Author contact
![]() Corresponding authors: Yu Ho Lee, M.D., Ph.D. Division of Nephrology, Department of Internal Medicine, CHA Bundang Medical Center, CHA University, 59 Yatap-ro, Bundang-gu, Seongnam-si, 13496, South Korea. Phone: +82-31-780-5025, Fax: +82-31-780-5219, E-mail: boryworknet. So-Young Lee, M.D., Ph.D. Division of Nephrology, Department of Internal Medicine, CHA Bundang Medical Center, CHA University, 59 Yatap-ro, Bundang-gu, Seongnam-si, 13496, South Korea. Phone: +82-31-780-5025, Fax: +82-31-780-5219, E-mail: ysy0119ac.kr.
Corresponding authors: Yu Ho Lee, M.D., Ph.D. Division of Nephrology, Department of Internal Medicine, CHA Bundang Medical Center, CHA University, 59 Yatap-ro, Bundang-gu, Seongnam-si, 13496, South Korea. Phone: +82-31-780-5025, Fax: +82-31-780-5219, E-mail: boryworknet. So-Young Lee, M.D., Ph.D. Division of Nephrology, Department of Internal Medicine, CHA Bundang Medical Center, CHA University, 59 Yatap-ro, Bundang-gu, Seongnam-si, 13496, South Korea. Phone: +82-31-780-5025, Fax: +82-31-780-5219, E-mail: ysy0119ac.kr.
Received 2023-2-27
Accepted 2023-9-20
Published 2023-10-2