Impact Factor ISSN: 1449-2288
- Issue 9; 2026
- Issue 8; 2026
- Issue 7; 2026
- Issue 6; 2026
- Issue 5; 2026
- Volume 22; 2026
- Past Issues
- Advance Articles
- Editorial Board
- Cover Images
- Index & Coverage
- Cover Suggestion
- Special Issues
Introduction
Material and Method
Results
Discussion
Conclusion
Supplementary Material
Acknowledgements
References

 Global reach, higher impact
Int J Biol Sci 2011; 7(5):551-566. doi:10.7150/ijbs.7.551 This issue Cite
Research Paper
Varied Pathways of Stage IA Lung Adenocarcinomas Discovered by Integrated Gene Expression Analysis
Chengwen Chen, Xuping Fu, Deqiang Zhang, Yuan Li, Yi Xie, Yao Li ![]() , Yan Huang
, Yan Huang ![]()
State Key Laboratory of Genetic Engineering, Institute of Genetics, School of Life Sciences, Fudan University, Shanghai, China, 200433
Received 2011-1-27; Accepted 2011-3-31; Published 2011-4-28
Abstract
Background: Discovery of the progression-associated genes and pathways in lung adenocarcinoma (LAD) has important implications in understanding the molecular mechanism of tumor development. However, few studies had been performed to focus on the changes of pathways in lung adenocarcinoma development using microarray expression profile.
Result: We performed a meta-analysis of 4 LAD microarray datasets encompassing 353 patients to reveal differentially expressed genes (DEGs) between normal lung tissues and LAD of different stages. Overall, 1 838 genes were found to be dys-regulated, and the adipogenesis, circadian rhythm, and Id pathways were significantly changed. Interestingly, most of the genes from the same gene family (such as Interleukin receptor, Matrix metallopeptidase, Histone cluster and Minichromosome maintenance complex component families) were found to be up-regulated (or down-regulated). Real-time PCR (qRT-PCR) was applied to validate the expression of randomly selected 18 DEGs in LAD cell lines. In the pathway analysis among stages, Oxidative stress, Glycolysis/Gluconeogenesis and Integrin-mediated cell adhesion pathways, which were involved in cancer cell proliferation and metastasis, were showed to be significantly regulated in stages other than IA.
Conclusion: Genes involved in adipogenesis and Id pathways might play important roles in development of LADs. The similar trend of expression of the gene family members suggested coordinate regulation in tumor progression. Three pathways (Oxidative stress, Glycolysis/Gluconeogenesis and Integrin-mediated cell adhesion pathways) significantly regulated in stages other than stage IA suggested that genes and pathways conferring invasive character might be activated in the preinvasive stage IB, while the Oxidative stress and the Glycolysis/Gluconeogenesis pathways might have strong connections to cisplatin-based chemotherapy. The insignificantly regulated three pathways in stage IA might be used in early-stage detection of LAD.
Keywords: meta-analysis, lung adenocarcinoma, pathway, sample size
Introduction
Lung cancer is the most common cause of cancer death for both men and women worldwide [1]. Generally, the majority of cancer deaths are caused by metastasis rather than by the primary tumor itself [2]. The development of an oncogenic state is a complex process involving the accumulation of multiple independent mutations, which lead to deregulation of cell signaling pathways on controlling cell growth and cell fate [3]. The sequential and rate-limiting steps of metastasis involve lots of gene expression, regulations, and interactions [4].
Lung adenocarcinoma (LAD), a histological subtype of non-small cell lung cancer (NSCLC), has increased incidence over the past several decade years from 20% of lung cancer cases to nearly 40%, followed with a high mortality [5]. Based on the 2004 World Health Organization Pathologic Criteria, the LADs have four major individual subtypes (acinar, papillary, bronchioloalveolar carcinoma, and solid carcinoma with mucus formation) [6]. The acinar pattern is characterized by acini and tubules composed of cuboidal or columnar cells which may be mucin producing and resemble bronchial gland or bronchial lining epithelial cells. The papillary pattern shows papillae with secondary and tertiary papillary structures that replace the underlying lung architecture. Solid adenocarcinoma with mucin is composed of sheets polygonal cells lacking acini, tubules, and papillae but with mucin. Bronchioloalveolar carcinoma (BAC) pattern shows growth of neoplastic cells along pre-existing alveolar structures without evidence of stromal, vascular, or pleural invasion [7]. However, most of the cases are histologically heterogeneous and consist of more than one subtype. The most frequent subtype was the adenocarcinomas mixed subtype, representing approximately 80% of resected adenocarcinomas [6].
The most powerful method for NSCLC patients prognosis and treatment guiding is the tumor-node-metastasis (TNM) staging system [8]. Based on the tumor size (T), local invasion, and presence of nodal (N) and distant metastases (M), patients are categorized into seven stages (IA, IB, IIA, IIB, IIIA, IIIB and IV) [9]. Early stage detection of NSCLC helps to choose a proper treatment for patients. Usually, surgical resection is the first option for early stage subjects, and is considered curative in patients with stage I lung cancer [10]. Recently, multiple clinical trials have demonstrated that adjuvant chemotherapy significantly improved the survival of the patients in stage IB-IIIA[11]. The Lung Adjuvant Cisplatin Evaluation (LACE), which was based on a pooled meta-analysis of five largest randomized trials, has demonstrated that cisplatin-based adjuvant chemotherapy improved survival in patients with completely resected NSCLC especially in stages II and III, but may have no benefit for patients with stage IA and only a marginal benefit for patients with stage IB [12]. However, the Japan Lung Cancer Research Group conducted adjuvant trials with uracil-tegafur, showing a survival benefit with adjuvant chemotherapy in stage IB LADs [13]. These results suggested that molecular mechanisms occurring in stage IB might be different from Stage IA.
Multiple studies have demonstrated the ability of signature genes, which derived from microarray expression profiles, to define cancer subtypes, recurrence of disease and response to specific therapies [14]. Several assays showed that the signature of stage I NSCLC alone could not reveal differences in outcome in patients with stage II disease, which indicated that existence of additional molecular mechanisms in more advanced lung carcinomas [15,16,17]. The various signal transduction pathways in LAD of different stages might help to find out the pivotal events in the tumor development.
DNA microarray technology provides a sufficient screening tool for searching differentially expressed genes (DEGs) by investigating the gene expression profile [18]. However, many microarray-based studies showed that some results were not reproducible [19]. It commonly resulted from improper analysis and insufficient control of false positives, and was often exacerbated by the small sample sizes [20]. Meta-analysis is an efficient, indispensable and inexpensive supplementary tool for the microarray data analysis. It uses statistical techniques to combine results from independent but related studies. Integrated information from multiple studies can improve the reliability and generalizability of the combined results, and the enhanced statistical power favored a more precise estimate of DEGs. The method of meta-analysis was gradually improved to achieve different research goals, such as robustifying cross-platform classification, and identifying overlaps from heterogeneous datasets of different cancers and tissues [21]. With the increasing number of available free public microarray datasets, meta-analysis of multiple datasets has been widely used and proved to be a useful method in searching DEGs [22].
Various studies had used microarray gene expression profiles to analyze oncogenic pathway [3]. Several molecular pathways involved in NSCLC malignancy have been revealed, such as Epidermal Growth Factor Receptor pathway (EGFR) and Bcl-2 pathway [23]. However, few studies focused on changes on the pathway level in cancer development. Most LADs are consist of more than one subtype [6]. In order to find the common features of these subtypes on pathway level, we performed the meta-analysis of the LAD microarray data to analyze the progression-associated genes and pathways in tumor development by stage comparison rather than survival signature analysis. Four LAD datasets was included in our analysis to search significantly regulated genes and pathways in comparisons between normal lung tissues and LADs of different stages, which was based on the TNM stage classification. Real-time PCR experiment was applied to verify the expression of genes in different LAD cell lines.
Material and Method
Meta-analysis
Data collection
Data used in this study were publicly available from cDNA and oligo (Affymetrix) microarrays experiments on LADs. Studies were eligible if they fulfilled all the following criteria: every single dataset must contain at least one stage with ≥3 of tumor samples, as well as at least ≥3 of normal tissues; stage information would be available for tumor samples. The raw data (CEL files) of oligo microarray and the normalized data of cDNA microarray were downloaded from the website. The tumor adjacent normal tissues were defined as normal tissue.
Four datasets, encompassing 353 patients, were eligible for our meta-analysis (Table 1). Dataset1 and dataset3 were downloaded from http://www.broad.mit.edu/cgi-bin/cancer/datasets.cgi [28] and http://caarraydb.nci.nih.gov/caarray/publicExperimentDetailAction.do?expId=1015897558050283 [29], respectively. Both dataset2 (GSE3398, [30]) and dataset4 (GSE10072, [31]) were downloaded from NCBI (http://www.ncbi.nlm.nih.gov/). Dataset 2 contained fewer samples than other datasets.
LAD gene expression datasets used in meta-analysis of microarrays
| Author | Normal | IA | IB | IIA | IIB | IIIA | IIIB | IV | Array type | Plate form | Total clones | Unique clones | |
|---|---|---|---|---|---|---|---|---|---|---|---|---|---|
| Dataset1 | Bhattacharjee et al. | 17 | 29 | 40 | 4 | 17 | 6 | 3 | 2 | oligo | GPL91 | 12625 | 8889 |
| Dataset2 | Garber et al. | 5 | 5 | 4 | 1 | 1 | 6 | 0 | 10 | cDNA | GPL2832/GPL2905 | 24192 | 9296 |
| Dataset3 | Beer et al. | 10 | 45 | 23 | 0 | 0 | 15 | 3 | 0 | oligo | GPL80 | 7129 | 5479 |
| Dataset4 | Landi et al. | 49 | 5 | 17 | 3 | 18 | 9 | 3 | 3 | oligo | GPL96 | 22283 | 12821 |
| Total | 81 | 84 | 84 | 8 | 36 | 36 | 9 | 15 |
The unique clones are identified with ref sequence ID.
Data processing
All the CEL files, which recorded the raw fluorescence intensity of the oligo microarrays, were preprocessed with the Robust Multichip Average (RMA) algorithm to normalize the data and generate more precise intensities for each probe. The calculation was performed with R language software and 'affy' program package from Bioconductor (http://www.bioconductor.org/). For cDNA microarray, the normalized data were applied directly in the following analysis and missing data were allowed. We transformed the diverse identifier of each gene from the different datasets into one form-ref sequence ID using program from http://genome-www5.stanford.edu/cgi-bin/source/sourceBatchSearch. The average value was calculated if a gene appeared more than once in a single dataset.
Data analysis
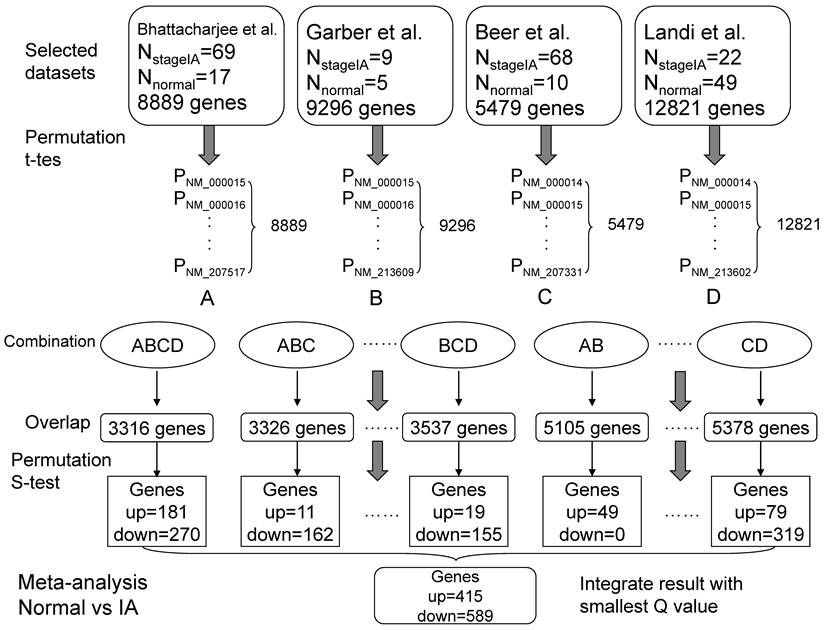
We performed the meta-analysis referred to Rhodes et al.'s method [24]. The significance assessment was based on two null hypotheses that no genes were up-regulated or no genes were down-regulated in LADs. Firstly, we performed 10 000 one-sided random permutation t tests for every single dataset between normal samples (group 1) and tumor samples (group 2, such as stage IA). For an individual gene, a t statistic (t) was calculated and compared with 10 000 t statistics generated by randomly assigning the samples, and each gene obtained a study-specific P(t) in every single dataset. P(t)s equaled to zero were set to 0.0001. Secondly, the overlapping genes from the different datasets combinations were selected and the relevant summary statistic (S) was calculated with the P(t)s from preceding random permutation t tests for each gene, based on Fisher's method for combining P values [25]. These actual S statistics then compared to 1 000 000 S statistics generated by randomly selecting a P(t) from each dataset. Finally, to control the false discovery rate (FDR), the genes were sorted by the P(s) values and a new statistic Q was calculated according to Benjamini and Hochberg' method [26] (Figure 1).
A model for meta-analysis of microarrays (Normal vs stage IA). Firstly, 10,000 one-sided random permutation t tests were performed between normal group and stage IA group in each dataset, and generated a series of P values. Secondly, the datasets were assigned to different combinations, such as all four datasets (ABCD). For a given combination, the overlapping genes and their corresponding P values were picked out. Thirdly, the random permutation s test (Formula 1) was calculated in every combination and the significant changed genes (up- or down- regulated in tumors compared with normal tissues) were screened with Q values (Q<0.1) (Formula 2). Formula 1: S = -2*log (p1) + -2*log (p2) + … + -2*log (pn). [p is P(t) value; n is the total number of datasets]. Formula 2: Q = (P*n)/i. [P is P(s) value; n is the total number of genes; i is the index of sorted P (s)].
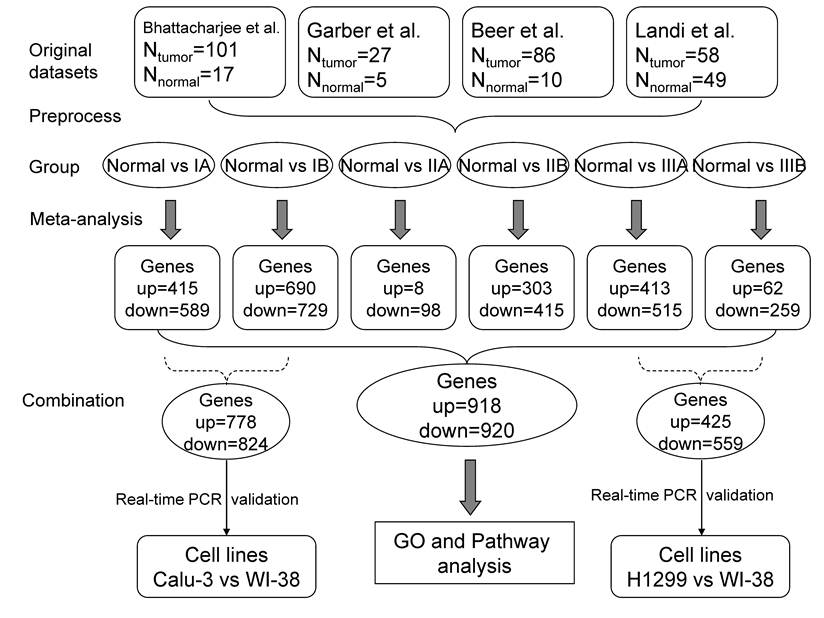
A designated gene might not exist in all eligible datasets, the meta-analysis of each comparison (e.g. Normal vs stage IA, Normal vs stage IB, etc.) (Figure 2) was performed in different dataset combinations (every two datasets, every three datasets etc.) to retain information as much as possible (Figure 1). Consequently, each gene might obtain several Q values and only the smallest Q value was used for the following analysis. All the calculation was implemented with perl software.
Flow diagrams for data analysis. The datasets were assigned into several comparison groups between normal tissues and LADs in different stages. The meta-analysis was performed in each comparison to generate significantly changed genes (see Figure 1 for details), which were reserved for GO and Pathway analysis. The randomly selected DEGs from Normal vs IA and Normal vs IB were tested in Calu-3 lung adenocarcinoma and WI-38 normal lung cell lines using real-time PCR; DEGs from Normal vs IIIA and Normal vs IIIB were validated with H1299 lung adenocarcinoma and WI-38 cell lines by real-time PCR.
Pathway and GO analysis
All the genes were imported into the pathway and GO analysis of the Genmapp software, which was downloaded from the web (http://www.genmapp.org/ version 2.1, Hs-std 20070817). Genes with Q<0.1 in the up-regulation or down-regulation groups were considered to be changed significantly. The remaining was considered as background genes. The associated pathways and GO were sorted by the Z score. The pathway was excluded if the number of hits ≤3. The pathway and GO with Z score >1.96 was considered to be significant in the Genmapp result.
Experiments
Cell culture
Lung adenocarcinoma cell lines (Calu-3 and H1299) and lung normal fibroblast cell line (WI-38) were obtained from Cell Bank of Type Culture Collection of Chinese Academy of Sciences (Shanghai, China). Calu-3 cells were grown in Eagle's Minimum Essential Medium (Invitrogen, Carlsbad, CA, USA), H1299 cells were grown in RPMI-1640 Medium (4.5g/L glucose) (Invitrogen), and WI-38 cell were grown in Eagle's Minimum Essential Medium, respectively. All the Medium were supplemented with 10% fetal bovine serum (Clarkbio, Seabrook, MD, USA) and antibiotics (100U/ml penicillin, 100 μg/ml streptomycin)(Invitrogen) and the cells were placed in a humidified atmosphere of 5% CO2 at 37 °C.
Real-time PCR
The total RNA of Calu-3, H1299 and WI-38 cells were extracted using Trizol reagent (Invitrogen) and the cDNA was synthesized with superscript III reverse transcription PCR kit (Invitrogen). Quantitative real-time PCR was performed in 7900HT Fast Real-time PCR System (Applied Biosystems, Foster, CA, USA) with 2X HotSybr PCR Reaction Mix (NuStar Laboratory, San Francisco, CA, USA). In order to avoid DNA contamination, all the oligo nucleotide primers were designed to target to different exons of the selected genes except for 18SrRNA, which has one single exon. The gene symbols and primers sequences of the amplified genes were shown in Table 2. The 18SrRNA and GAPDH were used as the endogenous controls. All PCR reactions were carried out with the following program: 2 min at 55 °C, 10 min at 95°C, and 40 cycles of 15s at 95°C and 1min at 60°C. After the amplification, the melting curve analysis was performed and the threshold cycles (Ct) was determined by the software SDS 2.3 (Applied Biosystems). The fold change of gene expression in WI-38 cells relative to Calu-3 or H1299 cells was calculated using 2-⊿⊿CT method [27].
The selected 18 candidate genes and primer sequence used in real-time PCR
| Gene Symbol | Primer Sequence | |
|---|---|---|
| A group | LIMK1 | 5'CCTGCGGAGCCTCAAGAA 3' |
| 5'GACGATCCCAAAGGAGAACAC 3' | ||
| TYRP1 | 5'TATGATACCCTGGGAACACT 3' | |
| 5'TTCCAAGCACTGAGCGACAT 3' | ||
| DDR1 | 5'GACACTATCCTCATCAACAACCG 3' | |
| 5'CTGGCTTCTCAGGCTCCATAT 3' | ||
| RUNX3 | 5'TGGCAGGCAATGACGAGA 3' | |
| 5'AGTGATGGTCAGGGTGAAACTC 3' | ||
| GRB7 | 5'GCAGGGCTTGGTAGACGG 3' | |
| 5'CCTCCTCCTCGCTCGG 3' | ||
| SMARCC1 | 5'ACCTCCTCCTACTCCTCATTTTA 3' | |
| 5'ACTGGTTTTTCCTTGTTTTTCTC 3' | ||
| CEACAM1 | 5'GGCATTGTGATTGGAGTAGTGG 3' | |
| 5'TTAGGTGGGTCATTGGAGTGG 3' | ||
| CTGF | 5'CTGCCCTCGCGGCTTAC 3' | |
| 5'GGAGATGCCCATCCCACA 3' | ||
| NT5E | 5'CCAATGGTGGAGATGGGTT 3' | |
| 5'CGACCTTCAACTGCTGGATAA 3 | ||
| B group | MPP1 | 5'CTTCTGCGAGATGACCCTCA 3' |
| 5'CACAGTATTCAATGGATGCGATA 3' | ||
| GPX3 | 5'CTGACGGGCCAGTACATTG 3' | |
| 5'GGTCGGACATACTTGAGGGT 3' | ||
| SPP1 | 5'GGGAGGGCTTGGTTGTCA 3' | |
| 5'AATCACTGCAATTCTCATGGTAGT 3' | ||
| ACE | 5'CTGCACCGTCACTACGGG 3' | |
| 5'GAAGGGAAGGGCACCACC 3' | ||
| VIM | 5'ACTTTTCCTCCCTGAACCTGA 3' | |
| 5'TCGTGATGCTGAGAAGTTTCG 3' | ||
| HMGA1 | 5'AGCGAAGTGCCAACACCTAA 3' | |
| 5'TGCCCTCCTCTTCCTCCTT 3' | ||
| STAT5A | 5'GCCTGTCCGTGTCCTGGT 3' | |
| 5'GTGGGGCTTGTGGTGCTT 3' | ||
| ID3 | 5'GTCCTGACACCTCCAGAACGC 3' | |
| 5'GGATTTGGTGAAGTCAAGTGGG 3' | ||
| CDKN1C | 5'GCTGCGGTGAGCCAATTT 3' | |
| 5'CGGTTGCTGCTACATGAACG 3' | ||
| Control | GAPDH | 5'TGAAGGTCGGAGTCAACGG 3' |
| 5'TGGGTGGAATCATATTGGAACA 3 | ||
| 18SrRNA | 5'TTGGTGGAGCGATTTGTCTG 3' | |
| 5'ATCTCGGGTGGCTGAACG 3' |
Results
Common gene expression changes in different stages
Totally, four datasets, encompassing 353 patients, were eligible for our meta-analysis (Table 1). Different combinations of datasets had different sets of overlapping genes, so we performed the meta-analysis for each possible combination (Figure 1). Genes with a Q<0.1 which significantly changed in mRNA expression level in different comparisons were defined as DEGs. We counted the number of significant Qs for each gene. Thus, a significant gene had at least one significant Q value. The overall Q value and the frequencies of the significant Qs were informative to evaluate the reliability of the result. We performed six comparisons between normal tissues and LADs in different stages (Figure 2). The comparison between normal and stage IV revealed no DEGs. In total, the expression of 1 838 DEGs were found in the six different comparisons (Additional file 1: Supplementary Table 1A and 1B), and 918 genes were up-regulated and 920 genes were down-regulated at least once.
The datasets, sample numbers, and number of DEGs in different comparisons were listed in Table 3. More DEGs might be obtained from more datasets combinations. Both Normal vs IIA and Normal vs IIB had 2 datasets, but more DEGs were found in the comparison of Normal vs IIB. After examining the samples of every stage, we found that stage IIA had fewer samples (4 samples in dataset1 and 3 samples in dataset4) than that of stage IIB (17 samples in dataset 1 and 18 samples in dataset 4). The comparison Normal vs IIIB included only 9 stage IIIB LAD samples from 3 datasets. Although fewer datasets was included in the comparison of Normal vs IIB, more DEGs (718) were found compared with that of Normal vs IIIB (321). Thus, smaller sample size might lead to fewer DEGs.
Datasets, samples and DEGs (Q<0.1) in the six comparisons
| Comparisons | Datasets | Normal | Tumor | DEGs | Pathways(Z>1.96) |
|---|---|---|---|---|---|
| Normal vs IA | 4 | 81 | 84 | 1004 | 42 |
| Normal vs IB | 4 | 81 | 84 | 1419 | 65 |
| Normal vs IIA | 2 | 66 | 7 | 106 | 4 |
| Normal vs IIB | 2 | 66 | 35 | 718 | 42 |
| Normal vs IIIA | 4 | 81 | 36 | 928 | 47 |
| Normal vs IIIB | 3 | 76 | 9 | 321 | 35 |
Many well-known metastasis-associated genes were found, such as ERBB2, PLAU and MMP9 [28,29,30]. Interestingly, some gene family members had similar regulation tendency. As shown in Table 4, eight genes (e.g. IL6R, IL4R and IL7R) of interleukin receptor family, thirteen genes (e.g. COL13A1 and COL1A1) of collagen family, eight genes (e.g. ITGB4 and ITGAV) of integrin family, eight genes (e.g. MMP9 and MMP13) of metalloproteinase family, thirteen genes of histone cluster, five genes of minichromosome maintenance (MCM) complex component families, and four genes of inhibitor of DNA binding (Id) family were significantly changed in the mRNA expression level compared with normal tissues. Those gene families had been shown to be involved in cancer progression. The high proliferation state of cancer cells is associated with an increased expression of MCM proteins that can be detected in both malignant precursor lesions and carcinomas [31]. As the synthesis of histones is tightly coupled with DNA replication during S-phase of the cell cycle, histone mRNA level is often a proliferative marker in cancers [32,33]. The overexpression of ITGAV had been found in several types of tumors to promote the invasion or be related with metastasis and late-stage [34,35]. The expression of β4 increases significantly during malignant progression in squamous carcinomas of multiple tissues, including head and neck, skin, cervix, and lung [36]. Type IV collagen is a major component in most basement membranes. During the process of stromal invasion of lung adenocarcinoma, type IV collagen of alveolar basement membrane is remodelled from the complete type, composed of 1(IV)/2(IV)/3(IV)/4(IV)/5(IV) chains, to the incomplete type, composed of only 1(IV)/2(IV) chains[37]. In our study, the expression levels of COL4A3 and COL4A5 (corresponding to the type IV collagen 3/4 chains) were down-regulated in the LADs.
The regulation of gene family members
| Gene Family | Up-regulation | Down-regulation | Proportion |
|---|---|---|---|
| Histone cluster | HIST1H1C,HIST1H2AC,HIST1H2AE,HIST1H2AG,HIST1H2BD,HIST1H2BE,HIST1H2BF,HIST1H2BI,HIST1H2BK,HIST1H3H,HIST2H2AA4,HIST2H2BE,HIST4H4 | 13/0 | |
| Matrix metallopeptidase | MMP1,MMP9,MMP11,MMP12,MMP13,MMP14,MMP15,MMP17 | 8/0 | |
| Interleukin receptor | IL1R1,IL3RA,IL4R,IL6R,IL7R,IL10RA,IL11RA,IL18R1 | 0/8 | |
| Minichromosome maintenance complex component | MCM2,MCM3,MCM4,MCM5,MCM6 | 5/0 | |
| Inhibitor of DNA binding | ID1,ID2,ID3,ID4 | 0/4 | |
| Collagen | COL11A1, COL10A1, COL3A1, COL5A2, COL1A2, COL9A3, COL9A2, COL1A1, COL5A1, COL7A1 | COL4A3,COL4A5,COL13A1 | 10/3 |
| Integrin | ITGAV, ITGB4 | ITGA5,ITGA6,ITGA7,ITGA8, ITGAL, ITGAX, | 2/6 |
Intriguingly, we found that most of the genes from the same gene family were up-regulated (or down-regulated). The similar trend of expression of these gene family members suggested coordinate regulation. Binding sites for ETS or AP-1 transcription factors are found in the promoters of MMP family and these transcription factors have been reported to regulate MMP gene expression [38]. Besides, several members of S100, HOX, CLDN, FOX, CDK family were among the DEGs. Genes with unknown functions in LAD development were also found.
Pathways and GO in different stages
We performed pathways and GO categories analyses from the six comparisons separately using the Genmapp software. The pathways and GOs with Z score > 1.96 were considered significant and ranked by their appearing times in the six comparisons (Additional file 1: Supplementary Table 2 and Table 3). Table 5 showed the top ten GO categories of the Genmapp result. Most of them were involved in the cancer development, plasma membrane and co-receptor/soluble ligand activity. Table 6 showed the top twenty-six pathways, which were significant in at least four comparisons, with rank value equal to 0 or 2.
Top 10 GOs derived from the six comparisons and its corresponding Z scores
| GO | Normal vs IA | Normal vs IB | Normal vs IIA | Normal vs IIB | Normal vs IIIA | Normal vs IIIB |
|---|---|---|---|---|---|---|
| coreceptor\soluble ligand activity | 5.328 | 4.434 | 17.157 | 6.381 | 5.551 | 9.573 |
| organ development | 7.546 | 8.741 | 6.988 | 7.613 | 8.211 | 8.94 |
| plasma membrane | 10.17 | 7.824 | 4.988 | 8.097 | 8.055 | 7.088 |
| system development | 7.92 | 7.609 | 7.15 | 7.1 | 7.259 | 8.943 |
| multicellular organismal process | 7.334 | 7.096 | 7.341 | 6.669 | 6.952 | 10.309 |
| multicellular organismal development | 7.058 | 7.078 | 7.254 | 6.515 | 7.17 | 8.867 |
| plasma membrane part | 9.112 | 7.037 | 5.561 | 6.942 | 7.899 | 7.065 |
| developmental process | 7.759 | 8.469 | 5.512 | 7.006 | 7.218 | 7.351 |
| anatomical structure development | 7.326 | 6.911 | 6.289 | 6.575 | 6.769 | 8.151 |
| platelet alpha granule | 5.328 | 4.434 | 8.52 | 6.381 | 5.551 | 9.573 |
Top 26 pathways derived from the six comparisons and its corresponding Z scores.
| Pathway | Normal vs IA | Normal vs IB | Normal vs IIA | Normal vs IIB | Normal vs IIIA | Normal vs IIIB | Rank |
|---|---|---|---|---|---|---|---|
| Hs_2-Tissues-Internal_Organs | 8.632 | 6.741 | 5.424 | 5.966 | 5.922 | 5.062 | 0 |
| Hs_Adipogenesis | 3.93 | 2.968 | 3.138 | 3.359 | 2.775 | 4.004 | 0 |
| Hs_1-Tissue-Blood_and_Lymph | 8.638 | 6.16 | 2.583 | 4.535 | 6.702 | / | 1 |
| Hs_2-Tissues-Blood_and_Lymph | 6.192 | 5.84 | / | 4.442 | 6.166 | 3.402 | 1 |
| Hs_IL-5_NetPath_17 | 6.048 | 6.114 | / | 5.106 | 5.178 | 4.192 | 1 |
| Hs_Complement_and_Coagulation_Cascades_KEGG | 5.673 | 4.175 | / | 4.042 | 6.004 | 3.947 | 1 |
| Hs_TGF-beta-Receptor_NetPath_7 | 5.339 | 5.428 | / | 3.432 | 4.383 | 2.822 | 1 |
| Hs_2-Tissues-Endocrine_and_CNS | 4.963 | 3.81 | / | 3.74 | 4.653 | 3.937 | 1 |
| Hs_Circadian_Exercise | 4.825 | 3.027 | / | 3.572 | 5.621 | 4.016 | 1 |
| Hs_Peptide_GPCRs | 4.297 | 2.135 | / | 2.674 | 3.802 | 3.449 | 1 |
| Hs_1-Tissue-Internal_Organs | 4.034 | 2.054 | / | 2.697 | 3.124 | 3.485 | 1 |
| Hs_Prostaglandin_synthesis_regulation | 3.467 | 4.481 | / | 2.554 | 3.699 | 3.683 | 1 |
| Hs_Statin_Pathway_PharmGKB | 3.244 | 2.362 | / | 4.215 | 3.439 | 4.179 | 1 |
| Hs_IL-3_NetPath_15 | 2.775 | 2.519 | / | 2.709 | 2.037 | 2.427 | 1 |
| Hs_Calcium_regulation_in_cardiac_cells | 2.701 | 3.39 | / | 2.869 | 2.217 | 3.311 | 1 |
| Hs_Focal_adhesion_KEGG | 2.355 | 4.011 | / | 3.331 | 5.787 | 3.706 | 1 |
| Hs_Eicosanoid_Synthesis | 2.322 | 2.867 | / | 2.282 | 2.491 | 5.242 | 1 |
| Hs_Glycolysis_Gluconeogenesis | 2.088 | 2.207 | / | 2.679 | 3.253 | 3.688 | 1 |
| Hs_Oxidative_Stress | / | 3.168 | / | 3.948 | 3.145 | 2.21 | 2 |
| Hs_Glycolysis_and_Gluconeogenesis | / | 2.275 | / | 2.306 | 3.153 | 2.833 | 2 |
| Hs_Integrin-mediated_cell_adhesion_KEGG | / | 2.758 | / | 2.277 | 2.687 | 3.477 | 2 |
| Hs_Matrix_Metalloproteinases | 2.982 | 2.524 | / | 2.647 | 1.953 | / | 2 |
| Hs_Id_NetPath_5 | 2.76 | 3.26 | / | / | 2.04 | 2.376 | 2 |
| Hs_Striated_muscle_contraction | 2.749 | 3.122 | / | 1.986 | / | 3.968 | 2 |
| Hs_IL-7_NetPath_19 | 2.25 | 3.405 | / | 3.901 | 4.01 | / | 2 |
| Hs_EGFR1_NetPath_4 | 2.141 | 2.625 | 3.038 | / | / | 2.714 | 2 |
The “/” suggested that the Z score<=1.96
Besides the well-known cancer-related pathways, the Adipogenesis, Circadian exercise, and Id pathway are important pathways revealed by our analysis. White adipose tissues could synthesize and secrete adipokines, which played important roles in inflammation, angiogenesis, lipid metabolism, cell proliferation, apoptosis, and cell differentiation [39]. The adipogenesis pathway had not been reported to be a significantly regulated pathway (SRP) in LAD before. Our result indicated it might play important roles in the development of LAD. Circadian clock genes were involved in cell proliferation, apoptosis, cell cycle control, and DNA damage, and many of them were silenced in cancer cells [40,41,42,43,44]. Id pathway included four important inhibitor of differentiation/DNA binding (ID) family members, ID1, ID2, ID3 and ID4, which had been reported to be critical in cell differentiation and proliferation [45].
Validation of common cancer genes by real-time PCR
Normal lung fibroblast cell line WI-38 and two LAD cell lines Calu-3 and H1299 were used for qRT-PCR gene expression validation. Calu-3 had medium tumorigenicity but no metastasis characteristic, while H1299 had high tumorigenic and metastasis capacity. The genes in group A (Table 2) were tested by WI-38 and Calu-3 cell lines. They were randomly selected from the DEGs from comparisons of Normal vs IA and Normal vs IB, but did not significantly changed in mRNA expression level in comparisons of Normal vs IIIA and Normal vs IIIB; the genes in group B were verified with WI-38 and H1299 cell lines. They were DEGs (Q<0.05) randomly selected from the comparisons of Normal vs IIIA and Normal vs IIIB.
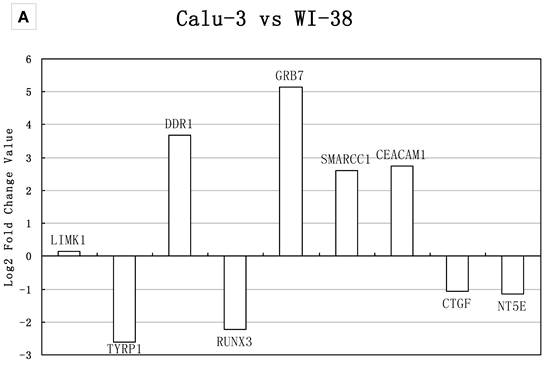
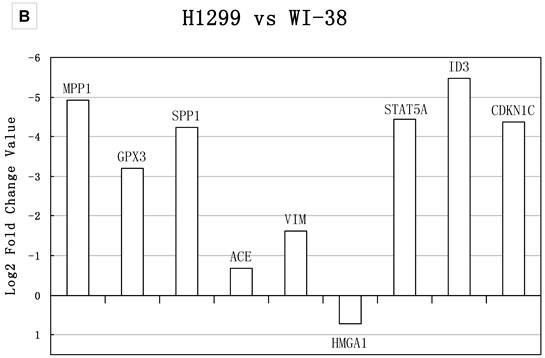
It was important to notice that in our meta-analysis, housekeeping genes GAPDH and HPRT1 were overexpressed in LAD compared to normal tissues. The result was in consistent with Nguewa et al.'s study, in which they found the GAPDH and HPRT1 were not good internal control genes in lung tissue specimens, but the two genes could be used as internal controls when lung cell lines were applied for the experiment [46]. Our qRT-PCR assay demonstrated that the expression level of GAPDH was stable in the three different lung cell lines. Thus, we used both GAPDH and 18SrRNA as internal controls. The genes with log 2 ratios ≥1 or ≤−1 were determined as significantly changed (overexpressed or underexpressed). As shown in Figure 3, if we considered the significant changes in expression level, the two methods (meta-analysis and real-time PCR) showed 77% consistency in group A and 66% in group B; If we considered the expression tendency, the two methods had matched over 90%. SPP1 showed the opposite regulation tendency (Figure 3B). However, a homozygous partial deletion of p53 protein was existed in H1299 cell line, which might result in the down-regulation of SPP1, a target of p53 and was down-regulated when p53 was silenced [47]. Similar result was obtained when used 18SrRNA as internal control (data not shown). Our analysis suggested a possible relationship between these genes and LAD metastasis.
Real-time PCR validations of 18 candidate genes. Bars represent log2 fold changes of the selected genes with differential expression between A) Calu-3 and WI-38, B) H1299 and WI-38. Positive represents up-regulated and negative represents down-regulated in tumor cells compared with normal lung cells. The group A gene TYRP1, DDR1, RUNX3, GRB7, SMARCC1, CEACAM1, CTGF showed >2-fold change in mRNA expression level, which were in consistency with the result of meta-analysis. NT5E and LIMK1 showed no significant change in mRNA expression; the fold changes were 1.19 and 1.1, respectively. The group B gene MPP1, GPX3, ACE, STAT5A, ID3 and CDKN1C showed >2-fold change in mRNA expression level, which were in consistency with the result of meta-analysis. The expression of VIM and HMGA1 had the same up- and down- regulation tendency compared with the meta-analysis result, but showed no significant change in real-time PCR analysis. SPP1 showed the opposite regulation tendency.
Sample size, DEGs and pathways
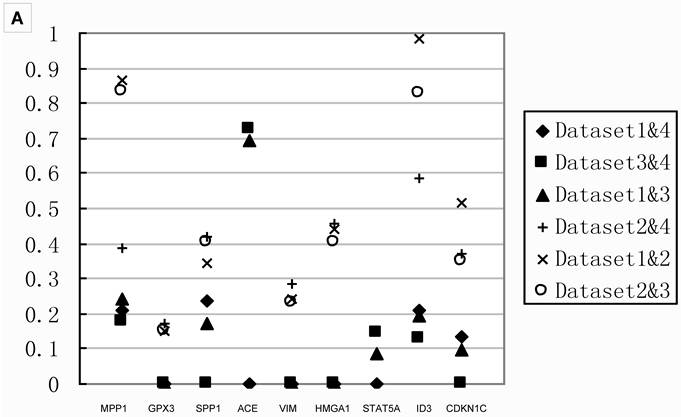
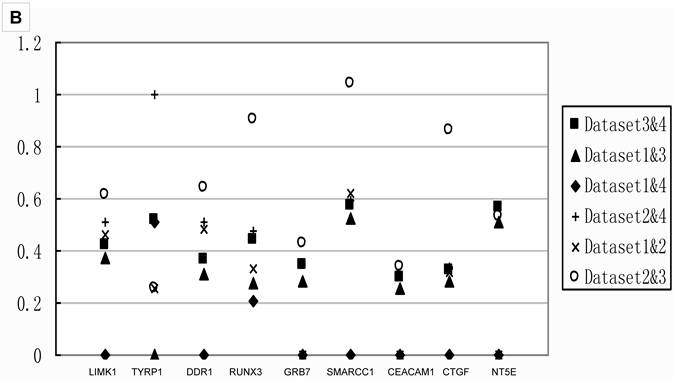
Table 3 showed that small sample size in the comparison would lead to fewer DEGs. To investigate the effects of sample size, we compared the Q values of meta-analysis combining only two datasets for the 18 genes tested with real-time PCR. The results in Figure 4 showed that the Q values from meta-analyses combining Dataset2, the one had the smallest sample size, always showed higher Q value than those analyses combined without Dataset2. Thus, meta-analysis integrating small sample size dataset led to fewer DEGs, as well as false negative.
Q values of two datasets combinations for 18 genes A) the Q values of stage IIIA from all two datasets combinations for 9 genes in group B. All the Q values from the meta-analyses integrating Dataset2 are on the top part, which indicated datasets with smaller sample size contributed to false negatives; B) the Q values of stage IB from all two datasets combinations for 9 genes in group A.. The Q values for those integrated Dataset2 tend to be on the top part too. Combination integrated Dataset2 were shown as solid. Note that Dataset2 did not contain the genes ACE and STAT5A. The result of stage IA was shown in Additional file 2: Supplementary Figure 1.
The pathway calculation in Genmapp was influenced by the number of DEGs and total genes. Since we imported the same total genes in the six comparisons, the calculation of significantly regulated pathways (SRPs) were mainly determined by the DEGs. More DEGs would result in more SRPs (Table 3). The comparison Normal vs IIA revealed only 4 SRPs which might arise from fewer DEGs. Thus, we only compared the SRPs in other five comparisons.
Interestingly, if comparison Normal vs IIA was deleted in the pathway analysis, we found that Oxidative Stress, Glycolysis/Gluconeogenesis and Integrin-mediated cell adhesion pathways were not significant in the comparison of Normal vs IA, but were significant (Z>1.96) in other four comparisons.
Many types of cancer cell had increased levels of reactive oxygen species (ROS), which could cause DNA damage and might trigger tumor initiation, and the ROS-induced oxidative stress could contribute to tumor development not only through genetic, but also through epigenetic mechanisms [48,49]. In our analysis, two important anti-oxidant genes in Oxidative Stress pathway exhibit varied expression between Stage IA and others. The ECSOD (SOD3), a mainly extracellular superoxide dismutase, was not a DEG in normal vs stage IA, while GCLC, which catalyses the initial rate limiting step of GSH synthesis, was significantly overexpressed in stage IB, IIB, IIIA and IIIB compared with normal tissues, other than in stage IA.
Most tumor cells displayed high rates of glycolysis, which could provide more nutrition and energy for the proliferation [50]. The LDHA, an important gene in Glycolysis/Gluconeogenesis pathway, was significantly overexpressed in stage IB, IIB and IIIA, but not in stage IA, compared with normal tissues. Integrin-mediated cell adhesion pathway, which mediated interaction between the tumor cell and the matrix, was closely associated with metastasis [51]. In our study, integrin alpha V (ITGAV) was significantly up-regulated in stage IB and IIB, but not in stage IA.
Discussion
The development of lung cancer was a complex and gradual process. In this study, we combined four LAD gene expression studies based on Affymetrix and cDNA microarray platforms, to find LAD progression-associated genes and pathways using meta-analysis strategy. The increased sample size was intended to control false positives and increase statistical power in detecting important DEGs.
Different stages of LAD were compared with lung normal tissues to preserve information on the progress of metastasis. GO analysis indicated that many genes were involved in carcinogenesis and metastasis process-related categories, such as cell migration (CEACAM1, CXCL12, CTGF), cell proliferation (HDGF, MDK), cell motility (SPP1), cell adhesion (CDH1), and angiogenesis (ANGPT1). There were several well-known cancer-related pathways were found, which included TGF-beta, Focal adhesion, EGFR, Fas, TNF-alpha-NF-kB, MAPK, p38 MAPK, Wnt, Matrix Metalloproteinases (MMP), Integrin-mediated cell adhesion and IL pathways[52]. Some of them played significant roles in the progress of many kinds of tumors. Specially, the focal adhesion, MMP, integrin-mediated cell adhesion, and regulation of Actin Cytoskeleton pathways were closely related to metastasis, which mediated interaction between the tumor cell and the matrix [28,29,51,53].
Adipogenesis, Circadian exercise, and Id pathway are important pathways revealed by our analysis. Typical functions of white adipose tissue were triglycerol storage and energy utilization. Recent studies indicated that white adipose tissue is a multi- functional endocrine organ that synthesizes and secretes adipokines (cytokine-like proteins). Many adipokines have a pivotal role in inflammation, angiogenesis, lipid metabolism, cell proliferation, apoptosis, and cell differentiation [39]. On the other hand, inducers derived from cancer cells significantly induced or enhanced adipogenesis [54]. Specially, it has recently been shown that MMP11 is induced in adipose tissue by cancer cells as they invade their surrounding environment [55]. Additionally, MMP2 and MMP9, which had been proved to take important effect on metastasis, were also produced and secreted by adipocytes in the adipose differentiate [28,56].
There is growing evidence that many cellular clock genes were silenced in cancer cells[41]. Loss and dysregulation of PER1 and PER2, two important circadian rhythm genes, have been found in many types of human cancers [40,41,42,43,44]. PER1 was found to be silenced in 70% NSCLC patients [57]. ID1, ID2, ID3 and ID4 in Id pathway had been reported to be critical in cell differentiation and proliferation [45]. Only in the last two years, the ID genes had been reported in the small cell lung cancer (ID1, ID2, ID3 and ID4) and NSCLC (ID2) [58,59].
In addition, pathways involved in metabolism were revealed to be associated with LAD progress in our study. Prostaglandin, a ubiquitous hormone in human body, could stimulate human lung carcinoma cell growth, and the critical genes in prostaglandin synthesis had been proved to be associated with carcinogenesis [60,61,62]. The statin (a cholesterol-lowering agent) pathway functioned in the cholesterol metabolism and circulation had been found to be related to cancer development [63,64,65,66]. Meanwhile, the metabolism of amino acid, nucleotide and other materials might also be accelerated during the process of metastasis. We identified a group of genes, which might associate with the complicated metastasis process in LAD. These genes were involved in a wide pathway network. They provided more information, and supplemented the well-known cancer-associated pathways.
The additional molecular mechanisms might exist in more advanced lung carcinomas such as stage II [15,16,17]. However, no comparison of the potential molecular mechanisms had been made among different stages of LAD. In our study, Oxidative stress, Glycolysis/Gluconeogenesis and Integrin-mediated cell adhesion pathways were showed to be significant in stages other than IA.
There were evidences that compared with normal counterparts, many types of cancer cell had increased levels of reactive oxygen species (ROS) [48,49]. Mori et al.'s study demonstrated that the invasive potential could be induced under long-term oxidative stress in mammary epithelial [67]. This antioxidant enzyme in Oxidative stress pathway was the major determinant in decreasing extracellular oxidant stress and might have fundamental effects on the extracellular redox state of lung tumors with potential consequences on tumor behavior [68]. Increased intracellular ROS (lipid peroxidation) and superoxide production were related with down-regulated ECSOD in NSCLC [69]. Several studies suggested that cells with active c-Myc may survive the ROS stress by up-regulating glutathione (GSH) synthesis, an important antioxidant in Oxidative stress pathway to minimize the oxidative damage [70]. GCLC catalyses the initial rate limiting step of GSH synthesis. Ray et al.'s assay demonstrated that the up-regulation of GCLC mRNA in lung cancer cell lines (H292) could be induced by ROS [71].
Despite in the presence of a high O2 concentration, the glycolysis was enhanced in tumor cells, and provided more nutrition and energy for the proliferation [50]. Most tumor cells displayed high rates of glycolysis, aerobic or anaerobic, and many glycolytic tumor cells were also found to be aggressive [72]. Wu et al.'s study demonstrated that A549 cells displayed a dependency on glycolysis and significantly up-regulated this pathway when their respiration was inhibited [73]. The LDHA is an important member in Glycolysis/Gluconeogenesis pathway. It could convert pyruvate, the product of glycolysis, into lactate and created an acidic environment to promote the invasion of cancer cells [74].
Integrin-mediated cell adhesion pathway was closely associated with cell proliferation, maintenance, mobility and metastasis [51]. The overexpression of ITGAV had been found in several types of tumors to be related to metastasis and late-stage [34,35]. In Koukoulis et al.'s immunohistochemistry assay, the LADs obtained the most strong staining for ITGAV, while the carcinoids and bronchoalveolar carcinoma (BAC), a subtype of LAD which has no stromal, vascular, or pleural invasion, showed weak staining[75,76]. In addition, FYN, a member of Src family kinases, played an important role as a mediator of metastatic progression of disease apart from local tumor growth [77]. There were hardly any experiments had been carried out on lung cancer about FYN.
The difference between stage IA and stage IB in TNM staging was only the tumor size. Our pathway analysis showed that Oxidative stress, Glycolysis/Gluconeogenesis and Integrin-mediated cell adhesion pathways were SPRs in stage IB but not in stage IA. Genes and pathways conferring more aggressive proliferation and invasive character might be activated in the preinvasive stages, such as stage IB. The significance of the finding was that the character of stage IB was toward to advanced stages, the early stage of LAD might be stage IA only.
The lung adjuvant cisplatin-based chemotherapy might be effective to stage IB and more advanced stages but not stage IA [12]. Cisplatin is believed to form adducts with DNA, inhibiting replication and transcription [78]. However, several recent studies have shown that the cytotoxicity of cisplatin may also be related to the cellular defense systems that protect against oxidative stress induced by hydroperoxides in cancer cells. Simons et al. demonstrated that 2-Deoxy-D-Glucose (2DG), an agent for glucose deprivation, combined with cisplatin enhances cytotoxicity via metabolic oxidative stress in human head and neck cancer cells [79]. The agent also increased the efficacy of Adriamycin and paclitaxel in human osteosarcoma and NSCLC in vivo, according to Maschek et al.'s assay [80].
The products of glucose metabolism, pyruvate (from glycolysis) and NADPH (from the pentose cycle), are believed to play a role in hydroperoxide detoxification[81,82]. So, the up-regulation in glucose metabolism in cancer cells might also be necessary to produce more pyruvate to compensate for the increased hydroperoxides. The insignificance of Oxidative stress and the Glycolysis/Gluconeogenesis pathways in stage IA might explain the less benefit with adjuvant chemotherapy. Our pathway analysis result suggested strong connections between Oxidative stress and cisplatin-based adjuvant chemotherapy, as well as the Glycolysis/Gluconeogenesis pathways.
These three pathways revealed the potential molecular mechanisms differences among different stages. Moreover, comparing the stage IA and stage IB, stage IB had more favorable mechanism to have node involvement potential. It emphasized again the importance of tumor size in TNM staging. The insignificant three pathways in stage IA might be used in early stage detection of LAD. Whether the genes in these three pathways might be used for prognosis signature need further investigation.
We noticed that some DEGs were found in the comparison of Normal vs IA and IB, but not found in the comparison of Normal vs IIIA and IIIB. However, DEGs in the comparison of Normal vs IIIA and IIIB were often showed in the comparison of Normal vs IA and IB, which indicated that mechanism of progression to stage III is different from that to stage I. We did not compare the data in stage II due to it is interim stage and few datasets (2 datasets) were involved in the meta-analysis.
We randomly selected 18 genes to verify the meta-analysis result with real-time PCR using LAD cell line Calu-3 and H1299 to mimic the human lung LAD with and without metastasis. Two genes showed opposite regulation tendency in the real-time PCR compared with the meta-analysis result. In the group A, NT5E had a fold change of 1.19, and the up-regulation Q value was 0.0000084866 which was only found in the comparison of Normal vs IB; in the group B, SPP1 was significantly down-regulation in real-time PCR instead of up-regulation in the meta-analysis. The other three genes, LIMK1, VIM and HMGA1 were in the same expression tendencies in the two analyses, but showed no significant expression change in real time PCR.
Number of DEGs was dependent on the sample size and the number of datasets combined. When an individual comparison included more datasets, the small sample size of some datasets might not affect the final result if DEGs were integrated from different combinations. However, when few datasets were included, the impact of the small sample size on DEGs might be obvious, such as the comparison Normal vs IIA. It might also be the main reason why the comparison between normal and stage IV revealed no DEGs. The comparison could be made in only one combination (Dataset2 and Dataset4), and the samples of stage IV were both fewer in these datasets. Further analysis should be taken, when more eligible datasets for stage IV are available.
Conclusion
We identified a group of genes, which might associate with the complicated metastasis process in LAD using meta-analysis of different microarray datasets. These genes involved in wider pathways differences among different LAD stages. Among them, the adipogenesis pathway had not been reported to be a SRP in LAD, while the involvement of ID pathway in NSCLC was only reported in the last two years. Most of the genes from the same gene family were found to be up-regulated (or down-regulated). The similar trend of expression of these gene family members suggested coordinate regulation. Importantly, meta-analysis lead to fewer DEGs and produced higher probability of false negatives when integrating datasets with smaller sample size. Cautions should be taken when interpreted the result of meta-analysis with small sample size involved. The insignificant three pathways (Oxidative stress, Glycolysis/Gluconeogenesis and Integrin-mediated cell adhesion pathways) in stage IA might be used in early-stage detection of LAD.
Supplementary Material
Additional File 1Supplementary Table 1: The expression of 1 838 DEGs in the six different comparisons. Supplementary Table 2: All pathways derived from the six comparisons and its corresponding Z scores. Supplementary Table 3: All GOs derived from the six comparisons and its corresponding Z scores.
Supplementary Figure 1: The Q values of stage IA from all two datasets combinations for 9 genes in group A.
Acknowledgements
We would like to thank the contributors for releasing the microarray datasets. We also appreciate Fenghua Guo's work on Perl program. This research was supported by National Natural Science Foundation of China grant 31071223 and Ministry of Education of China grant 20070246153.
Authors' contributions
CC participated in the design of the study, performed the statistical analysis and drafted the manuscript. XF participated in the statistical analysis and helped to draft the manuscript. DZ and YL (Yuan Li) participated in cancer cells culture and carried out real-time PCR assay. YX participated in the statistical analysis. YL (Yao Li) organized all the research and provided advice for preparing the manuscript. YH conceived of the study, organized all the research, participated in its design and coordination and helped to revise the manuscript. All authors read and approved the final manuscript.
Conflict of Interests
The authors have declared that no conflict of interest exists.
References
1. Jemal A, Thun MJ, Ries LA, Howe HL, Weir HK. et al. Annual report to the nation on the status of cancer, 1975-2005, featuring trends in lung cancer, tobacco use, and tobacco control. J Natl Cancer Inst. 2008;100:1672-1694
2. Kopfstein L, Christofori G. Metastasis: cell-autonomous mechanisms versus contributions by the tumor microenvironment. Cell Mol Life Sci. 2006;63:449-468
3. Bild AH, Yao G, Chang JT, Wang Q, Potti A. et al. Oncogenic pathway signatures in human cancers as a guide to targeted therapies. Nature. 2005;439:353-357
4. Mareel M, Leroy A. Clinical, cellular, and molecular aspects of cancer invasion. Physiol Rev. 2003;83:337-376
5. Nordquist LT, Simon GR, Cantor A, Alberts WM, Bepler G. Improved survival in never-smokers vs current smokers with primary adenocarcinoma of the lung. Chest. 2004;126:347-351
6. Travis WD, Garg K, Franklin WA, Wistuba II, Sabloff B. et al. Bronchioloalveolar carcinoma and lung adenocarcinoma: the clinical importance and research relevance of the 2004 World Health Organization pathologic criteria. Journal of Thoracic Oncology. 2006;1:S13
7. Travis WD, Brambilla E, Muller-Hermelink HK, Harris CC. Pathology and genetics of tumours of the lung, pleura, thymus and heart. Lyon: Iarc. 2004
8. Kratz JR, Jablons DM. Genomic Prognostic Models in Early-Stage Lung Cancer. Clinical Lung Cancer. 2009;10:151-157
9. Rami-Porta R, Crowley JJ, Goldstraw P. The revised TNM staging system for lung cancer. Ann Thorac Cardiovasc Surg. 2009;15:4-9
10. Spira A, Ettinger DS. Multidisciplinary management of lung cancer. New England Journal of Medicine. 2004;350:379
11. Booth CM, Shepherd FA. Adjuvant chemotherapy for resected non-small cell lung cancer. Journal of Thoracic Oncology. 2006;1:180
12. Tsuboi M, Ohira T, Saji H, Miyajima K, Kajiwara N. et al. The present status of postoperative adjuvant chemotherapy for completely resected non-small cell lung cancer. Annals of Thoracic and Cardiovascular Surgery. 2007;13:73
13. Kato H, Ichinose Y, Ohta M, Hata E, Tsubota N. et al. A randomized trial of adjuvant chemotherapy with uracil-tegafur for adenocarcinoma of the lung. The New England journal of medicine. 2004;350:1713
14. Ramaswamy S, Golub TR. DNA microarrays in clinical oncology. Journal of Clinical Oncology. 2002;20:1932
15. Chen HY, Yu SL, Chen CH, Chang GC, Chen CY. et al. A five-gene signature and clinical outcome in non-small-cell lung cancer. The New England journal of medicine. 2007;356:11
16. Bianchi F, Nuciforo P, Vecchi M, Bernard L, Tizzoni L. et al. Survival prediction of stage I lung adenocarcinomas by expression of 10 genes. J Clin Invest. 2007;117:3436-3444
17. Lau SK, Boutros PC, Pintilie M, Blackhall FH, Zhu CQ. et al. Three-gene prognostic classifier for early-stage non small-cell lung cancer. Journal of Clinical Oncology. 2007;25:5562
18. Alizadeh AA, Eisen MB, Davis RE, Ma C, Lossos IS. et al. Distinct types of diffuse large B-cell lymphoma identified by gene expression profiling. Nature. 2000;403:503-511
19. Ntzani EE, Ioannidis JP. Predictive ability of DNA microarrays for cancer outcomes and correlates: an empirical assessment. Lancet. 2003;362:1439-1444
20. Jafari P, Azuaje F. An assessment of recently published gene expression data analyses: reporting experimental design and statistical factors. BMC Med Inform Decis Mak. 2006;6:27
21. Warnat P, Eils R, Brors B. Cross-platform analysis of cancer microarray data improves gene expression based classification of phenotypes. BMC Bioinformatics. 2005;6:265
22. Ramasamy A, Mondry A, Holmes CC, Altman DG. Key issues in conducting a meta-analysis of gene expression microarray datasets. PLoS Med. 2008;5:e184
23. Brambilla E, Gazdar A. Pathogenesis of lung cancer signalling pathways: roadmap for therapies. European Respiratory Journal. 2009;33:1485
24. Rhodes DR, Barrette TR, Rubin MA, Ghosh D, Chinnaiyan AM. Meta-analysis of microarrays: interstudy validation of gene expression profiles reveals pathway dysregulation in prostate cancer. Cancer Res. 2002;62:4427-4433
25. Adams MD, Soares MB, Kerlavage AR, Fields C, Venter JC. Rapid cDNA sequencing (expressed sequence tags) from a directionally cloned human infant brain cDNA library. Nat Genet. 1993;4:373-380
26. Benjamini Y, Hochberg Y. Controlling the False Discovery Rate: A Practical and Powerful Approach to Multiple Testing. Journal of the Royal Statistical Society, Series B (Methodological). 1995;57(1):289-300
27. Livak KJ, Schmittgen TD. Analysis of relative gene expression data using real-time quantitative PCR and the 2(-Delta Delta C(T)) Method. Methods. 2001;25:402-408
28. Luo Y, Liang F, Zhang ZY. PRL1 Promotes Cell Migration and Invasion by Increasing MMP2 and MMP9 Expression through Src and ERK1/2 Pathways (dagger). Biochemistry. 2009;48:1838-1846
29. Cheng CY, Hsieh HL, Sun CC, Lin CC, Luo SF. et al. IL-1 beta induces urokinase-plasminogen activator expression and cell migration through PKC alpha, JNK1/2, and NF-kappaB in A549 cells. J Cell Physiol. 2009;219:183-193
30. Kedrin D, Wyckoff J, Boimel PJ, Coniglio SJ, Hynes NE. et al. ERBB1 and ERBB2 Have Distinct Functions in Tumor Cell Invasion and Intravasation. Clin Cancer Res. 2009;15:3733-3739
31. Malinowski DP. Minichromosome Maintenance (MCM) Proteins as Tumor Markers: The Detection of MCM Proteins as Markers of Aberrant S-Phase Entry in Cervical Neoplasia. Tumor Markers Research Focus. 2007:47
32. S owiński J, Mazurek U, Bierzyńska-Macyszyn G. Histone mRNA in situ hybridization in assessing proliferative activity of normal and malignant cells. Folia histochemica et cytobiologica/Polish Academy of Sciences, Polish Histochemical and Cytochemical Society. 2002;40:335
33. Orchel J, Slowinski J, Mazurek U, Wilczok T. H3 mRNA level as a new proliferative marker in astrocytomas. BBA-Molecular Basis of Disease. 2004;1689:42-46
34. Lu JG, Sun YN, Wang C, Jin DJ, Liu M. Role of the αv-integrin subunit in cell proliferation, apoptosis and tumor metastasis of laryngeal and hypopharyngeal squamous cell carcinomas: a clinical and in vitro investigation. European Archives of Oto-Rhino-Laryngology. 2009;266:89-96
35. Marsh D, Dickinson S, Neill GW, Marshall JF, Hart IR. et al. {alpha} v {beta} 6 Integrin Promotes the Invasion of Morphoeic Basal Cell Carcinoma through Stromal Modulation. Cancer research. 2008;68:3295
36. Giancotti FG. Targeting integrin β4 for cancer and anti-angiogenic therapy. Trends in Pharmacological Sciences. 2007;28:506-511
37. Nakano KY, Iyama KI, Mori T, Yoshioka M, Hiraoka T. et al. Loss of alveolar basement membrane type IV collagen 3, 4, and 5 chains in bronchioloalveolar carcinoma of the lung. J Pathol. 2001;194:420-427
38. Miyoshi A, Kitajima Y, Sumi K, Sato K, Hagiwara A. et al. Snail and SIP1 increase cancer invasion by upregulating MMP family in hepatocellular carcinoma cells. British journal of cancer. 2004;90:1265
39. Trayhurn P, Wood IS. Adipokines: inflammation and the pleiotropic role of white adipose tissue. Br J Nutr. 2004;92:347-355
40. Kuo SJ, Chen ST, Yeh KT, Hou MF, Chang YS. et al. Disturbance of circadian gene expression in breast cancer. Virchows Arch. 2009;454:467-474
41. Mostafaie N, Kallay E, Sauerzapf E, Bonner E, Kriwanek S. et al. Correlated downregulation of estrogen receptor beta and the circadian clock gene Per1 in human colorectal cancer. Mol Carcinog. 2009;48:642-647
42. Pogue-Geile KL, Lyons-Weiler J, Whitcomb DC. Molecular overlap of fly circadian rhythms and human pancreatic cancer. Cancer Lett. 2006;243:55-57
43. Yeh KT, Yang MY, Liu TC, Chen JC, Chan WL. et al. Abnormal expression of period 1 (PER1) in endometrial carcinoma. J Pathol. 2005;206:111-120
44. Lin YM, Chang JH, Yeh KT, Yang MY, Liu TC. et al. Disturbance of circadian gene expression in hepatocellular carcinoma. Mol Carcinog. 2008;47:925-933
45. Lasorella A, Uo T, Iavarone A. Id proteins at the cross-road of development and cancer. Oncogene. 2001;20:8326-8333
46. Nguewa PA, Agorreta J, Blanco D, Lozano MD, Gomez-Roman J. et al. Identification of importin 8 (IPO8) as the most accurate reference gene for the clinicopathological analysis of lung specimens. BMC Mol Biol. 2008;9:103
47. Morimoto I, Sasaki Y, Ishida S, Imai K, Tokino T. Identification of the osteopontin gene as a direct target of TP53. Genes Chromosomes Cancer. 2002;33:270-278
48. Toyokuni S, Okamoto K, Yodoi J, Hiai H. Persistent oxidative stress in cancer. FEBS Lett. 1995;358:1-3
49. Franco R, Schoneveld O, Georgakilas AG, Panayiotidis MI. Oxidative stress, DNA methylation and carcinogenesis. Cancer Lett. 2008;266:6-11
50. Moreno-Sanchez R, Rodriguez-Enriquez S, Saavedra E, Marin-Hernandez A, Gallardo-Perez JC. The bioenergetics of cancer: Is glycolysis the main ATP supplier in all tumor cells? Biofactors. 2009;35:209-225
51. Chen X, Sievers E, Hou Y, Park R, Tohme M. et al. Integrin alpha v beta 3-targeted imaging of lung cancer. Neoplasia. 2005;7:271-279
52. Vogelstein B, Kinzler KW. Cancer genes and the pathways they control. Nat Med. 2004;10:789-799
53. Carelli S, Zadra G, Vaira V, Falleni M, Bottiglieri L. et al. Up-regulation of focal adhesion kinase in non-small cell lung cancer. Lung Cancer. 2006;53:263-271
54. Hirano T, Morii H, Nakazawa K, Murakami D, Yamashita A. et al. Enhancement of adipogenesis induction by conditioned media obtained from cancer cells. Cancer Lett. 2008;268:286-294
55. Motrescu ER, Rio MC. Cancer cells, adipocytes and matrix metalloproteinase 11: a vicious tumor progression cycle. Biol Chem. 2008;389:1037-1041
56. Bouloumie A, Sengenes C, Portolan G, Galitzky J, Lafontan M. Adipocyte produces matrix metalloproteinases 2 and 9: involvement in adipose differentiation. Diabetes. 2001;50:2080-2086
57. Gery S, Komatsu N, Kawamata N, Miller CW, Desmond J. et al. Epigenetic silencing of the candidate tumor suppressor gene Per1 in non-small cell lung cancer. Clin Cancer Res. 2007;13:1399-1404
58. Kamalian L, Gosney JR, Forootan SS, Foster CS, Bao ZZ. et al. Increased expression of Id family proteins in small cell lung cancer and its prognostic significance. Clin Cancer Res. 2008;14:2318-2325
59. Rollin J, Blechet C, Regina S, Tenenhaus A, Guyetant S. et al. The intracellular localization of ID2 expression has a predictive value in non small cell lung cancer. PLoS ONE. 2009;4:e4158
60. Greenhough A, Smartt HJ, Moore AE, Roberts HR, Williams AC. et al. The COX-2/PGE2 pathway: key roles in the hallmarks of cancer and adaptation to the tumour microenvironment. Carcinogenesis. 2009;30:377-386
61. Murata T, Lin MI, Aritake K, Matsumoto S, Narumiya S. et al. Role of prostaglandin D2 receptor DP as a suppressor of tumor hyperpermeability and angiogenesis in vivo. Proc Natl Acad Sci U S A. 2008;105:20009-20014
62. Zheng Y, Ritzenthaler JD, Sun X, Roman J, Han S. Prostaglandin E2 stimulates human lung carcinoma cell growth through induction of integrin-linked kinase: the involvement of EP4 and Sp1. Cancer Res. 2009;69:896-904
63. Boudreau DM, Yu O, Miglioretti DL, Buist DS, Heckbert SR. et al. Statin use and breast cancer risk in a large population-based setting. Cancer Epidemiol Biomarkers Prev. 2007;16:416-421
64. Antoine-Jonville S, Hue O. Cholesterol, statins, and mortality. Lancet. 2008;371:1163
65. Cauley JA, McTiernan A, Rodabough RJ, LaCroix A, Bauer DC. et al. Statin use and breast cancer: prospective results from the Women's Health Initiative. J Natl Cancer Inst. 2006;98:700-707
66. Kuoppala J, Lamminpaa A, Pukkala E. Statins and cancer: A systematic review and meta-analysis. Eur J Cancer. 2008;44:2122-2132
67. Mori K, Shibanuma M, Nose K. Invasive potential induced under long-term oxidative stress in mammary epithelial cells. Cancer Res. 2004;64:7464-7472
68. Svensk AM, Soini Y, Paakko P, Hirvikoski P, Kinnula VL. Differential expression of superoxide dismutases in lung cancer. American journal of clinical pathology. 2004;122:395-404
69. Yoo DG, Song YJ, Cho EJ, Lee SK, Park JB. et al. Alteration of APE1/ref-1 expression in non-small cell lung cancer: The implications of impaired extracellular superoxide dismutase and catalase antioxidant systems. Lung cancer. 2008;60:277-284
70. Trachootham D, Alexandre J, Huang P. Targeting cancer cells by ROS-mediated mechanisms: a radical therapeutic approach? Nature Reviews Drug Discovery. 2009;8:579-591
71. Ray S, Watkins DN, Misso NLA, Thompson PJ. Oxidant stress induces gamma-glutamylcysteine synthetase and glutathione synthesis in human bronchial epithelial NCI-H292 cells. Clinical & Experimental Allergy. 2002;32:571-577
72. Gogvadze V, Zhivotovsky B, Orrenius S. The Warburg effect and mitochondrial stability in cancer cells. Molecular aspects of medicine. 2009;31:60-74
73. Wu M, Neilson A, Swift AL, Moran R, Tamagnine J. et al. Multiparameter metabolic analysis reveals a close link between attenuated mitochondrial bioenergetic function and enhanced glycolysis dependency in human tumor cells. American Journal of Physiology- Cell Physiology. 2007;292:C125
74. Gillies RJ, Gatenby RA. Adaptive landscapes and emergent phenotypes: why do cancers have high glycolysis? Journal of Bioenergetics and Biomembranes. 2007;39:251-257
75. Koukoulis GK, Warren WH, Virtanen I, Gould VE. Immunolocalization of integrins in the normal lung and in pulmonary carcinomas. Human pathology. 1997;28:1018-1025
76. Arenberg D. Bronchioloalveolar Lung Cancer*. Chest. 2007;132:306S
77. Saito YD, Jensen AR, Salgia R, Posadas EM. Fyn: a novel molecular target in cancer. Cancer. 2010;116:1629-1637
78. Germain CS, Niknejad N, Ma L, Garbuio K, Hai T. et al. Cisplatin Induces Cytotoxicity through the Mitogen-Activated Protein Kinase Pathways and Activating Transcription Factor 3. Neoplasia. 2010;12:527-538
79. Simons AL, Ahmad IM, Mattson DM, Dornfeld KJ, Spitz DR. 2-Deoxy-D-glucose combined with cisplatin enhances cytotoxicity via metabolic oxidative stress in human head and neck cancer cells. Cancer research. 2007;67:3364
80. Maschek G, Savaraj N, Priebe W, Braunschweiger P, Hamilton K. et al. 2-deoxy-D-glucose increases the efficacy of adriamycin and paclitaxel in human osteosarcoma and non-small cell lung cancers in vivo. Cancer research. 2004;64:31
81. Tuttle SW, Varnes ME, Mitchell JB, Biaglow JE. Sensitivity to chemical oxidants and radiation in CHO cell lines deficient in oxidative pentose cycle activity. International Journal of Radiation Oncology* Biology* Physics. 1992;22:671-675
82. Averillbates DA, Przybytkowski E. The role of glucose in cellular defenses against cytotoxicity of hydrogen peroxide in Chinese hamster ovary cells. Archives of biochemistry and biophysics. 1994;312:52-58
Author contact
![]() Corresponding author: Yao Li, Tel.: +86 21 65642047; Fax: + 86 21 65642502; E-mail: yaoliedu.cn; Yan Huang, Tel.: +86 21 65642047; Fax: + 86 21 65642502; E-mail: huangyanedu.cn
Corresponding author: Yao Li, Tel.: +86 21 65642047; Fax: + 86 21 65642502; E-mail: yaoliedu.cn; Yan Huang, Tel.: +86 21 65642047; Fax: + 86 21 65642502; E-mail: huangyanedu.cn