Impact Factor ISSN: 1449-2288
- Issue 9; 2026
- Issue 8; 2026
- Issue 7; 2026
- Issue 6; 2026
- Issue 5; 2026
- Volume 22; 2026
- Past Issues
- Advance Articles
- Editorial Board
- Cover Images
- Index & Coverage
- Cover Suggestion
- Special Issues
Introduction
Materials and Methods
Results
Discussion
Supplementary Material
Abbreviations
Acknowledgements
References

 Global reach, higher impact
Int J Biol Sci 2016; 12(4):427-445. doi:10.7150/ijbs.12777 This issue Cite
Research Paper
MiRNA Transcriptome Profiling of Spheroid-Enriched Cells with Cancer Stem Cell Properties in Human Breast MCF-7 Cell Line
Lily Boo1, Wan Yong Ho2, Norlaily Mohd Ali1, Swee Keong Yeap3, Huynh Ky4, Kok Gan Chan5, Wai Fong Yin5, Dilan Amila Satharasinghe3,6, Woan Charn Liew3, Sheau Wei Tan3, Han Kiat Ong1 ![]() , Soon Keng Cheong1,7
, Soon Keng Cheong1,7
1. Faculty of Medicine and Health Sciences, Universiti Tunku Abdul Rahman, 43000 Cheras, Malaysia;
2. Faculty of Medicine and Health Sciences, University of Nottingham (Malaysia Campus), 43500 Semenyih, Malaysia;
3. Institute of Bioscience, Universiti Putra Malaysia, 43400 Serdang, Malaysia.
4. Department of Agriculture Genetics and Breeding, College of Agriculture and Applied Biology, Cantho University, 84071, Vietnam.
5. Division of Genetics and Molecular Biology, Institute of Biological Sciences, Faculty of Science, University of Malaya, Kuala Lumpur, Malaysia.
6. Faculty of Veterinary Medicine and Animal Science, University of Peradeniya, 20400, Sri Lanka.
7. Cryocord Sdn Bhd, Persiaran Cyberpoint Selatan, 63000 Cyberjaya, Malaysia.
Received 2015-5-24; Accepted 2015-12-13; Published 2016-2-12
Abstract

Breast cancer is the second leading cause of cancer-related mortality worldwide as most patients often suffer cancer relapse. The reason is often attributed to the presence of cancer stem cells (CSCs). Recent studies revealed that dysregulation of microRNA (miRNA) are closely linked to breast cancer recurrence and metastasis. However, no specific study has comprehensively characterised the CSC characteristic and miRNA transcriptome in spheroid-enriched breast cells. This study described the generation of spheroid MCF-7 cell in serum-free condition and the comprehensive characterisation for their CSC properties. Subsequently, miRNA expression differences between the spheroid-enriched CSC cells and their parental cells were evaluated using next generation sequencing (NGS). Our results showed that the MCF-7 spheroid cells were enriched with CSCs properties, indicated by the ability to self-renew, increased expression of CSCs markers, and increased resistance to chemotherapeutic drugs. Additionally, spheroid-enriched CSCs possessed greater cell proliferation, migration, invasion, and wound healing ability. A total of 134 significantly (p<0.05) differentially expressed miRNAs were identified between spheroids and parental cells using miRNA-NGS. MiRNA-NGS analysis revealed 25 up-regulated and 109 down-regulated miRNAs which includes some miRNAs previously reported in the regulation of breast CSCs. A number of miRNAs (miR-4492, miR-4532, miR-381, miR-4508, miR-4448, miR-1296, and miR-365a) which have not been previously reported in breast cancer were found to show potential association with breast cancer chemoresistance and self-renewal capability. The gene ontology (GO) analysis showed that the predicted genes were enriched in the regulation of metabolic processes, gene expression, DNA binding, and hormone receptor binding. The corresponding pathway analyses inferred from the GO results were closely related to the function of signalling pathway, self-renewability, chemoresistance, tumorigenesis, cytoskeletal proteins, and metastasis in breast cancer. Based on these results, we proposed that certain miRNAs identified in this study could be used as new potential biomarkers for breast cancer stem cell diagnosis and targeted therapy.
Keywords: breast cancer, cancer stem cells, MCF-7, miRNA transcriptome, next generation sequencing, spheroid culture.
Introduction
Breast cancer is the second most frequently diagnosed malignancy among all types of cancer in women with 1.38 million (10.9%) diagnosed worldwide [1]. About 1 in 8 women will develop invasive breast cancer over the course of her lifetime in the United States [2]. Standard treatments have only yielded modest success as most patients often suffer relapsed with hormonal-resistant breast cancer, which can eventually develop into metastatic disease [3]. Emerging evidences have demonstrated that a small subpopulation of cells known as cancer stem cells (CSCs) may exist within a tumour and are the main culprit that drives tumorigenesis [4-6]. These small subpopulations of cells have been proven to have self-renewal capacity and often referred as tumorigenic, as they have the ability to induce tumours in immunodeficient mice [7, 8].
A new class of non-coding RNAs molecules known as microRNAs (miRNA) have emerged recently and they are responsible for a wide range of gene regulations at the translational level, either by translational inhibition or degradation of mRNA targets [9, 10]. These miRNAs, being 19-25 nucleotides in length, have crucial functions in cellular processes for normal development. Aberrations of miRNAs have been reported to be involved in various human diseases, including malignancy [9, 11]. Several studies have identified miRNAs that modulate key components in CSCs [12-15]. Recently, next generation sequencing (NGS) technologies, with improvement in scale and sensitivity, have been developed to provide a highly quantitative estimate of the known miRNA species [16-19]. This technology is expected to accelerate cancer research as it has potential for discovering novel miRNAs and subsequently may lead to the discovery of new cancer biomarkers. Although there are already some miRNAs that have been reported to be aberrantly expressed in breast cancer [20, 21], specific miRNAs involved in spheroid- enriched CSCs model have yet to be fully elucidated [22].
The spheroid culture is a way to culture cancer cells in a three-dimensional (3D) spatial conformation in vitro. These 3D models have been well established in breast cancer research due to the highly resemblance of these models to the in vivo solid tumours [23-25]. The CSCs hypothesis suggests that clonal expansion is the way to expand CSCs in vitro as the cells are more likely to be a single clone of cells [26]. However, this view has been challenged as the clone of cells could be a result of cell aggregation due to the spontaneous locomotion of free-floating single cells [27] and also the movement of plates during daily cell culture maintenance that possibly lead to cell aggregation [28]. As such, it is generally accepted that clonal and aggregates of cells might coexist and resulted in a heterogeneous spheroid [29]. Therefore, several studies characterized CSCs across the different types of cancers including breast, prostate, colon and melanoma have relied on cell aggregation method [30-33]. The models were not just biologically spherical in shape, but shared many features with that of solid tumors, and were not observed in traditional 2D monolayer cultures [34-37]. Substantial evidences have demonstrated that the drug sensitivity behaviour of cancer cells in 3D spheroid is more accurate than cancer cells in monolayer setting in anti-tumour drug testing [38, 39]. Interestingly, many recent reports have demonstrated that CSCs are particularly enriched and maintained in 3D spheroid culture [31, 40-42]. These studies have suggested that CSCs can be enriched in serum-free culture environment supplemented with the necessary growth factors as only CSCs were able to survive and proliferate in that condition [43, 44]. Therefore, spheroid-enriched CSCs models have been proposed to be the next tool for analytical endpoints studies specifically in the assessment of tumour for therapeutic testing targeting CSC populations [45]. Nevertheless, the enriched CSC models have not been properly characterised despite their extensive use as the determining point to assess the efficacy of the cancer drugs [35, 40, 46, 47]. Till date, characterisations on the spheroids-enriched CSCs have been primarily focused on the ability of the spheroid formation, secondary spheroid capacity, expression of CSC markers, and ALDH1 assays [41, 48-51]. A comprehensive characterisation in addition to the abovementioned techniques is of paramount importance to further evaluate the phenotypic characteristics of the spheroid-enriched CSCs models. Furthermore, the roles of miRNAs in the regulation of mRNA specifically targeting the self-renewal capacity and the drug resistance of the spheroid-enriched CSCs models remain largely unknown.
Therefore, to address this issue, spheroids were developed from MCF-7 breast cancer cell line and their CSCs properties were comprehensively characterised. MCF-7 cells were chosen as the cell model in the present study given that the cell line is one of the most commonly used breast cancer cell line in breast cancer research [52]. Next generation sequencing (NGS) was employed to generate and compare the miRNA profiles of spheroid-enriched CSCs against parental cells. The biological functions of the differentially expressed miRNAs were then inferred via bioinformatics tools to further highlight the potential role of certain miRNAs associated with spheroid-enriched CSCs models.
Materials and Methods
Cell line and monolayer culture
Estrogen-dependent human breast adenocarcinoma cell line MCF-7 was obtained from ATCC (Catalog number: HTB-22). The cells were grown and maintained as a monolayer in tissue culture flasks using Roswell Park Memorial Institute (RPMI-1640) medium (Sigma, USA) supplemented with 10% heat-inactivated foetal bovine serum (FBS) (GIBCO, USA), 100 I.U./ml penicillin and 100 ng/mL streptomycin (GIBCO, USA), 2 mM L-Glutamine (Biowest, France) at 37°C under a 5% humidified CO2 atmosphere. All experiments were performed on cultures that were 70% confluent.
Generation of spheroid cultures from MCF-7
The spheroids were generated using an agar overlay technique by seeding the cells in a non-adherent 96-well agar plate to prevent cell attachment [53]. The monolayer cells were harvested and dissociated into single cell suspension at a cell density of 5 x 10⁴ cells in serum-free medium consisted of DMEM/F12 medium supplemented with 20 ng/mL epidermal growth factor (MPBio, USA), 20 ng/mL basic fibroblast growth factor (GIBCO, USA), 0.4% bovine serum albumin (Sigma, USA), 2% B27 (GIBCO, USA), 10 µg/mL insulin (MPBio, USA), 0.5 µg/mL hydrocortisone (Nacalai, Japan), and 2 mM L-Glutamine (Biowest, France). Cell aggregation was carried out by centrifuging the plate at 2000 rpm for 5 minutes. Then, the plates were incubated at 37°C under a 5% humidified CO2 atmosphere for four days.
Scanning electron microscope imaging of spheroids and monolayer
For the analysis of the ultrastructure of the spheroids and monolayer, scanning electron microscope (SEM) was performed. For the monolayer cultures, the cells were seeded onto a glass coverslips and grown up to 70% confluent whereas for spheroid cultures, the cells were harvested from the 96-well agar-coated plates. Both samples were then washed with 1X PBS, before fixed in 2.5% (v/v) glutaraldehyde in 0.1M cocodylate buffer and kept in 4°C. Then, the samples were then post-fixed with 2% osmium tetroxide for 2 hours at 4°C, dehydrated through a graded ethanol series (35%, 50%, 70%, 80%, 85% and 95%) for 15 minutes each and twice at 100%. This dehydration process was then followed by immersing in pure acetone for 15 minutes each. Each step of dehydration was accompanied by a short centrifugation at 3000 rpm for 5 minutes to minimise the loss of samples during transferring. After further drying in fume hood for 15 minutes, the specimens were then carefully mounted onto an aluminium stub using double stick carbon tape. Specimens were then critically point dried (LEICA EM CPD030, Germany) and sputtered gold coated (BAL-TEC SCD005, Germany) before examined under SEM (JSM-6400; JEOL, Japan).
Culture and passage of spheroids into secondary spheroids
The resulted spheroids formed multilayer cells that were densely packed at the centre. The spheroids were collected and pooled by gentle centrifugation, and then were enzymatically dissociated with Accutase (GIBCO, USA). Single cells were then seeded at 200 cells per well in 96-well culture dishes in 100 µL of serum-free growth medium, and 50 µL of medium per well was added every three days. The number of spheres for each well was evaluated 14 days after seeding and sphere formation rate was counted. Sphere-forming efficiency (SFE) was expressed in percentage as the number of spheres formed divided by the cells seeding density per well from first through the third generation. To further test on the in vitro self-renewal capability of the secondary spheroids formed, a single cell limiting dilution assay was performed with one cell per well placed to a 96-well ultra-low attachment plate (Corning, USA). The wells with one cell were observed and images of the propagation of the single cell forming a sphere were captured using a phase contrast microscope (Nikon, Japan). All experiments were performed in triplicates.
Surface marker and ALDH activity analysis by flow cytometry
To determine the CSCs subpopulations in spheroids and parental, the expression of the surface markers CD44+/CD24- using anti-CD44-FITC (Miltenyl Biotech, UK), and anti-CD24-phycoerythrin (PE) (Miltenyl Biotech, UK) were measured. One million cells were harvested using Accutase, gently disaggregated to a single cell suspension by pipetting up and down, passed through a 70 µm filter, and stained according to the manufacturer's protocol. Briefly, the cells were stained with the antibodies for 15 minutes at 4°C at 1:11 dilution, and washed with ice-cold PBS. Aldehyde (ALDH) activity was analysed using the Aldeflour kit (Stem Cell Technologies, Canada) according to their manufacturer's protocol. Briefly, the disaggregated single cells were suspended with activated Aldeflour reagent, one tube without diethylaminobenzaldehyde (DEAB) specific inhibitor and another one with the inhibitor to act as a control , both incubated at 37 °C for 45 minutes. Following incubation, the tubes were centrifuges to remove the supernatant and later resuspended in 0.5 mL Aldeflour buffer on ice. For data acquisition, for surface markers and ALDH activity, flow cytometry was performed with a FACS Calibur Flow Cytometer (BD Biosciences, USA) and figures were analysed using Cell Quest Pro software.
Morphology assessment and cell count
All the cell observation was recorded and captured using a phase-contrast microscope (Nikon, Japan) over the period of culture to assess the spheroid formation. When the spheroids reached day four, the spheroids was picked, dissociated and cell count was performed. Morphological changes of cells subjected to the drug sensitivity assays were also qualitatively investigated using microscopic observation.
Immunofluorescence staining for cancer stem cells markers
Spheroids were collected by centrifugation in a microcentrifuge tube prior to fixation. Parental cells which grew as monolayers were directly fixed onto the glass slides prior to fixation. The samples were fixed in 4% cold paraformaladehyde and blocked with 0.2% bovine serum albumin in phosphate buffered saline (PBS) for one hour. The primary mouse monoclonal antibodies anti-human conjugated to fluorescent dyes, including CD24-PE, CD44-FITC, CD49f -FITC, CD326-FITC, Sox 2-PE, Nanog-AF, ALDH1-FITC were added and incubated overnight at 4°C. After washing 3 times with PBS, the specimens were then counterstained with DAPI (GIBCO, USA) and the images were captured using a fluorescent microscope (Carl Zeiss, USA). All the antibodies were purchased from Miltenyl Biotech, UK.
Drug sensitivity assays
The sensitivity of parental and spheroids to chemotherapeutic drugs was measured by MTT (3-(4, 5-dimethyl-2-thiazolyl)-2, 5-diphenyl-2H- tetrazolium bromide) assay (Sigma-Aldrich, USA). Briefly, the parental and spheroids were seeded in 96-well microplates on the same growth medium. Cytotoxicity testing on spheroids (3D format) were carried out based on published method [53] while following standard methods for dissociated spheroids (2D format) and monolayer cells [54]. Briefly, for spheroids in 3D format, the spheroids were transferred to a new 96-well plate and centrifuged at 2000 rpm for 5 minutes. For the spheroids in 2D format and also the monolayer cells, the cells were dissociated into single cells, filtered, cell count and seeded at 5 x10³ cells/well in a 96-well plate. Different concentrations of tamoxifen, cisplatin and doxorubicin (ranging from 0 µg/mL to 30 µg/mL for monolayer and spheroids (2D format) and ranging from 0 µg/mL to 100 µg/mL for spheroids (3D format) and diluents alone (the controls) were added to the cell cultures in a total volume of 200 µL/well. After 96 hours of incubation, the assay was performed by adding 20 µL of MTT solution (5 mg/mL in PBS) to each well, incubating 4 hours, adding 170 µL of DMSO to dissolve the formazan crystals, and reading the absorbance of each well at 570 nm in a microplate reader. The morphology of the treated cells in the different conditions was captured IC50 drug concentrations at 96 hours post-treatment using bright field microscope. Untreated cells were cultured in parallel in the experiment. The cytotoxicity was determined by comparing the resulting absorbance with the mean absorbance of the control wells (considered as 100% viability), and was expressed as percentage of cell viability. The drug concentrations that caused inhibition of 50% cell viability (IC50) were determined from the dose response curves. Experiments were carried out in triplicates.
Cell proliferation assay
Parental cells at 80% confluence and spheroids at day 4 were picked and dissociated into single cells using Accutase (GIBCO, USA). The dissociated single cells were then cultured at 200 cells/well in 24-well ultra-low attachment plates in serum-free media. Half of the medium was changed every three days and cell growth was detected by alamarBlue Cell Viability Assay Reagent (Thermo Scientific, USA) at specific time intervals over the time course of three weeks. The proliferation assays were performed in triplicates. The cell proliferation rates for the dissociated cells originated from parental and spheroids, were then calculated based on the percentage reduction of alamarBlue reagent using absorbance readings [55].
Wound healing assay
Parental and spheroids were grown to confluence in a 6-well plate. A line was drawn with a marker pen on the bottom of the plate. Wounds were initiated using a sterile 200 µL pipet tip through the cells moving perpendicular to the line drawn in the step before. The cells were carefully and gently rinsed with PBS as not to lift off the sheets of cells. Images of the wounded are were captured using an inverted microscope (Nikon, Japan) just above and just below each line at 6, 12 and 24 hours post-wound initiation. The areas of the wounds at different time points were analysed using Image J software [56] to calculate the cell migration rate.
Tumour cell invasion and transmembrane migration assay
Parental and spheroids were grown to 80% confluence. The cells were starved in serum-free medium the day before the assay. The next day, the cells were dissociated into single cells with Accutase, counted and added at 1 x 10⁵ cells/well onto the top chambers of transwell inserts of 8-µm pore size filter (BD,USA) coated with basement membrane Matrigel (BD, USA) in a 24-well plate. In the bottom of the chambers, DMEM containing 10% of FBS was added, and the cells were then cultured for 72 hours at 37°C in a 5% humidified CO2 incubator. At the end of the assay, the cells on the top surface of the filter were removed by using a cotton-swab, and the cells on the bottom of the filter were then fixed with methanol and stained with 0.5% crystal violet for 30 minutes. The chambers were then washed in PBS, counted using an inverted microscope with either a 4X or a 10X objective lens and plotted as the percentage of invading of the total number of plated cells. The cell counting was performed using Image J software. For quantifying the invasive ability of the cells per filter as an absorbance, the dye was then extracted using 30% acetic acid and the concentration was measured at 590 nm. The percentage of invaded cells was measured using absorbance of the sample/absorbance of the control and expressed as percentage. The experiments were performed in triplicates. In the cell transmembrane migration assay, all the steps were carried out similarly to those in the invasion assay except for the Matrigel coating. The percentages of invaded or migrated cells were determined by dividing the OD Sample with OD Control and multiply by 100%.
RNA isolation
Total RNAs with retention of small RNAs were extracted from the parental (as control groups) and spheroids (as experimental groups) using Exiqon miRCURY RNA Isolation Kit (Exiqon, Denmark) in line with the manufacturer's instructions. A total of six samples (three for parental and three for spheroids) were used. RNA was treated with DNase I (Qiagen, USA) to eliminate genomic DNA contamination. The concentration and purity of extracted RNA was determined by OD measurements of aliquots at a wavelength of 260/280 nm and further checked using Qubit RNA Assay Kit (GIBCO, USA). The integrity of the RNA samples was determined by Agilent 2100 Bioanalyzer using RNA 6000 Pico Kit (Agilent Technologies, USA). Only RNA samples with sufficient concentration (600 ng/µL) and RNA Integrity Number (RIN)>8 were used for libraries preparation for next generation sequencing library preparation and quantitative real time PCR (qRT-PCR) validation.
Small RNA library preparation and next generation sequencing
The small RNA libraries were prepared using TruSeq Small RNA Sample Preparation Kit (Illumina, USA) with multiplexing capability. Following the TruSeq Kit user guide, the total RNA, containing the small RNA fractions, were ligated to 5' and 3' adaptors sequentially before converted to cDNA by reverse transcription followed by PCR amplification with unique index sequences primers. The quality of cDNA were assessed using a high sensitivity DNA chip (Agilent Technologies, USA). Index sequences consist of six-base indices to distinguish different samples from one another in a single lane of a flow cell were employed to make use of the Illumina multiplexing capability. Finally, the samples were pooled and subjected to 6% (w/v) non-denaturing PAGE (polyacrylamide gel electrophoresis) run. Then, cDNA fragments between 145 and 160 bp corresponding the miRNA libraries fractions were excised from the gel, purified and eluted. The final cDNA pellet was air dried and resuspended in 10 µL nuclease-free water and the quantity of the cDNA libraries measured using Qubit fluorometer. All the final libraries were then pooled at final concentration of 2 nM and sequenced in two flow cells in the Illumina's platform HiSeq Run. Prior to run, the small RNA libraries were again validated using another DNA chip. The sequencing reads has been deposited at the National Center for Biotechnology Information Gene Expression omnibus (GEO) with accession number GSE68246.
Small RNA bioinformatics analysis
After trimming off the 5' and 3' adaptor sequences, filtering low quality reads, and cleaning up the contaminated reads, the occurrence of each unique read was counted as tags. The sequences shorter than the cut-off read length 17 and more than 27 nucleotides were removed, as determined by the read length distribution plot. The trimmed sequences were mapped to database and further grouped as known mature miRNA. The completely matched reads were annotated according to their position in the stem-loop structure. These unique tags were mapped to the sequence data in miRBase 15 microRNA Sequence Database and Ensembl Homo_sapiens. GRCh37.57.ncrn using the Illumina 1.8 and later pipeline. Data trimming and initial analysis were carried out using CLC Genomics Workbench 7.0.
Prediction of miRNA targets and functional analysis of target genes
Predicted targets of miRNAs differentially expressed in this study were determined using miRDB, TargetScan and miRanda. The predicted genes were then uploaded to the online Database for Annotation, Visualization, and Integrated Discovery (DAVID) program (http://david.abcc.ncifcrf.gov/tools.jsp) [57, 58]. Functional categories were clustered using the functional annotation clustering tool and representative gene ontology (GO) on specific categories were identified. After GO analysis, KEGG was used to construct a pathway enrichment of predicted miRNA target genes of at least p-value < 0.05.
MicroRNAs validation by real-time PCR
MicroRNAs were validated by performing SYBR green qRT-PCR assay using miRCURY LNA Universal RT microRNA PCR System (Exiqon, Denmark). The ready-to-use Pick-&-Mix microRNA PCR panel consist of 96-well plates consisting of custom selections of microRNA LNA PCR primer sets were used for this purpose. In brief, the total RNA of 100 ng containing the miRNAs was polyadenylated by poly (A) polymerase and reverse transcribed to cDNA using the Universal RT-One first strand cDNA synthesis reaction provided in the kit according to the manufacturer's instructions. Real-time qPCR was performed using LNA PCR amplification master mix with the manufacturer-provided miRNA-specific primers optimized with LNA. Each reaction was performed in a final volume of 10 µL containing 1:1 ratio of diluted cDNA and 2X PCR master mix. The amplification profile was denaturation at 95°C for 10 minutes, followed by 40 cycles of 95°C, 10 seconds, and 60°C, 1 minute. All reactions were run in triplicates. The qRT-PCR reaction was performed using CFX96 Touch Real-Time PCR Detection System (Bio-Rad Laboratories, USA) according to the manufacturer's protocol. After reaction, the threshold cycle (Ct) was determined by using the default threshold settings. The Ct values were defined as the fractional cycle number at which the fluorescence passed a fixed threshold. The expression levels of putative miRNAs were normalized against internal reference miRNAs based on geNorm algorithms.
Statistical Analysis
Data represent the mean ± standard deviation over 95% confidence intervals of at least three independent experiments. Statistical analysis was performed using independent sample one-way analysis of variance (ANOVA) and student independent t-test via SPSS V17 software. The results were considered to be statistically significant at a probability level of p-value <0.05.
Results
Formation of homogeneous three-dimensional cancer stem-cell like MCF-7 with self-renewing capability
When observed under bright field and scanning electron microscopes, the parental MCF-7 cells grew as adherent epithelial-like monolayer cells of polygonal shape with clear and sharp boundaries between them (Figure 1A & B). Under serum-free condition, the MCF-7 cells grew into 3D non-adherent spheroids within 24-48 hours as compared to their parental counterparts. The microplate wells coated with agar promoted the formation of single centrally located spheroids of reproducible size. The spheroids were mostly homogeneous in size after 96 hours in culture and can be easily transferred using regular pipettes without disaggregating it (Figure 1C & D).
The morphology of MCF-7 monolayer and spheroid culture. (A, B) Appearance of MCF-7 monolayer under two-dimensional (2D) condition in tissue culture flask under bright field (magnification: 4X, scale bar: 100 µm) and scanning electron microscopy (magnification: 500X, scale bar: 10 µm) respectively. The cells appeared to be adherent and epithelial in shape. (C, D) Centrifugal force facilitated the cells to organize into a three-dimensional (3D) multicellular spheroidal structure in serum-free media. The structure became more rigid and compact 96 hours post-culture, where individual cells were indistinguishable (magnification: 4X, scale bar: 100 µm). (E) Appearance of the spheroidal structure under the scanning electron microscopy (magnification: 330X, scale bar: 100 µm). The cells appeared to be clumping to each other revealed that they were strongly adhered with one another to preserve the spheroid architecture. (F) Cells within the spheroid were connected to each other through cell-cell junction (arrows), responsible for maintaining the tight cell-cell contact. Present of micropores (arrowheads) on the interior of the spheroid, allowed the diffusion of nutrients and oxygen to the inner layer of the spheroid (magnification: 2000X, scale bar: 10 µm).
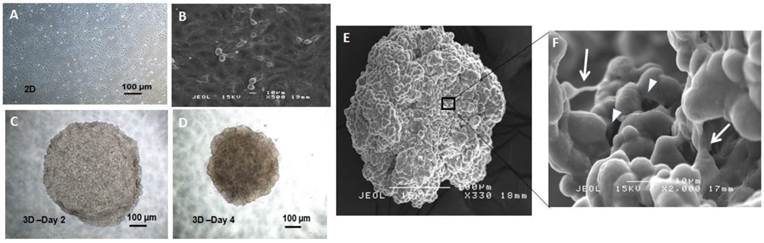
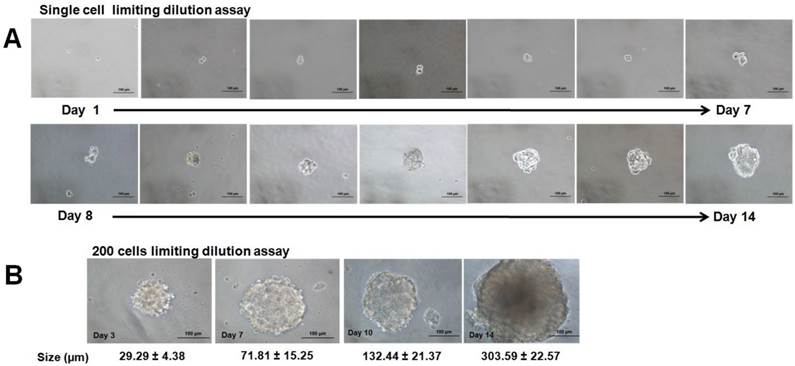
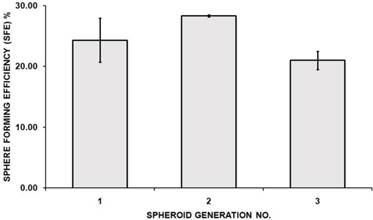
All the spheroids reached 1500 to 1900 µm in diameter on day 4 and cell numbers were estimated to be 4.80 ± 0.25 x10⁴ cells compared to their initial seeding number of 5.00 x 10⁴ cells. Scanning electron microscope (SEM) images at 330X magnification (Figure 1E) revealed aggregation of thousands of cells that were compacted together to give rise to the spheroidal structure. Higher magnification at 2000X (Figure 1F) further revealed that the cells in the spheroid were held together by the cell-cell junctions throughout the whole structure. To assess its self-renewing capacity, the initially formed spheroids were harvested and dissociated into single cells and were grown in serum free medium at a lower density of 200 cells/well and at single cell dilution assay as described in the methods section. In this condition, cells were grown as non-adherent, three-dimensional clusters that increased in size from day 1 to day 14 (Figure 2A & B). The secondary spheres were subsequently cultured up to three passages and the sphere-forming efficiency (Figure 3) remained relatively constant. The capacity to be serially passaged provided a definitive evidence for the presence of extended self-renewal, and the possibility of the spheroids enriched with CSCs.
Secondary spheroids formation from human estrogen dependent breast cancer cell line MCF-7 at single cell and 200 cells/well dilution assays. (A) Microscopic images of the formation of the secondary spheroids demonstrated the propagation of the spheroid from a single cell from day 1 to day 14 (magnification: 20X, scale bar: 100 µm). (B) Progressive increase in size at day 3, day 7, day 10, and day 14 when the cells were seeded at higher cell seeding density at 200 cells per well (magnification: 20X, scale bar: 100 µm). Increment in size was recorded from three sets of experiments.
Spheroid-forming efficiency (SFE) of spheroids serially passaged from first to third generation. Bar graph represents the SFE mean calculated by counting the number of spheres formed in a given well and dividing by the total number of seeded cells in the well, represented as a percentage. Error bars represents standard deviation (SD) (n=3).
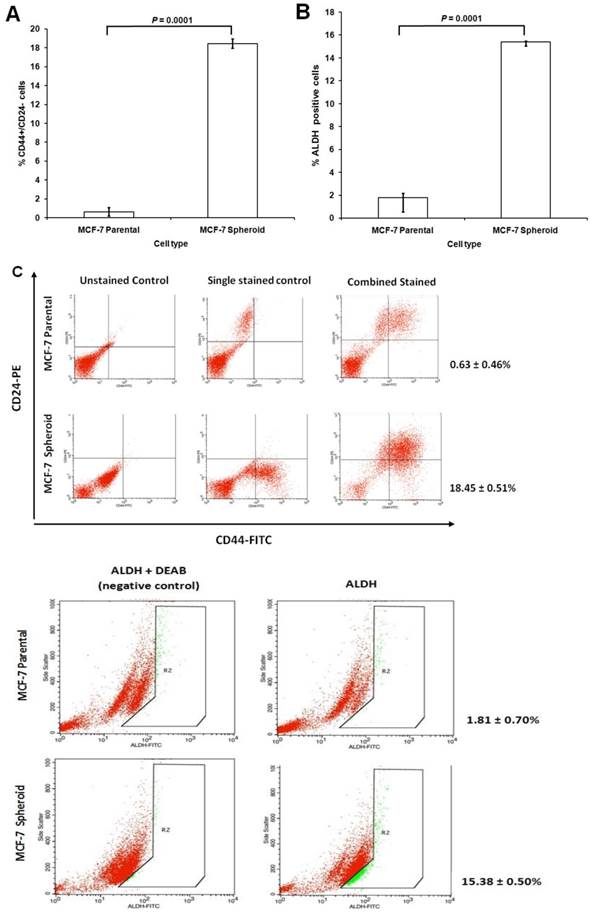
Enrichment of CD44+/CD24-and ALDH+in spheroid MCF-7
CD44 is a cell surface glycoprotein involved in cell to cell interactions, cell adhesion, and migration and has been reported as a cell surface marker for some breast and prostate CSCs [59]. Likewise, CD24, a cell adhesion molecule, associated with tumour development, played a role in various cancer metastases. CD24 expression is related to differentiated epithelial features [60]. It was also recently showed that breast CSC has increased aldehyde dehydrogenase activity (ALDH) [61]. Therefore, the cultured MCF-7 cells grown as spheroids were determined for their CSCs enrichment based on the expression of these stem-cell related markers for breast CSCs. Comparison between CD44, CD24 and ALDH subpopulations in spheroids with their parental cells was quantified using flow cytometer. The proportion of cells in spheroids stained positive for CD44 and negative for CD24 were 18.45 ± 0.51%, which was significantly higher than its parental counterparts which were 0.63 ± 0.46% (mean ± SD; n =3) (Figure 4A). ALDH-positive cells were 15.38 ± 0.50% (mean ± SD; n =3) for spheroids cells which were significantly higher compared to its parental cells which were 1.81 ± 0.70% (mean ± SD; n =3) (Figure 4B). The representative dot plots of the experiments were shown in Figure 4C. These results suggested that spheroids were enriched with CD44+/CD24- and ALDH-positive cells under serum-free culture condition, expressing common key characteristic of CSCs.
Immunophenotyping and ALDH1 staining analysis of spheroids compared to their parental cells. (A) The percentage of CD44+/CD24- cells of MCF-7 parental and spheroid cells was 0.63 ± 0.46% and 18.45 ± 0.51% (P = 0.0001), respectively. (B) The percentage of ALDH-positive cells was 1.81 ± 0.70% and 15.38 ± 0.50% (P = 0.0001) in MCF-7 parental and spheroid cells respectively. The proportion of subpopulation of cells expressing CD44+/CD24- and ALDH-positive cells in MCF-7 spheroid cells were significantly higher relative to the parental cells. (C) A set of representative flow cytometry dot plots of both experiments. Columns mean; bars, SD. R2 are the region of ALDH-positive cells. The data are representative of three independent experiments.
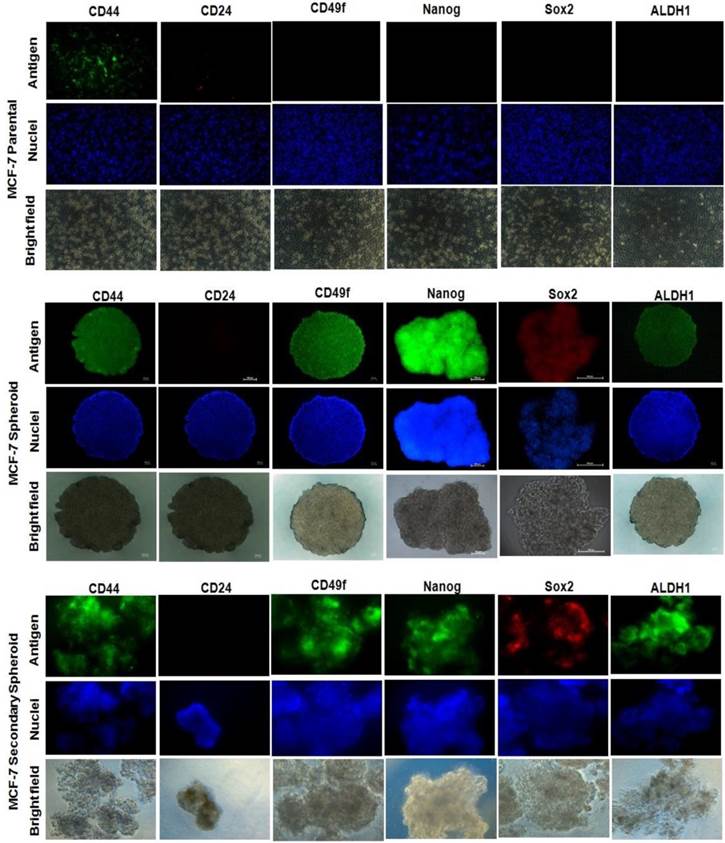
Spheroid MCF-7 expressed cancer stem cells markers
To determine whether the spheroids acquire stem-cell-like characteristics, spheroids were characterized based on the expression of several breast CSCs markers (Figure 5). For the parental cells which acted as the negative controls, the vast majority of cells showed negative staining for all the markers except for CD44. This expression was expected as CD44 is a commonly expressed marker for epithelial lineage cells. However, when refer to the flow cytometric data, the CD44-positive cells were significantly lower in parental cells when compared to the spheroid cells (Figure 4A). In the spheroid cells, positive staining for CD44 and CD49f were observed, and CD44 expressions were concurrent with the flow cytometric results (Figure 4A). Sox-2 and Nanog proteins were positively stained within the cytoplasm and perinuclear of the spheroid. ALDH1, an aldehyde dehydrogenase enzyme has been shown to increase in activity of stem/progenitor cell, was also positively stained, also concurrent with the flow cytometric results (Figure 4B).
Immunofluorescent staining of CSC-related surface and internal markers of CD44, CD24, CD49f, Nanog, Sox2, and ALDH1 on spheroids and the monolayer cells. DAPI was used for nuclear counterstain. Magnifications at 4X and 10X.
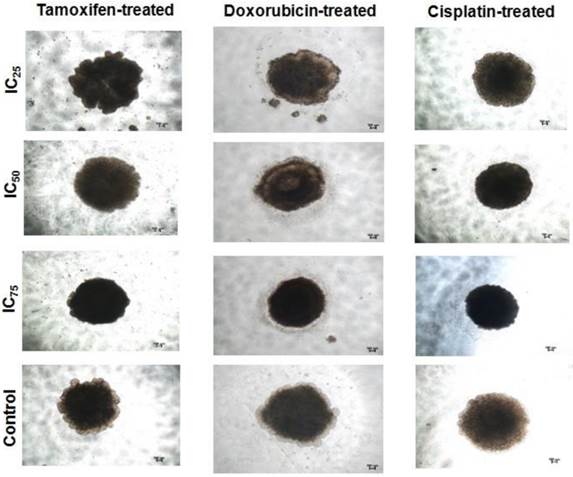
Spheroid integrity following treatment with chemotherapeutic drugs at different inhibitory concentrations. Spheroids possessed higher drug resistance to conventional chemotherapeutics in vitro when compared to parental cells. The parental cells and spheroids were treated with tamoxifen, doxorubicin, and cisplatin for 96 hours and the morphology of the spheroids were shown. Each experiment was performed in triplicates, and only the represented images were shown. Magnification at 4X.
Similarly, secondary spheroids also demonstrated the same fluorescent expressions indicating retention of the stemness characteristics under the limiting dilution assay. The results suggested that spheroid cultures enriched the CSCs properties based on the expression of the stem cells related markers when compared to the parental cells.
Spheroid MCF-7 has higher drug resistance to conventional chemotherapies
It is hypothesized that CSCs in breast are more resistant to conventional chemotherapy, which contributes to cancer relapse [62]. To examine whether self-renewing spheroid cells possess higher chemoresistance ability, the sensitivity of the parental versus the spheroids to different drugs, tamoxifen, doxorubicin, and cisplatin were assessed. For treatment, parental were grown in 96-well plates following established drug treatment protocol for monolayer cultures. For spheroids, the drug treatment were carried out in three-dimensional (3D) format [53] and also dissociated into single cells before replated and treated as in monolayer cultures, known as two-dimensional (2D) format. Overall, the drug sensitivity of the spheroid cultures regardless in 3D or 2D format conditions was statistically higher when compared to the parental cells. The survival rates under 100 µg serially diluted drugs for 3D spheroids were 2.9-fold, 18.8-fold and 5.4-fold whereas for 2D spheroids, the survival rates were 2.3-fold, 13-fold, 5.4-fold for tamoxifen, doxorubicin and cisplatin respectively, when compared to the parental cells (Table 1). Microscopic imaging performed on spheroids at 96 hours post-treatment at IC50 inhibitory drug concentration also showed reduction in volume and size of the 3D spheroids, with doxorubicin-treated spheroids showing the most evident trend. Interestingly, in 2D spheroids cultures, although plated as monolayer cultures, formation of smaller spheroids were seen at IC50 inhibitory drug concentration (Additional File 2: Figure S2). Taken together, these results support the likelihood of enrichment of CSCs in the spheroids cultures that contribute to the higher drug resistance across the three chemotherapeutics drugs as compared to the parental cells.
The IC50 values (µM) of drugs tamoxifen, doxorubicin, and cisplatin in MCF-7 parental and spheroids at 96 hours post-treatment. Cell survival was determined by MTT assay. All data are expressed as means ± SD. *p<0.05 when compared with the parental. The IC50 were obtained from the dose-response curves for parental and spheroids treated with the different drugs respectively.
| IC50(µM) | |||
|---|---|---|---|
| Tamoxifen | Doxorubicin | Cisplatin | |
| MCF-7 Parental | 20.57 ± 2.25 | 1.00 ± 0.37 | 2.54 ± 0.44 |
| MCF-7 Spheroid (3D) | 60.73 ± 7.39* | 18.82 ± 3.05* | 13.61 ± 3.54* |
| MCF-7 Spheroid (2D) | 47.62 ± 6.83* | 13.25 ± 3.69* | 13.68 ± 3.92* |
*P<0.05 compared to the parental group.
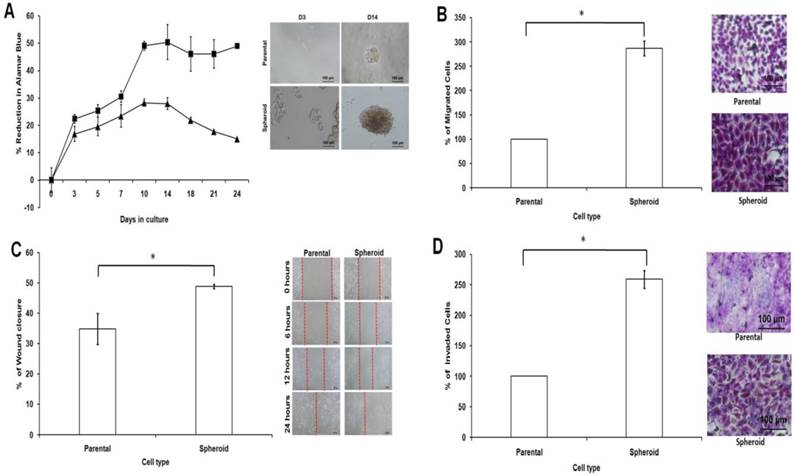
Spheroid MCF-7 has higher proliferation, migration, and invasion potential
Cell proliferation was observed to be higher in dissociated cells from spheroids compared to parental cells (Figure 7A). The varying proliferation rate could be attributed by the intrinsic mechanism of the spheroids since all the culture conditions for both spheroid and parental were the same. Metastasis potential of tumour cells can also be measured by cell motility. Compared with parental cells, the migratory ability of spheroids were higher as there were more cells passing through the trans-well membrane (Figure 7B). This observation that spheroid cells migrated quicker than their parental counterparts was further confirmed by the wound healing assay (Figure 7C). As shown, spheroids migrated faster to close the gap of the scratch than parental cells. To examine their invasion potential of the cells, invasion assay was performed. Compared to the parental, the invasiveness of spheroids were higher as there were more cells invading the matrigel after 24 hours of culture as shown by the microscopic images (Figure 7D). Overall, these data suggested that spheroids, which have higher proliferation, migration and invasion rates may utilize different signalling pathways accounted for the observed differences when compared to that of the parental. To further confirm this, miRNA expression profiling performed in this study may provide additional evidence to explain these differences.
Cell proliferation, cell migration, wound healing, and cell invasion of spheroids cells compared to the parental cells. (A) Spheroids showed a higher cell proliferation rate as compared to their parental cells. Cell proliferation assay was carried out from day 3 to day 24 using alamarBlue assay. (B) Spheroids had a higher migration rate than their parental cells. Cells were seeded at 10,000 cells per insert of a 24-well plate and allowed to migrate toward serum-present medium for 24 hours. Migratory cells on the bottom of the PET membrane were then stained (right) and later dissolved and the percentage of migrated cells were quantified in a microplate reader (left). (C) Spheroids recovered the “gap” created during the scratch assay more efficiently than parental cells. The percentage of wound closure of parental and spheroids (left). Microscopic images of the wound closure at 0h, 6h, 12h, and 24h post-wound initiation (right). (D) Spheroids invaded more into the matrigel than parental cells as shown by microscopy. Quantification of cell invasion showed the mean ± standard deviations of three independent experiments. Invading cells were fixed in formaldehyde and stained with crystal violet. All data were expressed as mean ± standard deviations and *p< 0.05 compared with parental cells. Magnification at 10X.
miRNA Sequencing and Annotation
Illumina's sequencing-based miRNA expression profiling was performed to identify the differential expression patterns of miRNAs from parental and spheroids. Adaptor index sequences “AGTCAA” and “AGTTCC” were assigned to parental and spheroid origin respectively. A total of 33,262,716 and 19,201,865 reads were obtained for parental and spheroids respectively. After trimming the 5' and 3' adaptor sequences, the remaining effective reads were mapped to the sequence data in the miRBase19 microRNA Sequence Database. Overall, 12,008,006 and 4,900,499 reads were obtained from parental and spheroids, respectively. The majority of these reads were 23 nucleotides in size for both parental and spheroids (Additional File 1: Figure S1). Among these reads, 57,426 corresponding to 8,392,519 reads and 48,583 corresponding to 2,843,408 reads were matched to known miRNA sequences in parental and spheroids, respectively. The completely matched reads were annotated, according to their position in the stem-loop structures. The summary for small RNA library in parental and spheroids was shown in Additional File 1: Table S1. MiRNAs that was expressed the most was the miR-10a with a total count of 929,530 and 299,888 reads per parental and spheroid libraries, respectively. The top ten most abundant miRNAs with expression values observed in parental and spheroids were listed in Additional File 1: Table S2. To study the differential expression profile of genome-wide miRNAs between parental and spheroids, Kal's test and fold change (FC) of sequenced miRNAs were performed. There were 134 differentially expressed miRNAs between spheroids and parental cells. Using 2-fold expression difference as a cut-off level, 25 up-regulated and 109 down-regulated miRNAs were identified (Additional File 1: Table S3), indicating that there were marked changes in their miRNAs content between the two cell types. The expression profiles of all the miRNAs found in this study and matched to the existing literatures which have been previously reported in breast cancer, breast CSCs or other types of cancer are summarised in Table 2.
Up- and down- regulated differentially expressed miRNAs in spheroids when compared to the parental cells.
| References | |||||
|---|---|---|---|---|---|
| miRNA | FC | Breast cancer | Cancer stem cells | Other types of cancer | |
| Up-regulated miRNAs (n=25) | miR-4492 | 23 | NA | ||
| miR-410 | 15 | [83] | [118] | ||
| miR-4532 | 15 | NA | |||
| miR-381* | 10 | NA | [88] | ||
| miR-127* | 9 | [84] | [84] | ||
| miR-411* | 8 | [85] | |||
| miR-1246 | 6 | [86] | |||
| miR-409 | 6 | NA | [89, 119] | ||
| miR-493 | 5 | [87] | [120, 121] | ||
| miR-4508 | 5 | NA | [90] | ||
| Down-regulated miRNAs (n=109) | miR-4448* | -60 | NA | [100] | |
| miR-221 | -57 | [91, 95] | |||
| miR-27b | -57 | [122] | |||
| miR-125b-1 | -57 | [92] | |||
| miR-760 | -54 | [93] | [97] | ||
| miR-1296 | -52 | NA | [101] | ||
| miR-301a | -49 | [94] | |||
| miR-365a | -46 | NA | [123, 124] | ||
| miR-30c-1 | -44 | NA | [15] | ||
| let-7f-1 | -44 | NA | [15] | ||
* Expression change in this study that did not match in the previous literatures. (FC, fold change; NA, Not Available).
Predicted target genes for differentially expressed miRNAs
It is well known that miRNAs function by targeting mRNAs. Therefore, in order to better understand the specific biological functions of said miRNAs, target genes of differentially expressed miRNAs were retrieved from three databases. The top five up- and down- regulated miRNAs which were >2-fold differentially expressed and contained broad range of predicted target genes are as listed in Additional File 1: Table S4 and S5.
Gene ontology analysis of the predicted miRNA Target Genes
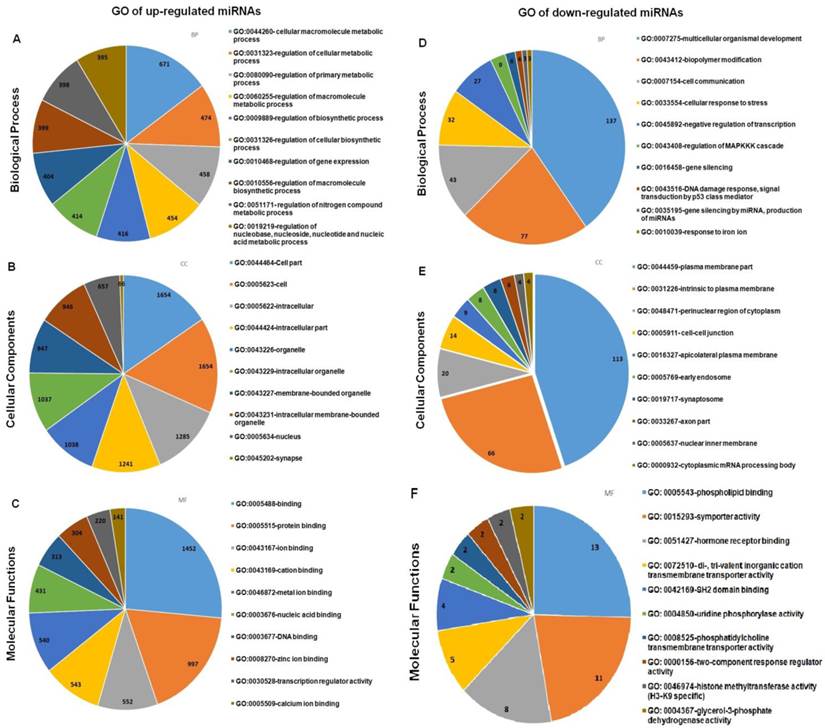
The target genes were mapped to the GO annotation dataset for molecular function, biological processes and cellular components using DAVID. For each GO term, a p-value is calculated that represents the probability that observed numbers of counts could have been resulted from randomly distributing this GO term between the tested group and the reference group. The resulting list of p-value is then sorted. The GO terms which are most specific for the analysed list of genes will have the lowest p-value. GO analysis was performed on the targeted genes of the selected up- and down-regulated miRNAs and the top ten GO in the three categories as listed in Figure 8. The detailed information of the GO analysis is tabulated in Additional File 1: Table S6 and S7. GO analysis showed that the targeted genes of the differentially expressed miRNAs were enriched in the biological processes of regulation metabolic process (GO:0031323, GO: 0080090), gene expression (GO: 0010468), and organism development (GO: 0007175) and cell communication (GO: 0007154); the gene products were primarily found in the cell part (GO:0044464), plasma membranes (GO: 0044459), and in cytoplasm (GO:0048471). The molecular functions of these genes included protein binding (GO: 0005515), ion binding (GO: 00043167), DNA binding (GO: 0003677) and phospholipid binding (GO: 0005543) and hormone receptor binding (GO: 0051427).
Gene Ontology (GO) terms enriched in the up- and down- regulated predicted genes from the differentially expressed miRNAs between spheroids and parental. Only the top ten enriched GO terms are represented in the respective pie charts.
Pathway analysis of predicted miRNA target genes
Based on the inferred KEGG pathways for the miRNAs, one was related to self-renewal (Wnt signaling pathway), four related to drug resistance (pathways in cancer, MAPK signaling pathway, and axon guidance), and one related to structure (Actin cytoskeleton) (Figure 9 and Additional File 1: Table S8). These significantly enhanced pathways shows a strong relationship with the cancer stem cell-like properties enriched in the spheroid cell model namely self-renewability and drug resistance.
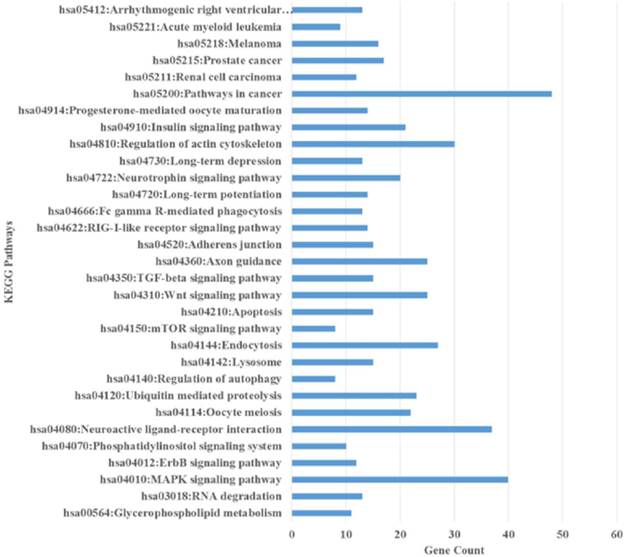
The enriched Kyoto Encyclopedia of Genes and Genomes (KEGG) pathways of the up- and down- regulated predicted genes of the differentially expressed miRNAs using DAVID. All the pathways are represented in the figure and include pathways in cancer, axon guidance, MAPK signalling pathway, endocytosis, Wnt signalling pathway, and regulation of actin cytoskeleton.
Validation of miRNAs commonly found in parental and spheroid MCF-7 cells using quantitative Real Time PCR (qRT-PCR)
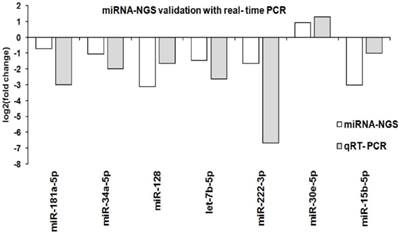
Seven known miRNAs present in both parental and spheroids were chosen for quantification by real time-PCR using the miRCURY LNA Universal RT microRNA PCR System (Exiqon, Denmark). The assessed miRNAs were miR-181a-5p, miR-34a-5p, miR-128-3p, let-7b-5p, miR-222-3p, miR-15b-5p and miR-30e-5p represent a range of biological processes including metastatic, self-renewal, cancer stem cells, and epithelial-to-mesenchymal transition. The selected microRNAs and their targeted sequence were listed in Additional File 1: Table S9. The levels of the seven known miRNAs measured by qRT-PCR were consistent with the sequencing result, indicating the reliability of miRNAs expressions between parental and spheroids (Figure 10).
Validation of known miRNA with qRT-PCR. Comparison of the qRT-PCR and miRNA sequencing log-2 fold change for seven known miRNAs between parental and spheroids. A similar expression trends from both qRT-PCR and miRNA-NGS were observed.
Discussion
The present study described the comparison of the transcriptomic profiles to identify miRNAs specific to the three-dimensional (3D) spheroid-enriched CSCs model. The initial part of the study focused on the establishment and characterisation of the spheroid-enriched CSCs model of MCF-7 breast cancer cell line, highlighting on other characterisation features, which have not been previously reported on spheroid cells. The latter part focused on the comprehensive analysis of the miRNA profiles of the model. In this study, the spheroid-enriched CSCs MCF-7 cultures showed a distinct miRNA expression profiles compared to that of its parental cells grown in monolayer culture conditions. Therefore, the identified miRNA expression profiles is expected to provide a ground work for the future cancer researchers towards the development of potential therapeutic or diagnostics markers for breast cancer particularly in breast-enriched spheroid CSCs studies.
Previous studies in breast cancer have demonstrated that CSCs can be enriched and expanded by culturing cells in an anchorage-independent condition such as spheroid cells [43, 63]. In our study, the combination of concave agar surface and centrifugal force used in the study allowed the cells to form spheroids that were homogenous in size [53]. The serum-free cultured condition was thought to keep the CSCs in their undifferentiated stage facilitating their enrichment, with observable initial cell loss and reduction in size [64, 65]. The ultrastucture of the spheroid was also confirmed by SEM analysis that revealed the strong cell to cell junction within the spheroids that preserve its shape (Figure 1). Characterisation of CSCs from cancer-derived cultures examining CSCs properties are based on their capacity of self-renewal, expression of certain cancer and stem cell markers and chemoresistancy [32, 43, 44, 63]. In this report, MCF-7 spheroids enriched with CSCs populations formed secondary spheroids and were able to be serially cultured at single cell dilution assay and also at 200 cells per well, demonstrated their preservation for self-renewal and extended proliferation properties which are consistent with the previous studies [42, 44]. According to the CSCs criteria, cultured breast CSCs should exhibit a distinctive cell surface phenotype CD44+CD49f+CD24-/low [59, 60]. CD44 and CD49f expressions were enriched in MCF-7 spheroids compared with their parental, concurrent with other CSCs findings [66-68]. In addition, the two pluripotent transcription factors (Sox 2 and Nanog) were also expressed indicating presence of pluripotency-like population of cells. ALDH1 activity based on fluorescent staining and flow cytometry analysis was found enriched in MCF-7 spheroids, suggesting an increase in stem/progenitor cell properties [68, 69]. Chemosensitivity assays showed that the MCF-7 spheroids had a higher drug resistance to the common chemotherapeutic drugs than that of the parental cells (Table 1). It has been reported that the higher degree in chemosensitivity could be due to the increased proportions of CSCs in the spheroids [62]. Alternatively, it could also be explained by the drug barrier created by the three-dimensional (3D) structure of the spheroids that conferred a higher degree of resistance to chemotherapeutics drugs as compared to monolayer cultures [35]. Therefore, we also tested whether the spheroids had higher drug resistance in two-dimensional (2D) culture condition as to rule out the possibility of the physical barrier created by the 3D structure of the spheroids. Interestingly, higher drug resistances were obtained in spheroids cultured in 3D or 2D as compared to the monolayer cultures. Importantly, these results suggest that the increased proportions of CSCs could be the most probable contributor of the higher drug resistance in the spheroids. In addition, there were smaller spheroids colonies growing away from the main spheroid at low drug treatment, IC25, indicating the metastatic ability of the spheroids. Prolonged drug treatment may enhance invasiveness of cancer cells and enrichment of CSC populations [62, 70]. Basically, CD44+/CD49f+/CD24-/ALDH1+/Nanog+/Sox2+markers were expressed and a higher chemoresistance were observed in MCF-7 spheroids compared to the parental, indicating enrichment of breast CSCs through the spheroid cultures. In addition, MCF-7 spheroids were also further characterised for other phenotypic characteristics. Accumulating evidences suggested that most of the cancer progression is associated with CSCs acquiring the epithelial to mesenchymal (EMT) phenotype, which is responsible for increased cell motility and invasion [71, 72]. MCF-7 spheroids had higher proliferative ability, displayed higher cell motility both in migration and wound healing assays and also exhibited higher invasion ability than parental cells. These results are in agreement with previous reports [73-75].
For NGS validation on the differentially expressed miRNAs between MCF-7 spheroids and parental, the chosen miRNAs represented various biological processes involved in breast cancer tumorigenesis. The overall trend of this data confirms that the value obtained from the NGS was reliable. The highest reads were observed in miR-10a, miR-21, and miR-10b of spheroids and miR-10a, miR-21, and miR-27b of parental, respectively. These miRNAs were commonly found in MCF-7 breast cancer cell line responsible for tumour growth, migration, and invasion response to tamoxifen drug, oncogenic properties, and progression [76-79]. Both miR-10a and miR-10b genes were both located in HOX clusters, a family of genes that code for transcription factors responsible in embryo development and also in oncogenesis [80, 81]. miR-10b is known as an oncogene in breast cancer which is responsible for tumorigenesis promoting migration, invasion and metastasis [81] while very little is known about miR-10a in breast cancer. MiR-10a is recognized by its higher expression than that of miR-10b in MCF-7 cancer cell line [82]. This is consistent with our NGS data analysis where we also observed the relatively high expressions of miR-10a (929530 and 299888 reads) compared to miR-10b (478725 and 168371 reads) in parental and spheroid respectively. Among the 134 differentially expressed miRNAs, 25 miRNAs were over expressed in MCF-7 spheroids, whereas the remaining 109 miRNAs were under expressed. Overall, this reflects that the phenotypic behaviour and other distinctive features of spheroid enriched CSCs in MCF-7 are regulated by miRNAs.
Among the top ten miRNAs that were found to be up-regulated, five miRNAs have previously been reported to be involved in breast cancer regulating cell cycle progression (miR-410) [83], cellular senescence (miR-127) [84], as breast cancer biomarkers (miR-411) [85], cell apoptosis (miR-1246) [86], and drug resistance (miR-493) [87]. The present study demonstrates some up-regulated miRNAs (miR-381, miR-409, and miR-4508), which have yet to been linked to breast cancer, but involved in the tumorigenesis of other types of cancer (Table 2). MiR-381, together with miR-495 have been shown in regulating multidrug resistance in leukemia cells by reducing expression of the drug efflux pump, and subsequently increased the drug uptake by the cells [88]. MiR-409 has been shown to promote metastasis in human prostate cancer [89] while miR-4508 has been reported to regulate oncogenic transcription factors in colorectal cancer [90]. The three miRNAs (miR-381, miR- 127 and miR-411), found to be up-regulated in spheroids were down-regulated in other studies [84, 85, 88]. This discrepancy is clear as miRNA profiles are attributed to the different experimental setting such as source of the cell type used in the studies. Our study compared the miRNAs expression of the spheroid-enriched CSCs cells to that of the parental cells while other studies measured the miRNA expression in breast cancer tissues. Therefore, the profiles of spheroid-enriched CSCs cells and non-CSC are not comparable with each other. Interestingly, two miRNAs (miR-4492 and miR-4532), which have not been previously reported in breast cancer had a FC >10. Judging from such high degree of differences, these miRNAs are worthy candidates to further explore novel biological links towards CSC-based research.
Of the top ten miRNAs that were found to be down-regulated in spheroids, five miRNAs (miR-221, miR-27b, miR-125b, miR-760, and miR- 301a) have previously been reported to be involved in breast cancer and two miRNAs (miR-30c, and let-7f) in breast CSCs. The five down-regulated miRNAs found in breast cancer have roles in drug resistance and EMT (miR-221) [91], tumour growth (miR-27b) [79], cell motility (miR-125b) [92], chemoresistance (miR-760) [93], and cell migration, invasion and proliferation (miR-301a) [94]. Hence, this provides a reason the spheroids behave more aggressively and exhibit higher chemoresistance compared to the parental. MiR-221, showing a >50-fold reduction in expression, is particularly interesting. It has been reviewed to be involved in estrogen receptor-negative breast cancer and also involved in drug resistance [95]. miR-221 has been identified as a regulator of EMT transition and induced EMT-like characteristics, responsible for cell invasion and migration [96], which is consistent with the biological significance of the present study. MiR-760 which had been functionally explored as a biomarker for early detection of colorectal cancer [97] and breast cancer [93], was also found as one of the top down-regulated miRNAs in this study. These findings indicated that miR-221 and miR-760 may be an important CSC-regulated miRNAs which have not been previously reported, and suggest a potential role as targets for CSCs therapeutics. Down-regulation of let-7f and miR-30c confirmed the notion that CSCs were enriched in MCF-7 spheroids [15, 98, 99], and these miRNAs may not only regulate CSCs mechanisms, but may also enhance breast cancer cells sensitivity to chemotherapeutics drugs. Two miRNAs, miR-4448 and miR-1296, which have not been linked to breast cancer, but involved in other types of cancer [100, 101], were observed in our study (Table 2). Further studies are needed to elucidate these potential oncogenic miRNAs implicated in breast cancer and their functional roles in modulating CSCs.
The pathway analysis revealed that these genes were significantly related to the “axon guidance pathway”, “pathways in cancer”, “MAPK signalling pathway”, “Wnt signalling pathway”, “regulation of actin cytoskeleton”, “insulin signalling”, “regulation of actin cytoskeleton”, “mTor signalling pathway” and “ubiquitin-mediated proteolysis” (Additional File 1: Table S8). All these pathways have been demonstrated to be linked to various cellular activities including proliferation, migration, invasion, formation of multicellular spheroid, regulation of estrogen receptor signalling, cancer progression, metastasis, self-renewal in cancer and CSCs, maintenance of EMT and stemness and breast cancer chemoresistance [102-106]. These results indicated that the differentially expressed miRNAs regulate important biological roles in the MCF-7 spheroids. A particularly interesting pathway found is “axon guidance” which has been thought to contribute major roles in breast cancer tumorigenesis [107] and in pancreatic carcinogenesis [108] and was recently found to be linked to chemoresistance in drug-resistant breast cancer cells [109]. “Endocytosis pathway” which was enriched in the spheroids, is also consistent with the observation in breast CSCs isolated from breast cancer specimens [110]. “Regulation of cytoskeleton” and “adherens junction” pathways are also the major pathways found in stem cells, where increasing evidence has demonstrated that the remodelling of the cytoskeletal proteins can determine the stem cell fate [111-113]. GO analysis also showed noticeable changes in cellular components of the spheroids (GO: 0005911, cell-cell junction; GO: 0015629, actin cytoskeleton) which gives the spheroids their higher cell proliferation and cell migration characteristics. Gene clustering governing cell cycle is also an important feature of CSCs for the maintenance of self-renew ability and proliferation characteristics [114, 115]. GO analysis demonstrated that there are changes in cell cycle-related gene cluster (GO: 0031571, mitotic G1 DNA damage check point; GO: 0051302, regulation of cell division; GO: 0045930, negative regulation of mitotic cell cycle; GO: 0031575, G1/S transition check point) which correlates to their higher proliferation activity and metastasis ability in spheroids. Taken together, the GO terms and KEGG pathways enriched from the predicted miRNAs found in the spheroids further illustrated the possible roles of these miRNAs in breast spheroid chemoresistance and maintenance of self-renewal. It appeared likely that the spheroids have undergone some morphological changes and through the EMT process, proliferated faster, acquired a higher migration and invasion properties, higher chemosensitivity and most probable enriched with CSCs populations, in agreement with other recent studies [116, 117].
With frequent relapse of breast cancer and limited treatment options, miRNAs-targeted therapies may be the next option. To summarize, this work is among the first to provide a comprehensive comparisons in terms of the miRNAs expressions in the spheroid-enriched CSCs model. The work described here demonstrated the biological features and the roles played by certain miRNAs of the spheroid-enriched CSCs model. We believe that this paper has also an important application for identifying novel miRNAs and gene targets that may play a role not only in breast CSCs, but also in other cancers. While the method of mimicking the CSCs tumour model using spheroid enrichment method, may only enrich a subset of the CSCs populations, it provides important insights into the breast CSCs carcinogenesis mechanisms. It should be interesting to analyze the functional roles in breast spheroids of the differentially expressed miRNAs that have not been previously linked to breast cancers. Our work may provide insight into the possible role of miRNAs as biomarkers for therapeutic targets in breast cancer management.
Supplementary Material
Additional File 1Figures S1, Tables S1-S9.
Figures S2.
Abbreviations
2D: two-dimensional; CO2: Carbon dioxide; CSCs: Cancer stem cells; 3D: three-dimensional; DMEM/F12: Dulbecco's Modified Eagle Medium/Nutrient Mixture F-12; EMT: epithelial to mesenchymal transition; MCF-7: Estrogen-dependent human breast adenocarcinoma cell line; miR: microRNAs; NGS: next generation sequencing; SFE: sphere-forming efficiency
Acknowledgements
The authors wish to acknowledge the Ministry of Science, Technology and Innovation of Malaysia (MOSTI) for the E-Science Fund (02-02-11-SF0125); UM High Impact Research Grants (UM-MOHE HIR Grant UM.C/625/1/HIR/MOHE/CHAN/01, no. A000001-50001; UM-MOHE HIR Grant UM.C/625/1/HIR/MOHE/CHAN/14/1, H-50001-A000027), Universiti Tunku Abdul Rahman Research Fund (UTARRF) (A6200/A14) and MAKNA Cancer Research Award 2013 for the financial support.
Authors Contributions
Designed the experiments: LB, WYH, HKO, SKY. Performed the experiments: LB, NMA, HK, WCL, KGC, WFY. Analyzed the data: LB, NMA, WYH, DAS, SKY. Contributed reagents/materials/analysis tools: HKO, SWT, SKY, SKC, WYH, KGC, SKC. Manuscript preparation: LB, SKY, HKO.
Competing Interests
The authors have declared no competing interest exists.
References
1. Ferlay J, Shin H-R, Bray F, Forman D, Mathers C, Parkin DM. Estimates of worldwide burden of cancer in 2008: GLOBOCAN 2008. International Journal of Cancer. 2010;127:2893-917
2. DeSantis C, Howlader N, Cronin KA, Jemal A. Breast Cancer Incidence Rates in U.S. Women Are No Longer Declining. Cancer Epidemiology Biomarkers & Prevention. 2011;20:733-9
3. Schiff R, Massarweh S, Shou J, Osborne CK. Breast Cancer Endocrine Resistance: How Growth Factor Signaling and Estrogen Receptor Coregulators Modulate Response. Clinical Cancer Research. 2003;9:447-54
4. Setoguchi T, Taga T, Kondo T. Cancer Stem Cells Persist in Many Cancer Cell Lines. Cell Cycle. 2004;3:412-3
5. Dean M. Cancer stem cells: Implications for cancer causation and therapy resistance. Discovery Medicine. 2005;5:278-82
6. Dean M. Cancer stem cells: redefining the paradigm of cancer treatment strategies. Molecular Interventions. 2006;6:140-8
7. Al-Hajj M, Clarke MF. Self-renewal and solid tumor stem cells. Oncogene. 2004;23:7274-82
8. Al-Hajj M, Wicha MS, Benito-Hernandez A, Morrison SJ, Clarke MF. Prospective identification of tumorigenic breast cancer cells. Proceedings of the National Academy of Sciences of the USA. 2003;100:3983-8
9. Stefanie Sassen, Eric A. Miska, Caldas C. MicroRNA—implications for cancer. European Journal of Pathology. 2008;452:1-10
10. Zhang B, Pan X, Cobb GP, Anderson TA. microRNAs as oncogenes and tumor suppressors. Developmental Biology. 2007;302:1-12
11. Deng S, Calin GA, Croce CM, Coukos G, Zhang L. Mechanisms of microRNA deregulation in human cancer. Cell Cycle. 2008;7:2643-6
12. Takahashi R-u, Miyazaki H, Ochiya T. The role of microRNAs in the regulation of cancer stem cells. Frontiers in Genetics. 2014;4:1-11
13. Ochiya T, Ji J, Wang X. Identification of Cancer Stem Cell-Related MicroRNAs in Hepatocellular Carcinoma. Springer New York: Liver Stem Cells. 2011:163-75
14. Liu C, Tang DG. MicroRNA Regulation of Cancer Stem Cells. Cancer Research. 2011;71:5950-4
15. Schwarzenbacher D, Balic M, Pichler M. The Role of MicroRNAs in Breast Cancer Stem Cells. International Journal of Molecular Sciences. 2013;14:14712-23
16. Yang Q, Hua J, Wang L, Xu B, Zhang H, Ye N. et al. MicroRNA and piRNA Profiles in Normal Human Testis Detected by Next Generation Sequencing. PLoS ONE. 2013;8:e66809
17. Nygaard S, Jacobsen A, Lindow M, Eriksen J, Balslev E, Flyger H. et al. Identification and analysis of miRNAs in human breast cancer and teratoma samples using deep sequencing. BMC Medical Genomics. 2009;2:35-50
18. Murakami Y, Tanahashi T, Okada R, Toyoda H, Kumada T, Enomoto M. et al. Comparison of Hepatocellular Carcinoma miRNA Expression Profiling as Evaluated by Next Generation Sequencing and Microarray. PLoS ONE. 2014;9:e106314
19. Wyman SK, Parkin RK, Mitchell PS, Fritz BR, O'Briant K, Godwin AK. et al. Repertoire of microRNAs in Epithelial Ovarian Cancer as Determined by Next Generation Sequencing of Small RNA cDNA Libraries. PLoS ONE. 2009;4:e5311
20. Iorio MV, Ferracin M, Liu C-G, Veronese A, Spizzo R, Sabbioni S. et al. MicroRNA Gene Expression Deregulation in Human Breast Cancer. Cancer Research. 2005;65:7065-70
21. Porkka KP, Pfeiffer MJ, Waltering KK, Vessella RL, Tammela TLJ, Visakorpi T. MicroRNA Expression Profiling in Prostate Cancer. Cancer Research. 2007;67:6130-5
22. Shevde LA, Metge BJ, Mitra A, Xi Y, Ju J, King JA. et al. Spheroid-forming subpopulation of breast cancer cells demonstrates vasculogenic mimicry via hsa-miR-299a-5p regulated de novo expression of osteopontin. Journal of Cellular and Molecular Medicine. 2010;14:1693-706
23. Hirschhaeuser F, Menne H, Dittfeld C, West J, Mueller-Klieser W, Kunz-Schughart LA. Multicellular tumor spheroids: An underestimated tool is catching up again. Journal of Biotechnology. 2010;148:3-15
24. Weiswald L-B, Bellet D, Dangles-Marie V. Spherical Cancer Models in Tumor Biology. Neoplasia. 2015;17:1-15
25. Nagelkerke A, Bussink J, Sweep FCGJ, Span PN. Generation of multicellular tumor spheroids of breast cancer cells: How to go three-dimensional. Analytical Biochemistry. 2013;437:17-9
26. Reya T, Morrison SJ, Clarke MF, Weissman IL. Stem cells, cancer, and cancer stem cells. Nature. 2001;414:105-11
27. Singec I, Knoth R, Meyer RP, Maciaczyk J, Volk B, Nikkhah G. et al. Defining the actual sensitivity and specificity of the neurosphere assay in stem cell biology. Nature Methods. 2006;3:801-6
28. Pastrana E, Silva-Vargas V, Doetsch F. Eyes Wide Open: A Critical Review of Sphere-Formation as an Assay for Stem Cells. Cell stem cell. 2011;8:486-98
29. Fluri DA, Tonge PD, Song H, Baptista RP, Shakiba N, Shukla S. et al. Derivation, expansion and differentiation of induced pluripotent stem cells in continuous suspension cultures. Nature Methods. 2012;9:509-16
30. Zhang G, Xiong K, Ma W, Xu W, Zeng H. Initiate Tumors with Single Cell Spheres Formed in Serum-Containing Medium. Journal of Cancer. 2015;6:901-12
31. Chen S-F, Chang Y-C, Nieh S, Liu C-L, Yang C-Y, Lin Y-S. Nonadhesive Culture System as a Model of Rapid Sphere Formation with Cancer Stem Cell Properties. PLoS ONE. 2012;7:e31864
32. Shmelkov SV, Butler JM, Hooper AT, Hormigo A, Kushner J, Milde T. et al. CD133 expression is not restricted to stem cells, and both CD133+ and CD133- metastatic colon cancer cells initiate tumors. The Journal of Clinical Investigation. 2008;118:2111-20
33. Perego M, Tortoreto M, Tragni G, Mariani L, Deho P, Carbone A. et al. Heterogeneous Phenotype of Human Melanoma Cells with In Vitro and In Vivo Features of Tumor-Initiating Cells. Journal of Investigative Dermatology. 2010;130:1877-86
34. Kim JB, Stein R, MJ OH. Three-dimensional in vitro tissue culture models of breast cancer-a review. Breast Cancer Research and Treatment. 2004;85:281-91
35. Ekert JE, Johnson K, Strake B, Pardinas J, Jarantow S, Perkinson R. et al. Three-Dimensional Lung Tumor Microenvironment Modulates Therapeutic Compound Responsiveness In vitro Implication for Drug Development. PLoS ONE. 2013;9:e92248
36. Baker BM, Chen CS. Deconstructing the third dimension: how 3D culture microenvironments alter cellular cues. Journal of Cell Science. 2012;125:3015-24
37. Sutherland RM. Cell and environment interactions in tumor microregions: the multicell spheroid model. Science. 1988;240:177-84
38. Pickl M, Ries CH. Comparison of 3D and 2D tumor models reveals enhanced HER2 activation in 3D associated with an increased response to trastuzumab. Oncogene. 2008;28:461-8
39. Imamura Y, Mukohara T, Shimono Y, Funakoshi Y, Chayahara N, Toyoda M. et al. Comparison of 2D- and 3D-culture models as drug-testing platforms in breast cancer. Oncology Reports. 2015;33:1837-43
40. Robertson FM, Ogasawara MA, Ye Z, Chu K, Pickei R, Debeb BG. et al. Imaging and Analysis of 3D Tumor Spheroids Enriched for a Cancer Stem Cell Phenotype. Journal of Biomolecular Screening. 2010;15:820-9
41. Lopez J, Poitevin A, Mendoza-Martinez V, Perez-Plasencia C, Garcia-Carranca A. Cancer-initiating cells derived from established cervical cell lines exhibit stem-cell markers and increased radioresistance. BMC Cancer. 2012;12:48
42. Liu J, Ma L, Xu J, Liu C, Zhang J, Chen R. et al. Spheroid body-forming cells in the human gastric cancer cell line MKN-45 possess cancer stem cell properties. International Journal of Oncology. 2013;42:453-9
43. Grimshaw M, Cooper L, Papazisis K, Coleman J, Bohnenkamp H, Chiapero-Stanke L. et al. Mammosphere culture of metastatic breast cancer cells enriches for tumorigenic breast cancer cells. Breast Cancer Research. 2008;10:R52
44. Cao L, Zhou Y, Zhai B, Liao J, Xu W, Zhang R. et al. Sphere-forming cell subpopulations with cancer stem cell properties in human hepatoma cell lines. BMC Gastroenterology. 2011;11:71
45. Li Y, Zhang T, Korkaya H, Liu S, Lee H-F, Newman B. et al. Sulforaphane, a Dietary Component of Broccoli/Broccoli Sprouts, Inhibits Breast Cancer Stem Cells. Clinical cancer research: an official journal of the American Association for Cancer Research. 2010;16:2580-90
46. Wen Z, Liao Q, Hu Y, You L, Zhou L, Zhao Y. A spheroid-based 3-D culture model for pancreatic cancer drug testing, using the acid phosphatase assay. Brazilian Journal of Medical and Biological Research. 2013;46:634-42
47. Vinci M, Gowan S, Boxall F, Patterson L, Zimmermann M, Court W. et al. Advances in establishment and analysis of three-dimensional tumor spheroid-based functional assays for target validation and drug evaluation. BMC Biology. 2012;10:29
48. Fan X, Liu S, Su F, Pan Q, Lin T. Effective enrichment of prostate cancer stem cells from spheres in a suspension culture system. Urologic Oncology. 2010;30:314-8
49. Abboodi M. Isolation, identification, and spheroids formation of breast cancer stem cells, therapeutics implications. Clinical Cancer Investigation Journal. 2014;3:322-5
50. Felthaus O, Ettl T, Gosau M, Driemel O, Brockhoff G, Reck A. et al. Cancer stem cell-like cells from a single cell of oral squamous carcinoma cell lines. Biochemical and Biophysical Research Communications. 2011;407:28-33
51. Croker AK, Goodale D, Chu J, Postenka C, Hedley BD, Hess DA. et al. High aldehyde dehydrogenase and expression of cancer stem cell markers selects for breast cancer cells with enhanced malignant and metastatic ability. Journal of Cellular and Molecular Medicine. 2009;13:2236-52
52. Holliday D, Speirs V. Choosing the right cell line for breast cancer research. Breast Cancer Research. 2011;13:215
53. Ho WY, Yeap SK, Ho CL, Rahim RA, Alitheen NB. Development of Multicellular Tumor Spheroid (MCTS) Culture from Breast Cancer Cell and a High Throughput Screening Method Using the MTT Assay. PLoS ONE. 2012;7:e44640
54. Mosmann T. Rapid colorimetric assay for cellular growth and survival: Application to proliferation and cytotoxicity assays. Journal of Immunological Methods. 1983;65:55-63
55. Rampersad SN. Multiple Applications of Alamar Blue as an Indicator of Metabolic Function and Cellular Health in Cell Viability Bioassays. Sensors (Basel, Switzerland). 2012;12:12347-60
56. Schneider CA, Rasband WS, Eliceiri KW. NIH Image to ImageJ: 25 years of image analysis. Nature Methods. 2012;9:671-5
57. Huang DW, Sherman BT, Lempicki RA. Systematic and integrative analysis of large gene lists using DAVID bioinformatics resources. Nature Protocols. 2008;4:44-57
58. Huang DW, Sherman BT, Lempicki RA. Bioinformatics enrichment tools: paths toward the comprehensive functional analysis of large gene lists. Nucleic Acids Research. 2009;37:1-13
59. Martin TA, Harrison G, Mansel RE, Jiang WG. The role of the CD44/ezrin complex in cancer metastasis. Critical reviews in Oncology/Hematology. 2003;46:165-86
60. Wei W, Hu H, Tan H, Chow L, Yip A, Loo W. Relationship of CD44+CD24-/low breast cancer stem cells and axillary lymph node metastasis. Journal of Translational Medicine. 2012;10:S6
61. Ginestier C, Hur MH, Charafe-Jauffret E, Monville F, Dutcher J, Brown M. et al. ALDH1 is a marker of normal and malignant human mammary stem cells and a predictor of poor clinical outcome. Cell stem cell. 2007;1:555-67
62. Calcagno AM, Salcido CD, Gillet J-P, Wu C-P, Fostel JM, Mumau MD. et al. Prolonged Drug Selection of Breast Cancer Cells and Enrichment of Cancer Stem Cell Characteristics. Journal of the National Cancer Institute. 2010;102:1637-52
63. Collins AT, Berry PA, Hyde C, Stower MJ, Maitland NJ. Prospective Identification of Tumorigenic Prostate Cancer Stem Cells. Cancer Research. 2005;65:10946-51
64. Lin S-P, Lee Y-T, Wang J-Y, Miller SA, Chiou S-H, Hung M-C. et al. Survival of Cancer Stem Cells under Hypoxia and Serum Depletion via Decrease in PP2A Activity and Activation of p38-MAPKAPK2-Hsp27. PLoS ONE. 2012;7:e49605
65. Kruyt FAE, Schuringa JJ. Apoptosis and cancer stem cells: Implications for apoptosis targeted therapy. Biochemical Pharmacology. 2010;80:423-30
66. Geng S, Guo Y, Wang Q, Li L, Wang J. Cancer stem-like cells enriched with CD29 and CD44 markers exhibit molecular characteristics with epithelial-mesenchymal transition in squamous cell carcinoma. Archives of Dermatological Research. 2013;305:35-47
67. Meyer MJ, Fleming JM, Lin AF, Hussnain SA, Ginsburg E, Vonderhaar BK. CD44posCD49fhiCD133/2hi Defines Xenograft-Initiating Cells in Estrogen Receptor Negative Breast Cancer. Cancer Research. 2010;70:4624-33
68. Ricardo S, Vieira AF, Gerhard R, Leitao D, Pinto R, Cameselle-Teijeiro JF. et al. Breast cancer stem cell markers CD44, CD24 and ALDH1: expression distribution within intrinsic molecular subtype. Journal of Clinical Pathology. 2011;64:937-46
69. Li T, Su Y, Mei Y, Leng Q, Leng B, Liu Z. et al. ALDH1A1 is a marker for malignant prostate stem cells and predictor of prostate cancer patients's outcome. Laboratory Investigation. 2010;90:234-44
70. Branch P, Masson M, Aquilina G, Bignami M, Karran P. Spontaneous development of drug resistance: mismatch repair and p53 defects in resistance to cisplatin in human tumor cells. Oncogene. 2000;19:3138-45
71. Sheridan C, Kishimoto H, Fuchs R, Mehrotra S, Bhat-Nakshatri P, Turner C. et al. CD44+/CD24- breast cancer cells exhibit enhanced invasive properties: an early step necessary for metastasis. Breast Cancer Research. 2006;8:R59
72. Yan W, Chen Y, Yao Y, Zhang H, Wang T. Increased invasion and tumorigenicity capacity of CD44+/CD24- breast cancer MCF7 cells in vitro and in nude mice. Cancer Cell International. 2013;13:62
73. Sodek KL, Ringuette MJ, Brown TJ. Compact spheroid formation by ovarian cancer cells is associated with contractile behavior and an invasive phenotype. International Journal of Cancer. 2009;124:2060-70
74. Ivascu A, Kubbies M. Diversity of cell-mediated adhesions in breast cancer spheroids. International Journal of Oncology. 2007;31:1403-13
75. Ludwig K, Tse E, Wang J. Colon cancer cells adopt an invasive phenotype without mesenchymal transition in 3-D but not 2-D culture upon combined stimulation with EGF and crypt growth factors. BMC Cancer. 2013;13:221
76. Hoppe R, Achinger-Kawecka J, Winter S, Fritz P, Lo W-Y, Schroth W. et al. Increased expression of miR-126 and miR-10a predict prolonged relapse-free time of primary oestrogen receptor-positive breast cancer following tamoxifen treatment. European Journal of Cancer. 2013;49:3598-608
77. Fix LN, Shah M. et al. MicroRNA expression profile of MCF-7 human breast cancer cells and the effect of green tea polyphenon-60. Cancer Genomics Proteomics. 2010;7:261-77
78. Yan LX, Wu QN, Zhang Y, Li YY, Liao DZ, Hou JH. et al. Knockdown of miR-21 in human breast cancer cell lines inhibits proliferation, in vitro migration and in vivo tumor growth. Breast Cancer Research. 2011;13:R2
79. Jin L, Wessely O, Marcusson EG, Ivan C, Calin GA, Alahari SK. Prooncogenic Factors miR-23b and miR-27b Are Regulated by Her2/Neu, EGF, and TNF-α in Breast Cancer. Cancer Research. 2013;73:2884-96
80. Lund AH. miR-10 in development and cancer. Cell Death & Differentiation. 2009;17:209-14
81. Ma L. Role of miR-10b in breast cancer metastasis. Breast Cancer Research. 2010;12:210-15
82. Tan Y, Zhang B, Wu T, Skogerbo G, Zhu X, Guo X. et al. Transcriptional inhibiton of Hoxd4 expression by miRNA-10a in human breast cancer cells. BMC Molecular Biology. 2009;10:12
83. Chien WW, Domenech C, Catallo R, Kaddar T, Magaud JP, Salles G. et al. Cyclin-dependent kinase 1 expression is inhibited by p16INK4a at the post-transcriptional level through the microRNA pathway. Oncogene. 2011;30:1880-91
84. Chen J, Wang M, Guo M, Xie Y, Cong Y-S. miR-127 Regulates Cell Proliferation and Senescence by Targeting BCL6. PLoS ONE. 2013;8:e80266
85. van Schooneveld E, Wouters M, Van der Auwera I, Peeters D, Wildiers H, Van Dam P. et al. Expression profiling of cancerous and normal breast tissues identifies microRNAs that are differentially expressed in serum from patients with (metastatic) breast cancer and healthy volunteers. Breast Cancer Research. 2012;14:R34
86. Zhu J, Zheng Z, Wang J, Sun J, Wang P, Cheng X. et al. Different miRNA expression profiles between human breast cancer tumors and serum. Frontiers in Genetics. 2014;5:149
87. Gasparini P, Cascione L, Fassan M, Lovat F, Guler G, Balci S. et al. microRNA expression profiling identifies a four microRNA signature as a novel diagnostic and prognostic biomarker in triple negative breast cancers. Oncotarget. 2014;5:1174-84
88. Xu Y, Ohms SJ, Li Z, Wang Q, Gong G, Hu Y. et al. Changes in the Expression of miR-381 and miR-495 Are Inversely Associated with the Expression of the MDR1 Gene and Development of Multi-Drug Resistance. PLoS ONE. 2013;8:e82062
89. Josson S, Gururajan M, Hu P, Shao C, Chu C-Y, Zhau HE. et al. miR-409-3p/-5p promotes tumorigenesis, epithelial to mesenchymal transition and bone metastasis of human prostate cancer. Clinical Cancer Research. 2014;20:4636-46
90. Zhang J, Luo X, Li H, Deng L, Wang Y. Genome-Wide Uncovering of STAT3-Mediated miRNA Expression Profiles in Colorectal Cancer Cell Lines. BioMed Research International. 2014;2014:11
91. Gan R, Yang Y, Yang X, Zhao L, Lu J, Meng QH. Downregulation of miR-221/222 enhances sensitivity of breast cancer cells to tamoxifen through upregulation of TIMP3. Cancer Gene Therapy. 2014;21:290-6
92. Akhavantabasi S, Sapmaz A, Tuna S, Erson-Bensan AE. miR-125b Targets ARID3B in Breast Cancer Cells. Cell Structure and Function. 2012;37:27-38
93. Lv J, Xia K, Xu P, Sun E, Ma J, Gao S. et al. miRNA expression patterns in chemoresistant breast cancer tissues. Biomedicine & Pharmacotherapy. 2014;68:935-42
94. Shi W, Gerster K, Alajez NM, Tsang J, Waldron L, Pintilie M. et al. MicroRNA-301 Mediates Proliferation and Invasion in Human Breast Cancer. Cancer Research. 2011;71:2926-37
95. Shah M, Calin G. MicroRNAs miR-221 and miR-222: a new level of regulation in aggressive breast cancer. Genome Medicine. 2011;3:56
96. Stinson S, Lackner MR, Adai AT, Yu N, Kim H-J, O'Brien C. et al. TRPS1 Targeting by miR-221/222 Promotes the Epithelial-to-Mesenchymal Transition in Breast Cancer. Science Signal. 2011;4:ra41
97. Wang Q, Huang Z, Ni S, Xiao X, Xu Q, Wang L. et al. Plasma miR-601 and miR-760 Are Novel Biomarkers for the Early Detection of Colorectal Cancer. PLoS ONE. 2012;7:e44398
98. Yu F, Yao H, Zhu P, Zhang X, Pan Q, Gong C. et al. let-7 Regulates Self Renewal and Tumorigenicity of Breast Cancer Cells. Cell. 2007;131:1109-23
99. Yu F, Deng H, Yao H, Liu Q, Su F, Song E. Mir-30 reduction maintains self-renewal and inhibits apoptosis in breast tumor-initiating cells. Oncogene. 2010;29:4194-204
100. Hibino S, Saito Y, Muramatsu T, Otani A, Kasai Y, Kimura M. et al. Inhibitors of enhancer of zeste homolog 2 (EZH2) activate tumor-suppressor microRNAs in human cancer cells. Oncogenesis. 2014;3:e104
101. Majid S, Dar AA, Saini S, Chen Y, Shahryari V, Liu J. et al. Regulation of Minichromosome Maintenance Gene Family by MicroRNA-1296 and Genistein in Prostate Cancer. Cancer Research. 2010;70:2809-18
102. Britten CD. Targeting ErbB receptor signaling: A pan-ErbB approach to cancer. Molecular Cancer Therapeutics. 2004;3:1335-42
103. Shrivastav A, Murphy L. Interactions of PI3K/Akt/mTOR and estrogen receptor signaling in breast cancer. Breast Cancer Management. 2012;1:235-49
104. Dhillon AS, Hagan S, Rath O, Kolch W. MAP kinase signalling pathways in cancer. Oncogene. 2007;26:3279-90
105. Holland JD, Klaus A, Garratt AN, Birchmeier W. Wnt signaling in stem and cancer stem cells. Current Opinion in Cell Biology. 2013;25:254-64
106. Malaguarnera R, Belfiore A. The Emerging Role of Insulin and Insulin-Like Growth Factor Signaling in Cancer Stem Cells. Frontiers in Endocrinology. 2014;5:10
107. Harburg GC, Hinck L. Navigating Breast Cancer: Axon Guidance Molecules as Breast Cancer Tumor Suppressors and Oncogenes. Journal of Mammary Gland Biology and Neoplasia. 2011;16:257-70
108. Biankin AV, Waddell N, Kassahn KS, Gingras M-C, Muthuswamy LB, Johns AL. et al. Pancreatic cancer genomes reveal aberrations in axon guidance pathway genes. Nature. 2012;491:399-405
109. Chen W-x, Liu X-m, Lv M-m, Chen L, Zhao J-h, Zhong S-l. et al. Exosomes from Drug-Resistant Breast Cancer Cells Transmit Chemoresistance by a Horizontal Transfer of MicroRNAs. PLoS ONE. 2014;9:e95240
110. Palaniyandi K, Pockaj BA, Gendler SJ, Chang X-B. Human Breast Cancer Stem Cells Have Significantly Higher Rate of Clathrin-Independent and Caveolin-Independent Endocytosis than the Differentiated Breast Cancer Cells. Journal of Cancer Science & Therapy. 2012;4:214-22
111. Treiser MD, Yang EH, Gordonov S, Cohen DM, Androulakis IP, Kohn J. et al. Cytoskeleton-based forecasting of stem cell lineage fates. Proceedings of the National Academy of Sciences. 2009;107:610-5
112. McBeath R, Pirone DM, Nelson CM, Bhadriraju K, Chen CS. Cell Shape, Cytoskeletal Tension, and RhoA Regulate Stem Cell Lineage Commitment. Developmental Cell. 2004;6:483-95
113. Yim E, Sheetz M. Force-dependent cell signaling in stem cell differentiation. Stem Cell Research & Therapy. 2012;3:41
114. White J, Dalton S. Cell cycle control of embryonic stem cells. Stem Cell Reviews. 2005;1:131-8
115. Pauklin S, Vallier L. The Cell-Cycle State of Stem Cells Determines Cell Fate Propensity. Cell. 2013;155:135-47
116. Yang G, Quan Y, Wang W, Fu Q, Wu J, Mei T. et al. Dynamic equilibrium between cancer stem cells and non-stem cancer cells in human SW620 and MCF-7 cancer cell populations. British Journal of Cancer. 2012;106:1512-9
117. Liao J, Qian F, Tchabo N, Mhawech-Fauceglia P, Beck A, Qian Z. et al. Ovarian Cancer Spheroid Cells with Stem Cell-Like Properties Contribute to Tumor Generation, Metastasis and Chemotherapy Resistance through Hypoxia-Resistant Metabolism. PLoS ONE. 2014;9:e84941
118. Shen J, Niu W, Zhou M, Zhang H, Ma J, Wang L. et al. MicroRNA-410 Suppresses Migration and Invasion by Targeting MDM2 in Gastric Cancer. PLoS ONE. 2014;9:e104510
119. Zheng B, Liang L, Huang S, Zha R, Liu L, Jia D. et al. MicroRNA-409 suppresses tumour cell invasion and metastasis by directly targeting radixin in gastric cancers. Oncogene. 2012;31:4509-16
120. Okamoto K, Ishiguro T, Midorikawa Y, Ohata H, Izumiya M, Tsuchiya N. et al. miR-493 induction during carcinogenesis blocks metastatic settlement of colon cancer cells in liver. The EMBO Journal. 2012;31:1752-63
121. Gu Y, Cheng Y, Song Y, Zhang Z, Deng M, Wang C. et al. MicroRNA-493 Suppresses Tumor Growth, Invasion and Metastasis of Lung Cancer by Regulating E2F1. PLoS ONE. 2014;9:e102602
122. Li X, Mertens-Talcott SU, Zhang S, Kim K, Ball J, Safe S. MicroRNA-27a Indirectly Regulates Estrogen Receptor α Expression and Hormone Responsiveness in MCF-7 Breast Cancer Cells. Endocrinology. 2009;151:2462-73
123. Zhou M, Liu W, Ma S, Cao H, Peng X, Guo L. et al. A novel onco-miR-365 induces cutaneous squamous cell carcinoma. Carcinogenesis. 2013;34:1653-9
124. Gastaldi Cc, Bertero T, Xu N, Bourget-Ponzio I, Lebrigand Kv, Fourre S. et al. miR-193b/365a cluster controls progression of epidermal squamous cell carcinoma. Carcinogenesis. 2013;35:1110-20
Author contact
![]() Corresponding author: Han Kiat Ong, E-mail address: onghkedu.my.
Corresponding author: Han Kiat Ong, E-mail address: onghkedu.my.