Impact Factor ISSN: 1449-2288

 Global reach, higher impact
Int J Biol Sci 2016; 12(5):617-630. doi:10.7150/ijbs.13525 This issue Cite
Research Paper
Modeling Energy Dynamics in Mice with Skeletal Muscle Hypertrophy Fed High Calorie Diets
Nichole D. Bond1, Juen Guo2, Kevin D. Hall2, Alexandra C. McPherron1# ![]()
1. Genetics of Development and Disease Branch, National Institute of Diabetes and Digestive and Kidney Diseases, National Institutes of Health, Bethesda, Maryland 20892 USA;
2. Laboratory of Biological Modeling, National Institute of Diabetes and Digestive and Kidney Diseases, National Institutes of Health, Bethesda, Maryland 20892 USA.
#Current addresses: MyoTherapeutics, Silver Spring, MD. amcpherron@myotherapeutics.com
Received 2015-8-11; Accepted 2016-2-17; Published 2016-4-1
Abstract

Retrospective and prospective studies show that lean mass or strength is positively associated with metabolic health. Mice deficient in myostatin, a growth factor that negatively regulates skeletal muscle mass, have increased muscle and body weights and are resistant to diet-induced obesity. Their leanness is often attributed to higher energy expenditure in the face of normal food intake. However, even obese animals have an increase in energy expenditure compared to normal weight animals suggesting this is an incomplete explanation. We have previously developed a computational model to estimate energy output, fat oxidation and respiratory quotient from food intake and body composition measurements to more accurately account for changes in body composition in rodents over time. Here we use this approach to understand the dynamic changes in energy output, intake, fat oxidation and respiratory quotient in muscular mice carrying a dominant negative activin receptor IIB expressed specifically in muscle. We found that muscular mice had higher food intake and higher energy output when fed either chow or a high-fat diet for 15 weeks compared to WT mice. Transgenic mice also matched their rate of fat oxidation to the rate of fat consumed better than WT mice. Surprisingly, when given a choice between high-fat diet and Ensure® drink, transgenic mice consumed relatively more calories from Ensure® than from the high-fat diet despite similar caloric intake to WT mice. When switching back and forth between diets, transgenic mice adjusted their intake more rapidly than WT to restore normal caloric intake. Our results show that mice with myostatin inhibition in muscle are better at adjusting energy intake and output on diets of different macronutrient composition than WT mice to maintain energy balance and resist weight gain.
Keywords: Computational modeling, energy balance, fat oxidation, food intake, high-fat diet, myostatin, obesity, skeletal muscle hypertrophy.
Introduction
The prevalence of obesity and associated metabolic diseases, such as type 2 diabetes mellitus (T2DM), is increasing worldwide (1). Given that T2DM is a complex multi-organ disease, prevention should be more efficacious in reducing the prevalence of diabetes than treatment of established disease. Insulin resistance, a prerequisite for the development of T2DM, is detected earlier in skeletal muscle than in other tissues (2). Retrospective and prospective studies have shown that lean mass or strength is inversely associated with all-cause mortality, the metabolic syndrome (a group of risk factors that includes central obesity, elevated fasting glucose, hypertension, and dyslipidemia (3)), or insulin resistance (4-8). In support of these associations, manipulating muscle mass using genetically altered mice clearly demonstrates that higher lean mass prevents obesity and insulin resistance (9-14).
One explanation for the resistance to fat gain in individuals with increased lean mass is elevated energy expenditure (EE). EE is typically measured by indirect calorimetry, a technique that measures the volumes of O2 and CO2 by gas analysis as a function of time. The calculations used to convert the volume of O2 to calories burned assume that all O2 consumed by the subject is used to oxidize nutrients. Simultaneous activity monitoring allows for calculating resting versus total O2 consumption or EE. The largest component of individual's total EE is the basal metabolic rate, the minimal rate calories are burned per hour. Lean tissues (or fat-free mass (FFM)) consume more energy and thus have higher EE than adipose tissue. Skeletal muscle, the single largest component of lean mass, comprises ~40% of human body mass and accounts for ~20% of the total basal EE (15). In fact, the amount of lean mass explains 70-85% of the variation in resting EE between individuals (16-18). For these reasons, differences in body composition between skeletal muscle and adipose tissue greatly affect EE.
EE measurements show that individuals with greater body weight have higher EE than smaller individuals, regardless of whether the weight comes from elevated adipose or lean tissue (19). EE alone is therefore uninformative in laboratory experiments when comparing animals of different body weight and composition. Some correction of the O2 consumption data is required due to different rates of EE between tissues. The exact method to use, however, is controversial. Simply dividing O2 consumption by body weight or even lean mass is misleading because of differences in metabolic rate between different tissues and disproportionate changes in size during weight loss (19-24). One example of this difficulty is in determining EE in WT mice and mice null for the gene that encodes myostatin (MSTN), a transforming growth factor beta family member that negatively regulates muscle mass (25). O2 consumption (and therefore EE) is higher in MSTN KO mice than WT mice using uncorrected data but lower than WT mice when these same data are normalized to body weight or lean mass (10). In humans, EE is adjusted to FFM by regression which shows a linear relationship among individuals with varying body composition (16,18,22). In WT inbred mice, however, due to the lack of adequate variation between animals and relatively small sample sizes, it is difficult to draw an accurate slope because of clustering of individual data points. Other computational adjustments using regression analysis or the respiratory quotient (RQ) have been proposed, although the validity of these approaches is also disputed (26-28).
In addition to normalization issues, the methodology of indirect calorimetry for measuring rodent energy expenditure has been called into question (20). The feeding behavior and physical activity of animals in the indirect calorimetry apparatus may not reflect their behavior in home cages particularly when fed high-fat (HF) diets or when under stress. This method may also not be sensitive enough to detect minimal differences between genotypes or treatment groups that may result in measurable differences in weight gain when sustained over long time periods. In addition, conclusions are typically drawn from indirect calorimetry and energy intake data obtained at short time intervals, often just days, rather than over the lifespan. Dynamic changes over the lifecycle can therefore be missed. For these reasons, energy expenditure and intake measurements in rodents often fail to adequately account for observed changes in body composition over time (28,29).
Mathematical modeling approaches have been developed to avoid these problems. Previously, two of us, Guo and Hall, developed a computational model in mice that can account for changes in body composition in WT mice fed different diets (30,31). Using carefully measured changes in food intake and repeated body composition measurements, the model estimates energy output, fat oxidation and the RQ over a period of months. Here, we use this modeling approach to estimate these parameters in mice that differ dramatically in body composition and in response to different diets. We show that muscular mice are able to adjust their energy output and fat oxidation to match their intake better than WT mice. Consequently, their energy balance is closer to zero, and they resist adipose tissue accumulation.
Materials
Diets
Diets were as follows: standard chow diet (NIH-31 Open Formula, Zeigler, East Berlin, PA); high-fat diet (HF) with 59% of calories from fat (catalog #F3282, Bio-Serv, Frenchtown, NJ); Ensure®, vanilla flavored Ensure® liquid diet (Ross Products Division, Abbott Laboratories, Columbus, OH); and HF diet with 45% calories from fat (catalog #D12451, Research Diets, New Brunswick, NJ). Energy density and diet composition are listed in Table 1. Chow or HF diet was given in enclosed Rodent CAFÉ chambers (OYC Americas, Andover, MA) that contain spillage, weighed every one to two days and refilled as needed and washed weekly. Ensure® was given in two 20 ml bottles in the hopper and weighed and changed daily.
Diet composition.
| NIH-31 | Bio-Serv F3282 | Ensure® | Research Diets D12451 | |
|---|---|---|---|---|
| Total (kcal/g) | 3.79 | 5.45 | 1.06 | 4.73 |
| Protein (% Energy) | 24 | 14 | 14 | 20 |
| Carbohydrate (% Energy) | 64 | 27 | 64 | 35 |
| Fat (% Energy) | 12 | 59 | 22 | 45 |
Chemicals
Oleoylethanolamide (OEA or oleylethanolamide) was obtained from Tocris Biosciences (Bristol, United Kingdom) and Tween 80 was obtained from Sigma-Aldrich (St. Louis, MO).
Methods
Animals
All animal experiments were approved by the Animal Care and Use Committee of the NIH, NIDDK. Muscle-DN mice and MSTN KO mice have been described elsewhere (25,32), bred at NIH and genotyped as in Guo et al (10) and McPherron et al (33). Mice were on a C57BL/6Ncr genetic background and control mice were non-transgenic littermates. Mice were individually housed, given food ad libitum and maintained on a 12-hr light/dark cycle with free access to water bottles at all times.
Feeding regimens
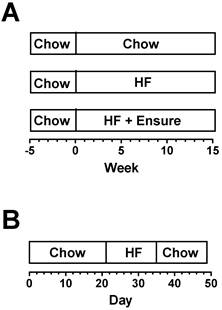
For computational analysis in Muscle-DN mice and WT littermates, male mice were placed on standard chow, 59% HF diet, or 59% HF diet plus Ensure® in chambers for 15 weeks starting at ~9 weeks of age (Figure 1A, n = 5-8 per group). Because mice came of age at different times, start and end times were staggered so that data was collected over more than 15 weeks to complete groups. One Muscle-DN mouse fed HF diet stopped eating in week 14 due to malocclusion and was euthanized. For MSTN KO mice and WT littermates, food intake in chambers was measured daily for 7 weeks in female mice age 17-26 weeks (Figure 1B, n = 8-9 per group). The feeding schedule was standard chow for 21 days, then 59% HF diet alone for 14 days, and then standard chow for 14 days.
Feeding regimens. (A) Muscle-DN mice were fed chow, HF diet or HF diet plus Ensure® for 15 weeks. (B) MSTN KO mice were fed chow for 21 days, HF diet for 14 days, then returned to chow for 14 days. Body composition was determined weekly starting at time 0 for all mice. Chow, NIH-31 diet; HF, 59% kcal from fat, Bio-Serv.
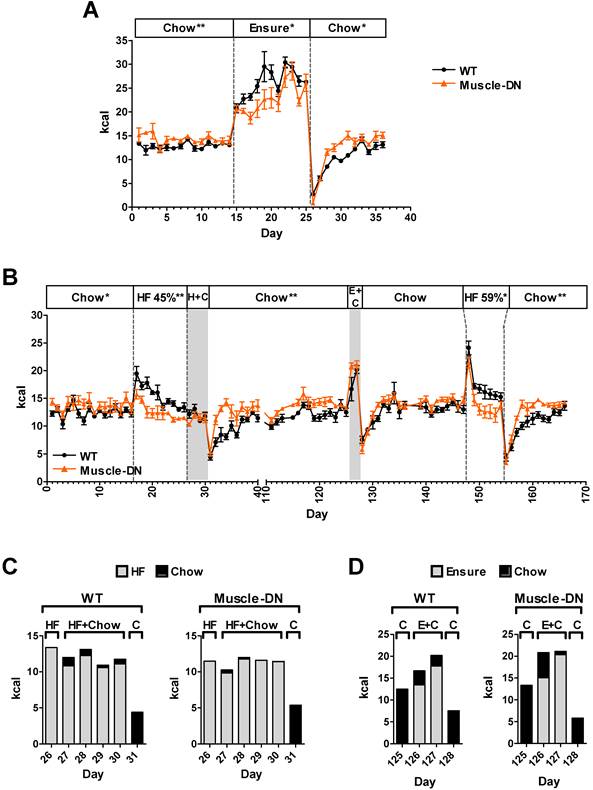
For diet switch experiments of chow to HF or chow to Ensure®, male Muscle-DN mice and WT littermates age 12-14 weeks were acclimated to Rodent CAFÉ™ chambers containing standard chow for ~2 weeks before data collection. Mice were fed standard chow, the HF diet of 45% calories from fat, the HF diet with 59% of calories from fat or Ensure® at indicated times. When Ensure® was given alone, the CAFÉ™ was removed and two bottles containing Ensure® were used in addition to a water bottle. When two solid diets were given simultaneously, two clean containers with one containing chow and one containing the HF diet were provided. For the experiment shown in Figure 6B, after 40 days of measurements of different diets in the CAFÉ™ chambers, mice were given chow in the hopper between days 40-95 and then reacclimated to the CAFÉ™ chambers with chow until measurements resumed again on day 111.
Rapid adaptation to dietary change by Muscle-DN mice. (A) Daily caloric intake in Muscle-DN or WT mice before, during and after switching to Ensure® diet alone for 11 days (days 15-25). (B) Daily caloric intake in a separate group of mice switched to 45% HF diet for 10 days followed by HF diet plus chow for 4 days (days 17-30), chow (days 31-125), Ensure® plus chow for 2 days (days 126-127), 59% HF diet for 7 days (days 148-154) and switched back to chow. (C) Intake by diet the day before, during and after simultaneous feeding of 45% HF diet and chow diet as indicated by day (days 26-31) in panel B. (D) Intake by diet the day before, during and after simultaneous feeding of Ensure® and chow diet as indicated by day (days 125-128) in panel B. Gray highlight designates the time period when two diets were supplied simultaneously. Dashed lines demarcate single Ensure® or HF diet. H+C: 45% HF plus chow; E+C: Ensure® plus chow; HF 59%: 59% HF diet. n = 5-7 per group. Statistical significance between genotypes by student's t test of the daily average intake during an indicated diet interval; *P < 0.05, **P < 0.01.
For 4-week cumulative food intake, standard chow was measured every two days in the hopper using male Muscle-DN mice starting at 20 weeks of age. For fasting-refeeding measurements, daily intake was measured for 3-4 days in male mice 30 weeks of age. Then mice were fasted for 24 hr starting at 8 am, and food intake was measured for the next 24 hr.
Body composition measurements for computational analysis
At time 0, body composition of awake mice was determined by NMR in an EchoMRI 3-in-1™ (Echo Medical Systems, Houston, TX). Body composition measurements were repeated weekly for 15 weeks (16 measurements) for Muscle-DN mice or for 7 weeks (8 measurements) for MSTN KO mice while fed different diets. For some animals, 1-2 weeks of body composition (but not food intake) measurements were lost due to down time on the instrument. Additional animals were added for 3-5 weeks spanning the lost time points so that all time points had body composition and food intake measurements from at least 5 animals with the exception of weeks 14 and 15 when one Muscle-DN mouse developed malocclusion on HF diet.
Computational analysis
The input for computational analysis was body composition, food intake and food composition. Because there was one additional time point for body composition compared to energy intake, the intake data were smoothed to obtain values for time 0 and the final week. These data were used to calculate energy output, fat intake and oxidation, food quotient (FQ), and respiratory quotient (RQ) as described (30,31).
Food intake inhibition
OEA was dissolved in Tween 80 and sterile saline added to 90% (10 mg/ml), sonicated for 1 minute, heated to 55°C, and sonicated again just prior to injection. Male mice age 30 weeks were injected i.p. daily just prior to the start of the dark period with vehicle for 3 days to acclimate to the injection protocol. Food intake was measured at 8 am, 9am, 12pm, 4pm and 8pm. Mice were fasted for 24 hrs on day 3. On day 4, mice were injected i.p. with OEA (50 mg/kg body weight) at 8 am and given food. Food intake was measured at 8 am 9am, 12pm, 4pm and 8pm for the next 24 hrs.
Statistical analysis
Body composition and food intake measurements taken over 7 or 15 weeks were compared by repeated measures ANOVA as indicated (SPSS version 19). For diet switching experiments, the average daily intake during a diet interval was calculated and compared between genotypes by student's t test (Excel). Intake during fasting/refeeding experiments and cumulative intake were compared by student's t test. P < 0.05 was considered significant.
Results
Body composition changes
Mice expressing a dominant negative activin receptor type IIB specifically in skeletal muscle (Muscle-DN mice) were previously shown to have increased muscle mass, reduced fat mass, resistance to diet-induced obesity and improved insulin sensitivity compared to WT littermates (10,32,34). To measure changes in energy intake and body composition over time in WT and Muscle-DN mice, animals were individually housed and fed either chow, HF diet with 59% of calories from fat or the same HF diet plus Ensure® starting at ~9 weeks of age (Figure 1A). Body weight, lean mass and fat mass are shown in Figure 2. On standard chow diet, Muscle-DN mice weighed more than WT mice throughout the time course (Figure 2A). This difference was largely due to higher lean mass with Muscle-DN mice having ~8.3 g more lean mass compared to WT mice (Figure 2B). Both WT and Muscle-DN mice had low fat mass at the youngest age studied, although even then Muscle-DN mice already had significantly less fat mass (Figure 2C; WT, 1.86 g ± 0.42; Muscle-DN, 1.15 g ± 0.36, P < 0.01). However, WT mice gained ~6.4 g of fat during the course of the experiment while Muscle-DN mice gained only ~0.8 g of fat giving Muscle-DN mice ~75% less total fat mass by the end of the 15-week time period.
Body composition of Muscle-DN mice fed chow, HF (59% fat) diet or HF (59% fat) diet plus Ensure®. (A) Body weight (BW), (B) lean mass and (C) fat mass were measured weekly for 15 weeks beginning at ~9 weeks of age. Chow, n = 6-7; HF, n = 5-8 per group; HF + Ensure®, n = 5-6 per group. *P < 0.01; **P < 0.001 between genotypes on the same diet by repeated measures ANOVA.
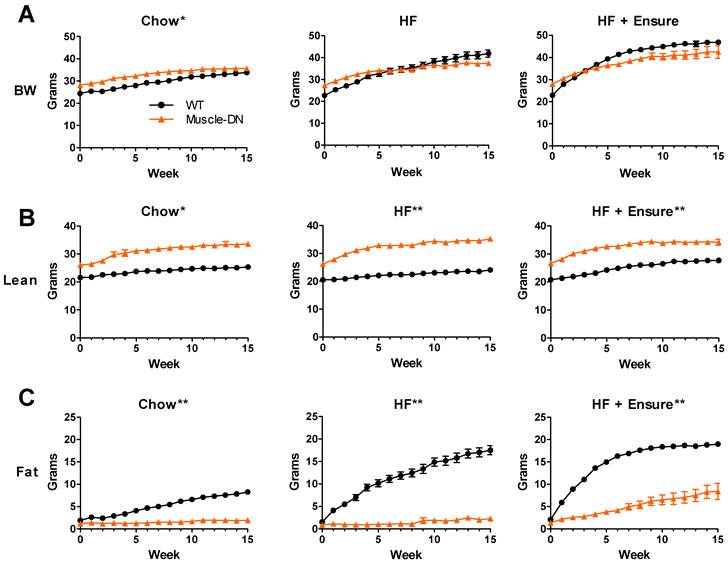
In contrast, when fed a HF diet, WT mice gained much more weight than Muscle-DN mice so that they weighed more than Muscle-DN mice by week 11 (Figure 2A). This weight difference was due to higher fat deposition in WT mice. WT mice gained ~16 g of fat while Muscle-DN mice gained only 1.4 g of fat over 15 weeks of HF feeding (Figure 2C).
Similarly, with HF plus Ensure® diets, WT mice put on fat mass quickly and weighed more than Muscle-DN mice within 5 weeks (Figure 2A and 2C). The amount of fat gained by WT mice, however, leveled off midway through the feeding regimen to a level similar to that of WT mice fed HF diet alone. Muscle-DN mice gained ~7 g of fat mass on the HF plus Ensure® diet, more than on any other diet (Figure 2C). Compared to chow or HF diet, WT mice gained more lean mass on HF plus Ensure® diet (Figure 2B; ~6.9 g compared to 3.7 g on chow and 3.6 g on HF diet). There was relatively little difference in lean mass gain between diets in Muscle-DN mice (Figure 2B; ~7.6 g on chow, 8.9 g on HF diet and 7.5 g on HF plus Ensure® diet). These data confirm previously published results showing that muscular mice have reduced fat mass and are resistant to diet-induced obesity in addition to describing the dynamic changes in body composition on different diets.
Energy intake and output
An increased body weight indicates a positive energy balance that could be explained by differences in either energy intake or output. Food intake was measured directly and calculated to average daily intake by week over the 15 weeks. The body composition and energy intake measurements were used to model energy output. During the 15 weeks, daily average intake was usually slightly higher for Muscle-DN animals on chow (Figure 3A). This difference corresponded to an extra 1.2 kcal/d or 8% (P = 0.013). Intake was also higher in Muscle-DN mice fed HF diet except for the first 3 weeks of HF feeding when both genotypes ate similar amounts (P = 0.024; Figure 3A). HF diet intake tended to decrease over time, particularly in WT mice. On HF plus Ensure® diets, both genotypes showed an initial jump in caloric intake compared to chow or HF diet alone. However, WT mice had a greater boost in caloric intake than Muscle-DN mice, consuming 2.5-3 kcal/d more than Muscle-DN mice in the first 2 weeks (Figure 3A). Overall, there was no significant difference in caloric intake between genotypes when fed HF plus Ensure® diets over the 15 weeks.
Dynamic changes in calculated energy balance of Muscle-DN mice. (A) Energy input and (B) energy output in Muscle-DN mice fed chow, HF (59% fat) diet or HF (59% fat) diet plus Ensure®. Note that energy output is lower than input for WT mice, particularly on HF diets. (C) Energy balance (output subtracted from input). Note that Muscle-DN mice have close to zero energy balance on chow and HF diets, while WT mice have a more positive energy balance than Muscle-DN mice on all diets especially in the first 7 weeks. Average weekly energy intake (from direct measurements) was analyzed by repeated measures ANOVA which showed that Muscle-DN mice consumed greater calories than WT mice on chow (P = 0.013) or HF diet (P = 0.024) but not HF plus Ensure® diets (P = 0.65).
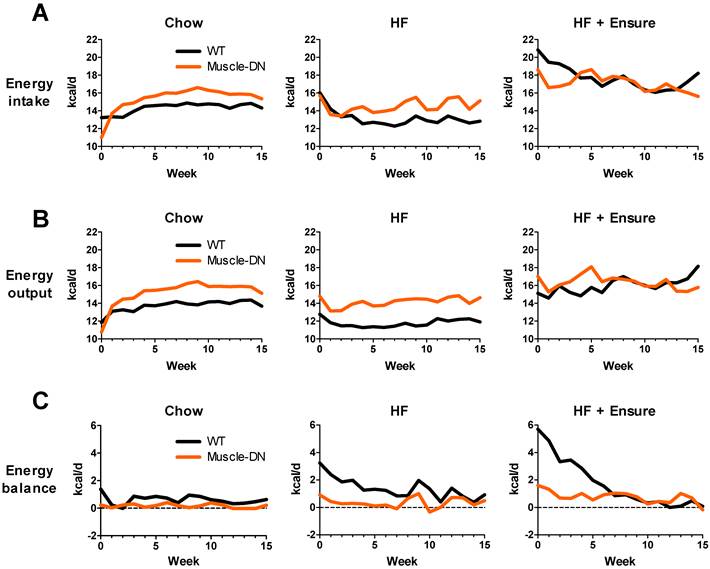
As expected, Muscle-DN mice fed standard chow had higher energy output on average than their WT counterparts most weeks (Figure 3B). This was also true for mice fed a HF diet (Figure 3B). On HF plus Ensure® diets there were more dynamic weekly changes over time, but WT mice slowly increased energy output, unlike Muscle-DN mice (Figure 3B).
The lower weight gain found in Muscle-DN mice compared to WT mice suggests that the muscular mice are in closer energy balance. Energy balance was calculated by subtracting energy output from intake (Figure 3C). Plotted in this way, the WT mice clearly had a more positive energy balance (intake exceeded output) across the time course than the Muscle-DN mice on each diet. On chow, WT mice gained ~6.4 g of fat by consuming ~0.62 kcal/d more than they expended over 15 weeks. Muscle-DN mice, in contrast, had a positive energy balance of ~0.17 kcal/d and thus gained only ~0.8 g fat on average. WT mice fed HF or HF plus Ensure® diets had a strongly positive energy balance in the first few weeks of consuming these palatable diets. This positive energy balance started to decrease immediately in part due to their adaptation to the dietary change by decreasing intake over time (Figure 3A). Additionally, energy balance was also restored to near zero in WT mice fed the HF plus Ensure® diet in part due to increased energy output over time (Figure 3B and 3C), slowing weight gain (Figure 2A). The Muscle-DN mice, however, never got as far out of balance as the WT mice and thus gained less weight, although they were in a more positive energy balance on the HF plus Ensure® diet than when fed chow or HF diet (Figure 3C).
Fat intake and oxidation
An increase in fat accumulation in an individual would suggest that the rate of fat oxidation is lower than the rate of fat intake. Using the body composition and food intake data, we modeled fat oxidation (Figure 4A). The estimated rates of fat oxidation varied greatly between diets as fat intake changed by diet. WT mice had lower rates of fat oxidation than fat intake on chow. On HF and, especially, on HF plus Ensure® diet, WT mice initially had large gaps between the rates of fat intake and oxidation in the first week (~3.3 and 5.3 kcal/d, HF and HF plus Ensure®, respectively). WT mice gradually adapted to the each high calorie diet by raising fat oxidation. This was especially noticeable on HF plus Ensure® diet where the rate of fat oxidation was equal to the rate of fat intake by 10 weeks. At that point, WT mice actually had a higher rate of fat oxidation than Muscle-DN mice on HF plus Ensure® diet. In contrast, Muscle-DN mice do not seem to have an adaptation period and immediately match fat intake and oxidation consistent with their relative lack of fat mass gain on each diet.
Dynamic changes in calculated fat energy utilization of Muscle-DN mice. (A) Fat intake was calculated from the percent energy from fat for each diet and fat oxidation was calculated by the computational model. Note that fat oxidation matches intake more closely for Muscle-DN mice than WT mice. (B) RQ compared to FQ. The FQ shown is the average over the 15-week time course. The FQ for the HF plus Ensure® groups are different between genotypes because of the differences in HF versus Ensure® intake (see Figure 4). RQ > FQ indicates glucose utilization and weight gain.
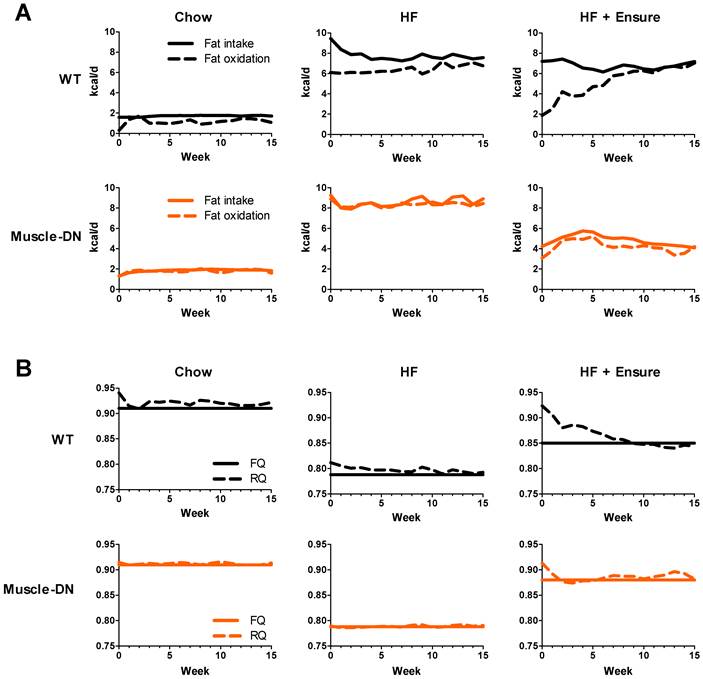
Differences in fat oxidation are also reflected in RQ values. The RQ is defined as the ratio of the volume of CO2 eliminated divided by the volume of O2 consumed by the subject. Because the utilization of O2 and production of CO2 is different for carbohydrate oxidation versus lipid oxidation, the RQ reveals which substrate is preferentially utilized. An RQ of 0.7 means the individual is utilizing lipid but not carbohydrate, for instance. RQ was slightly higher in WT mice compared to Muscle-DN mice on the HF diet (Figure 4B). On HF plus Ensure® diet, RQ was also initially higher in WT mice than in Muscle-DN mice, but it gradually decreased to below that of Muscle-DN mice (Figure 4B). The lower RQ in WT mice after week 5 indicates that they are oxidizing more lipid than Muscle-DN mice consistent with the increase in estimated rate of fat oxidation.
The food quotient (FQ) is defined as the ratio of CO2 eliminated divided by O2 consumed when a given meal is completely oxidized. When RQ = FQ, all carbohydrate and lipid consumed is oxidized and no change in weight would be expected. In contrast, an RQ > FQ indicates that not all the energy is utilized. Mathematical modeling showed that RQ was generally slightly higher than FQ for WT mice fed chow or HF diet but approximately equal for Muscle-DN mice fed the same diets (Figure 4B). On HF plus Ensure® diet, RQ was greater than FQ in WT mice for the first 7 weeks of feeding until declining to match FQ. This is consistent with the adaptation of fat intake and oxidation rates (Figure 4A) and the plateau in weight gain (Figure 2A) seen in WT mice.
Food choice
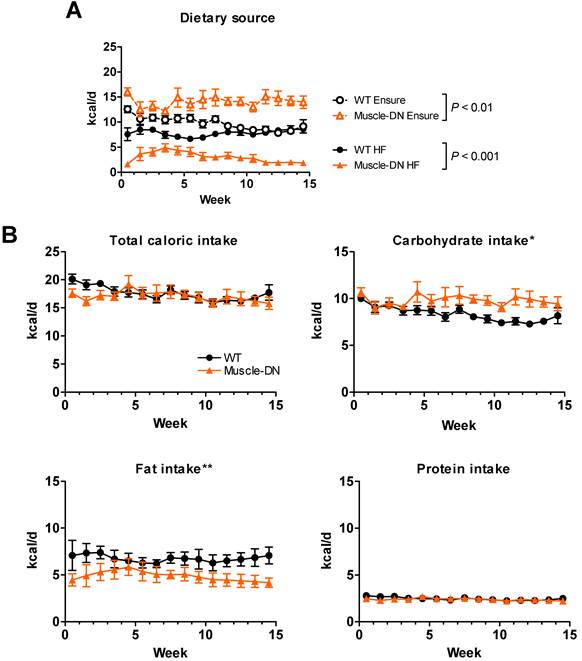
We noticed an unexpected difference in food intake between genotypes on the HF plus Ensure® diet which affected the calculated FQ shown in Figure 4B. Both WT and Muscle-DN mice initially consumed more Ensure® compared to the HF diet based on caloric intake from each source (Figure 5A). However, Muscle-DN drank more of the Ensure® diet and ate less of the HF diet than did WT mice. Eventually, WT mice consumed an equal number of calories from Ensure® as from the HF diet, while Muscle-DN mice maintained a large gap between intake of each dietary source. Although the overall caloric intake was similar between genotypes, this disparity resulted in a significantly higher carbohydrate intake and lower fat intake in Muscle-DN mice compared to WT mice due to the differences in macronutrient composition between the HF and the Ensure® diets (Figure 5B and 4A). This disparity also meant that the FQ for WT mice was different than the FQ for Muscle-DN mice for the HF plus Ensure® diet (Figure 4B). Protein intake was similar because the 60% HF and the Ensure® diets have the same amount of metabolizable energy from protein (Figure 5B).
Nutrient intake of HF plus Ensure® diet in Muscle-DN mice. (A) Raw caloric intake by dietary source, 59% HF diet or Ensure®, from data used for computational modeling of intake shown in Figure 2A. (B) Total, carbohydrate, fat or protein caloric intake from combined HF plus Ensure® diets. Note that although total intake is similar, mutant mice consume relatively more calories from Ensure® and less from HF diet than do WT mice. This causes a difference in carbohydrate and fat intake between genotypes. n = 5-6 per group. Statistical significance by repeated measures ANOVA between genotypes for total HF or Ensure® intake (A) as indicated or for macronutrient intake (B) where *P < 0.05 and **P < 0.01.
The large difference in HF versus Ensure® intake suggests that Muscle-DN mice either have a greater preference for Ensure® than do WT mice, a dislike of the HF diet, or both. To determine Muscle-DN animal food preference, we performed food switching experiments. Mice were given chow diet, then switched to Ensure® and then back to chow (Figure 6A). Daily intake measurements showed that both WT and Muscle-DN mice increased caloric intake when given Ensure® alone, but Muscle-DN mice drank significantly less Ensure® than WT mice [25.9 ± 0.5 vs. 22.9 ± 1.3 kcal/d, WT and Muscle-DN, respectively, P = 0.04]. When mice were switched back to chow, all mice dramatically reduced their overall caloric intake. Following this drop in intake, Muscle-DN mice more rapidly returned to normal intake levels of chow consumption compared to WT mice. These data suggest that Muscle-DN mice fed HF plus Ensure® diets did not consume more Ensure® because they had a stronger preference for it than WT mice.
We also tried switching between HF diets as well as giving mice a choice between chow plus HF or chow plus Ensure® diets. Initially we tried a 45% HF diet for 10 days (Figure 6B). WT mice consumed more HF diet than did Muscle-DN mice over the 10-day period [15.5 ± 0.6 vs. 12.6 ± 0.5 kcal/d, WT and Muscle-DN, respectively, P = 0.004]. When then given both the HF and chow diets at the same time, both genotypes ate very little of the chow, although WT mice ate more than Muscle-DN mice, and consumed most of their calories from the HF diet (Figure 6B and 6C; Chow, 0.77 ± 0.16 vs. 0.17 ± 0.03 kcal/d, P = 0.002; HF diet, 11.2 ± 0.6 vs. 11.2 ± 0.4 kcal/d, P = 0.97, WT and Muscle-DN, respectively). Upon returning to chow only diet, they rapidly dropped their total intake (Figure 6B, day 31). Muscle-DN mice returned to normal levels of chow consumption more quickly than did WT mice, similar to Ensure® and chow switching. After another nearly 3 months of chow feeding to return to normal intake, the mice were given Ensure® plus chow for 2 days (Figure 6B). Again, both preferred Ensure® to chow [Chow, 2.8 ± 1.0 vs. 3.3 ± 1.6 kcal/d, P = 0.8; Ensure, 15.6 ± 2.3 vs. 17.7 ± 1.8 kcal/d, WT and Muscle-DN, respectively, P = 0.5] and dropped their intake upon switching back to chow again (Figure 6B and 6D). After an additional 20 days on chow alone, they were given a HF diet with 59% of metabolizable energy from fat. Both genotypes dramatically increased overall caloric intake the first day of HF feeding (day 148) followed by a gradual decrease in intake in the subsequent days. However, Muscle-DN mice more rapidly dropped HF intake compared to WT mice so that they ate less per day on average (Figure 6B; 17.2 ± 0.5 and 14.3 ± 0.8 kcal/d, WT and Muscle-DN, respectively, P = 0.017). Again, both genotypes ate very little the day after switching back to chow, but Muscle-DN mice more rapidly returned to normal intake compared to WT mice (Figure 6B). These data demonstrate that Muscle-DN mice did not dislike either the 45% or 59% HF diet, although they may not prefer them to the extent that WT mice did. The data also show that WT mice did not dislike Ensure®. Rather, Muscle-DN mice seemed to adjust their caloric intake to normal levels more rapidly on HF or chow diets than did WT mice.
Energy balance and metabolic modeling in MSTN KO mice
To determine whether the differences in energy balance and diet preference were generalizable to other mice with MSTN inhibition, we also tested MSTN KO mice. Female MSTN KO mice and WT littermates were fed chow for 3 weeks, switched to a 60% HF diet for 2 weeks and then back to chow (Figure 1B). The cumulative chow intake of female MSTN KO mice over the first 3 weeks of the diet switch experiment (Figure 7A) was 6.5% more than WT littermates which was not significant, although the average daily intake was barely significant [12.6 ± 0.4 vs. 13.7 ± 0.3 kcal/d, WT and MSTN KO, respectively, P = 0.049]. Food intake increased with HF diet feeding for each genotype although not until the second day, but the average daily HF intake was not significantly different between genotypes (Figure 7A; 15.6 ± 0.6 vs. 14.6 ± 0.5 kcal/d, WT and MSTN KO, respectively, P = 0.2). Like Muscle-DN mice, MSTN KO mice more rapidly restored food intake to normal levels after a sharp decline upon being returned to chow feeding (Figure 7A).
MSTN KO energy intake and computational analysis. (A) Daily caloric intake in KO or WT mice before, during and after switching to 59% HF diet for 14 days (days 22-35). (B) Body weight, lean and fat mass during diet changes. (C) Calculated energy intake, output and balance, and fat intake, oxidation and RQ in WT and MSTN KO mice during diet changes. n = 8-9 per group. Statistical significance between genotypes by student's t test of the daily average intake during an indicated diet interval (A) or by repeated measures ANOVA for body composition measured over time (B); *P < 0.05, **P < 0.01 and **P < 0.001.
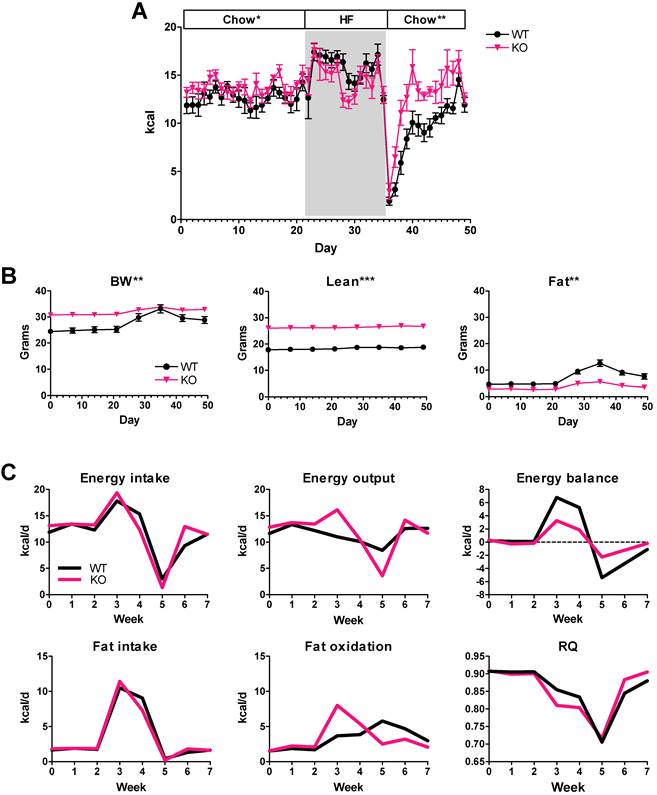
As expected, body composition measurements showed a difference between genotypes in total lean mass as well as fat mass gained (Figure 7B). WT mice increased body weight and fat mass during the 2 weeks of HF diet feeding, but MSTN KO mice showed only small changes in body weight or fat mass. Computational modeling showed that MSTN KO mice had better energy balance than WT mice both during HF feeding and during chow refeeding mainly due to compensating for the changes in intake with greater changes in energy output compared to WT mice (Figure 7C). Fat oxidation also increased more in MSTN KO mice compared to WT mice during the HF feeding and returned to previous levels more quickly when switched back to chow (Figure 7C). Consequently, RQ adjusted more rapidly in MSTN KO mice than in WT mice (Figure 7C). Thus, computational analysis showed that different MSTN-deficient muscular mouse models have similar metabolic responses to HF diet.
Cumulative food intake
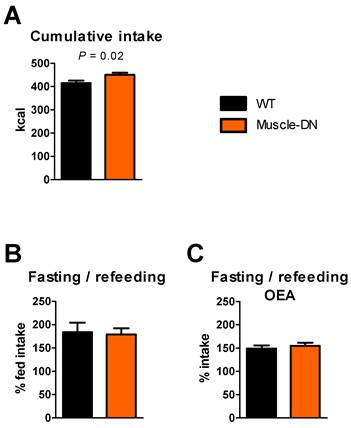
By measuring long-term food intake using chambers, we found a persistent increase in intake in Muscle-DN mice compared to WT mice averaged over 15 weeks (Figure 3A). This suggests that there is a small but real increase in intake in Muscle-DN mice that may not be statistically significant over a one- or two-week period, particularly when food intake is measured in hoppers. To reveal subtle differences in food intake that can be more easily measured than in chambers and in a more typical animal caging environment, we measured total cumulative intake in hoppers using mice that were not used in previous experiments. We found that Muscle-DN mice ate 36 kcal or 8.7% more than WT mice over 4 weeks (Figure 8A). This difference comes out to an extra 1.3 kcal/d above WT intake, consistent with that of our 15-week time course. These cumulative intake measurements confirm that there is a small elevation in food intake in Muscle-DN mice.
Energy intake differences in Muscle-DN mice fed chow. (A) Cumulative caloric intake over 4 weeks. (B) 24-hr caloric refeeding intake after a 24-hr fast as a percent of normal 24-intake. (C) 24-hr caloric intake as a percent of normal intake after a 24-hr fast and OEA injection. A and B, n = 10-11 per group; C, n = 6 per group. Statistical significance by student's t test is indicated.
Sensitivity to food intake signals
We also tried a 24-hr fasting/refeeding experiment to see if hunger signals were different in mutants compared to WT animals. However, there was no difference in 24-hr intake after a fast between Muscle-DN and WT mice relative to prior intake (Figure 8B).
The more rapid normalization of caloric intake found in Muscle-DN mice after the onset of HF feeding or restoration of chow feeding suggests that these mice might be more sensitive to lipid satiety signals than WT mice. A lipid-derived signaling mediator, oleoylethanolamide (OEA) is produced in the intestine following meal absorption (35,36) and functions to inhibit food intake by binding to PPARα (37). To see if Muscle-DN mice were more sensitive to OEA, we injected OEA i.p. and measured subsequent food intake after a 24-hr fast. Both genotypes treated with OEA increased food intake in the 24 hr post-fasting compared to the 24 hr period before the fast but to a lesser extent than mice without OEA treatment. However, there was no statistically significant difference in the percent of normal food intake between WT animals and Muscle-DN animals (Figure 8C).
Discussion
The lack of weight gain found in numerous studies of MSTN KO mice has been attributed to increased energy expenditure or fatty acid oxidation compared to WT mice despite similar food intake (38,39). The modeling presented here confirms an expected increase in energy expenditure in muscular mice compared to WT mice but not the previous reports of identical energy intake (9,10,34,39). Furthermore, our data show that muscular mice are not lean simply because of higher energy expenditure. It is more accurate to say that Muscle-DN or MSTN KO mice match their energy output to their energy intake better than WT mice to maintain energy balance closer to zero. In fact, even though Muscle-DN mice did not gain weight on the HF diet, energy output did not increase compared to when they were on the chow diet although on both diets, it is greater than that of WT mice (see Figure 3B). Instead, Muscle-DN mice adjust their food intake and output more quickly and have a greater increase in fat oxidation than WT mice when fed a HF diet as compared to a chow diet (see Figure 4A). Thus, they do not gain as much weight.
These data in muscular mice also confirm that a small positive energy balance (~1 kcal/day) leads eventually to noticeable weight gain as modeled previously in WT mice (30). The modeling also shows that RQ matches FQ well in Muscle-DN mice fed chow or HF diet as expected for animals with stable weight and body composition (40). The RQ and the FQ were slightly mismatched on Muscle-DN mice fed HFD plus Ensure®, however, and it was on this diet that the mutants gained the most fat mass. Fat oxidation was much higher in both genotypes fed the HF diet compared to chow diet (Figure 4A). Upon moving from standard chow to HF diet, carbohydrate intake decreased dramatically due to the differences in diet composition (27% compared to 64% kcal/g energy from carbohydrate, chow vs. HF diet, respectively). Consequently, a large portion of the energy expenditure in mice fed the HF diet must be provided from fat oxidation. On the other hand, when the mice were given the HF plus Ensure® diet, most of their calories in the first few weeks for WT and the entire 15 weeks for Muscle-DN mice came from the Ensure® (Figure 5A). The contribution of carbohydrate oxidation from food intake to energy expenditure remained relatively unchanged compared to the chow diet because chow and Ensure® each have 64% energy from carbohydrate. This caused the increased energy from fat intake to be stored in the body. Consequently, in the HF plus Ensure® mice, we observed a gradual increase in fat oxidation, particularly in WT mice, and a rapid increase in body weight compared to the HF-fed mice. Coincidentally, the difference between the rates of fat intake and oxidation and the degree of positive energy balance in Muscle-DN mice fed HF plus Ensure® are similar to that of WT mice fed chow (compare Figure 3C, WT on Chow with Muscle-DN on HF + Ensure® and compare Figure 4A, WT on Chow with Muscle-DN on HF + Ensure® panels). In both cases, the mice gained similar amounts of fat mass (Figure 2C), which is evidence for the validity of the computational model.
There are several advantages of the computational modeling approach. It does not require indirect calorimetry apparatus, although it does require body composition equipment. Modeling also can be done for an extended period of time rather than over days as is typical for indirect calorimetry experiments. The indirect calorimetry protocol commonly used in mouse metabolic studies, while being a very convenient mode to measure energy intake and expenditure, has additional caveats. Normally, daily intake often does not match daily energy expenditure. Instead energy balance is achieved by adjusting input and expenditure over many days (reviewed in (20,21)). In other words, it is possible for the animal to be in energy balance over weeks but not in balance in any given shorter time period. Moreover, mice often gain less weight or even lose weight when placed in the indirect calorimeter apparatus most likely due to the stress of the change in environment. Thus, animals housed in indirect calorimetry chambers often have a skewed energy balance, thereby confounding results. By taking measurements over a period of weeks to months, natural perturbations are less likely to lead to false conclusions, but small persistent differences in energy intake and output may be revealed. Another advantage of our computational methodology is that although energy expenditure is determined by numerous interplayed factors, our model takes account of those factors in a simple implicit way. Measured energy intake is used as one model input which precludes the consideration of many factors like energy density, texture, taste, and smell of the food that may affect intake. Similarly, at a given level of energy intake, palatable high protein food may have a higher thermogenic effect and result in less energy deposited in the body (less weight gain). Such an effect is accounted for by the other inputs in the model, which are the measured changes in body composition and body weight. The main disadvantages are the need for frequent food weight measurements, long-term cage space requirements, and the lack of data concerning differences in intake and output by circadian rhythm.
One implication from our data is that metabolic measurements may be influenced by the age of mice used for comparisons between WT and mice with MSTN inhibition or other muscular mutants. For instance, the fat mass at ~9 weeks of age averaged 1.86 g for WT mice and 1.15 g for Muscle-DN mice. By the end of the experiment, when mice were ~24 weeks of age, fat mass averaged 8.25 g for WT mice and 1.94 g for Muscle-DN mice. These dynamic changes in body composition with aging prompt caution in data interpretation with muscular mouse models because metabolic differences detected in older animals may be effects of the differences in fat mass rather than of increased muscle mass or changes in muscle signaling pathways.
The most unexpected finding was the difference in diet preference revealed by the feeding of HF plus Ensure® diet. Although Muscle-DN mice drank relatively more Ensure® than did WT mice when given both diets simultaneously, they did not seem to have a stronger preference when given Ensure® alone in the diet switch experiment. There are many differences between the diets, such as energy density, texture, taste, smell, and behavior required to access the diet that could affect intake (41,42). No conclusion can be drawn about why these differences in intake occurred. However, it is tempting to speculate that the Muscle-DN mice preferred the 64% carbohydrate Ensure® over the 60% fat diet because of different metabolic needs due to the increase in glycolytic muscle. Macronutrients themselves can affect dietary preference. For instance, mice prefer solutions containing glucose even if they cannot distinguish alternatives by taste, an effect that is mediated by glucose oxidation and dopamine release (43,44). Lipid ingestion has the opposite effect in that HF feeding produces lipid metabolites in the gut that inhibit further intake (35,45-47). Along these lines, our daily intake data revealed that Muscle-DN mice became satiated with either 45% or 60% HF diet more quickly than WT mice and returned to normal caloric intake faster when switched back to chow. We have not established a mechanism for this effect. Although they are not more sensitive to exogenous administration of the fat intake inhibitor OEA, this does not rule out increased endogenous OEA production in response to HF diet or an effect by other lipid mediators of satiety. We have previously shown that hyperphagic mice with lipodystrophy have normal food intake when crossed to Muscle-DN or MSTN KO mice (34). Taken together, these data suggest that the MSTN pathway in muscle or muscularity itself may regulate food intake and possibly even macronutrient selection, although perhaps indirectly. A direct hormonal or paracrine effect of MSTN signaling on these functions is unlikely. The dominant negative activin receptor type IIB that is overexpressed in muscle in the Muscle-DN mice contains the transmembrane domain, and these mice still secrete MSTN. The similarity between MSTN KO and Muscle-DN mice compared with WT mice in energy balance and normalization of intake after diet switching therefore suggests that the circulating MSTN is not directly causing these differences in phenotypes.
In summary, we have shown that computational modeling predicts that muscular mice are in energy balance regardless of diet due to better adjustment of energy intake, fat oxidation and energy output compared to WT mice. We hypothesize that this will also be true of other muscular mice such as those overexpressing insulin-like growth factor 1 (48,49). It will be interesting to use this computational method to compare the energy dynamics of muscular mice with highly glycolytic muscle to mice that have more oxidative muscle, high running endurance and resistance to diet-induced obesity such as the peroxisome proliferator-activated receptor-δ overexpressors (50). Our data also raise the possibility that different metabolic needs of muscle might regulate macronutrient preference. This hypothesis needs to be tested by a comparison of consumption of lipids, carbohydrates or amino acids given in the comparable matrices such as dissolved in drinking water.
Abbreviations
EE: energy expenditure; DN: dominant negative; FFM: fat-free mass; FQ: food quotient; HF: high-fat; MSTN: myostatin; OEA: oleoylethanolamide; RQ: respiratory quotient; T2DM: type 2 diabetes mellitus
Acknowledgements
We thank Jennifer Portas for genotyping mice. This work is supported by the Intramural Research Program of the NIH, NIDDK.
Funding by the Intramural Research Program of the NIH, NIDDK.
Competing Interests
Under a licensing agreement between Pfizer and the Johns Hopkins University, A.C.M. is entitled to a share of royalty received by the University on sales of the factor described in this paper. The terms of these arrangements are being managed by the University in accordance with its conflict of interest policies. All other authors have no competing interests.
References
1. Shaw JE, Sicree RA, Zimmet PZ. Global estimates of the prevalence of diabetes for 2010 and 2030. Diabetes Res Clin Pract. 2010;87(1):4-14
2. DeFronzo RA, Tripathy D. Skeletal muscle insulin resistance is the primary defect in type 2 diabetes. Diabetes Care. 2009;32(Suppl 2):S157-63
3. Alberti KG, Eckel RH, Grundy SM. et al. Harmonizing the metabolic syndrome: a joint interim statement of the International Diabetes Federation Task Force on Epidemiology and Prevention; National Heart, Lung, and Blood Institute; American Heart Association; World Heart Federation; International Atherosclerosis Society; and International Association for the Study of Obesity. Circulation. 2009;120(16):1640-5
4. Atlantis E, Martin SA, Haren MT. et al. Inverse associations between muscle mass, strength, and the metabolic syndrome. Metabolism. 2009;58(7):1013-22
5. Park BS, Yoon JS. Relative skeletal muscle mass is associated with development of metabolic syndrome. Diabetes Metab J. 2013;37(6):458-64
6. Srikanthan P, Karlamangla AS. Relative muscle mass is inversely associated with insulin resistance and prediabetes. Findings from the third National Health and Nutrition Examination Survey. J Clin Endocrinol Metab. 2011;96(9):2898-903
7. Srikanthan P, Hevener AL, Karlamangla AS. Sarcopenia exacerbates obesity-associated insulin resistance and dysglycemia: Findings from the National Health and Nutrition Examination Survey III. PLoS ONE. 2010;5(5):e10805
8. Srikanthan P, Karlamangla AS. Muscle mass index as a predictor of longevity in older-adults. Am J Med. 2014;127(6):547-53
9. McPherron AC, Lee SJ. Suppression of body fat accumulation in myostatin-deficient mice. J Clin Invest. 2002;109(5):595-601
10. Guo T, Jou W, Chanturiya T. et al. Myostatin inhibition in muscle, but not adipose tissue, decreases fat mass and improves insulin sensitivity. PLoS ONE. 2009;4(3):e4937
11. Lin J, Arnold HB, Della-Fera MA. et al. Myostatin knockout in mice increases myogenesis and decreases adipogenesis. Biochem Biophys Res Commun. 2002;291(3):701-6
12. Izumiya Y, Hopkins T, Morris C. et al. Fast/Glycolytic muscle fiber growth reduces fat mass and improves metabolic parameters in obese mice. Cell Metab. 2008;7(2):159-72
13. Hamrick MW, Pennington C, Webb CN, Isales CM. Resistance to body fat gain in “double-muscled” mice fed a high-fat diet. Int J Obes. 2006;30:868-70
14. Leong GM, Kee AJ, Millard SM. et al. The Ski proto-oncogene regulates body composition and suppresses lipogenesis. Int J Obes. 2010;34(3):524-36
15. Elia M. The inter-organ flux of substrates in fed and fasted man, as indicated by arterio-venous balance studies. Nutr Res Rev. 1991;4(01):3-31
16. Cunningham JJ. Body composition as a determinant of energy expenditure: a synthetic review and a proposed general prediction equation. Am J Clin Nutr. 1991;54(6):963-9
17. Zurlo F, Larson K, Bogardus C, Ravussin E. Skeletal muscle metabolism is a major determinant of resting energy expenditure. J Clin Invest. 1990;86(5):1423-7
18. Weyer C, Snitker S, Rising R. et al. Determinants of energy expenditure and fuel utilization in man: effects of body composition, age, sex, ethnicity and glucose tolerance in 916 subjects. Int J Obes Relat Metab Disord J Int Assoc Study Obes. 1999;23(7):715-22
19. Butler AA, Kozak LP. A recurring problem with the analysis of energy expenditure in genetic models expressing lean and obese phenotypes. Diabetes. 2010;59(2):323-9
20. Arch JRS, Hislop D, Wang SJY, Speakman JR. Some mathematical and technical issues in the measurement and interpretation of open-circuit indirect calorimetry in small animals. Int J Obes. 2006;30(9):1322-31
21. Even PC, Nadkarni NA. Invited Review: Indirect calorimetry in laboratory mice and rats: principles, practical considerations, interpretation and perspectives. Am J Physiol - Regul Integr Comp Physiol. 2012;303(5):R549-76
22. Heymsfield SB, Thomas D, Bosy-Westphal A. et al. Evolving concepts on adjusting human resting energy expenditure measurements for body size. Obes Rev. 2012;13(11):1001-14
23. Mitchell SE, Tang Z, Kerbois C. et al. The effects of graded levels of calorie restriction: I. impact of short term calorie and protein restriction on body composition in the C57BL/6 mouse. Oncotarget. 2015;6(18):15902-30
24. Müller MJ, Wang Z, Heymsfield SB. et al. Advances in the understanding of specific metabolic rates of major organs and tissues in humans. Curr Opin Clin Nutr Metab Care. 2013;16(5):501-8
25. McPherron AC, Lawler AM, Lee S-J. Regulation of skeletal muscle mass in mice by a new TGF-B superfamily member. Nature. 1997;387(6628):83-90
26. Longo KA, Charoenthongtrakul S, Giuliana DJ. et al. The 24-hour respiratory quotient predicts energy intake and changes in body mass. Am J Physiol - Regul Integr Comp Physiol. 2010;298(3):R747-54
27. Kaiyala KJ, Morton GJ, Leroux BG. et al. Identification of body fat mass as a major determinant of metabolic rate in mice. Diabetes. 2010;59(7):1657-66
28. Guo J, Hall KD. Challenges of indirect calorimetry in mice. Am J Physiol - Regul Integr Comp Physiol. 2011;300(3):R780-R780
29. Tschöp MH, Speakman JR, Arch JRS. et al. A guide to analysis of mouse energy metabolism. Nat Methods. 2012;9(1):57-63
30. Guo J, Hall KD. Predicting changes of body weight, body fat, energy expenditure and metabolic fuel selection in C57BL/6 mice. PloS One. 2011;6(1):e15961
31. Guo J, Hall KD. Estimating the Continuous-Time Dynamics of Energy and Fat Metabolism in Mice. PLoS Comput Biol. 2009;5(9):e1000511
32. Lee S-J, McPherron AC. Regulation of myostatin activity and muscle growth. Proc Natl Acad Sci. 2001;98(16):9306-11
33. McPherron AC, Huynh TV, Lee S-J. Redundancy of myostatin and growth/differentiation factor 11 function. BMC Dev Biol. 2009;9(1):24
34. Guo T, Bond ND, Jou W. et al. Myostatin inhibition prevents diabetes and hyperphagia in a mouse model of lipodystrophy. Diabetes. 2012;61(10):2414-23
35. Rodríguez de Fonseca F, Navarro M. et al. An anorexic lipid mediator regulated by feeding. Nature. 2001;414(6860):209-12
36. Fu J, Astarita G, Gaetani S. et al. Food intake regulates oleoylethanolamide formation and degradation in the proximal small intestine. J Biol Chem. 2007;282(2):1518-28
37. Fu J, Gaetani S, Oveisi F. et al. Oleylethanolamide regulates feeding and body weight through activation of the nuclear receptor PPAR-alpha. Nature. 2003;425(6953):90-3
38. Zhang C, McFarlane C, Lokireddy S. et al. Inhibition of myostatin protects against diet-induced obesity by enhancing fatty acid oxidation and promoting a brown adipose phenotype in mice. Diabetologia. 2012;55(1):183-93
39. Choi SJ, Yablonka-Reuveni Z, Kaiyala KJ. et al. Increased energy expenditure and leptin sensitivity account for low fat mass in myostatin-deficient mice. Am J Physiol Endocrinol Metab. 2011;300(6):E1031-7
40. Flatt JP. Importance of nutrient balance in body weight regulation. Diabetes Metab Rev. 1988;4(6):571-81
41. LeBlanc J, Diamond P, Nadeau A. Thermogenic and hormonal responses to palatable protein and carbohydrate rich food. Horm Metab Res Horm Stoffwechselforschung Horm Métabolisme. 1991;23(7):336-40
42. Prentice AM, Jebb SA. Fast foods, energy density and obesity: a possible mechanistic link. Obes Rev. 2003;4(4):187-94
43. Ren X, Ferreira JG, Zhou L. et al. Nutrient selection in the absence of taste receptor signaling. J Neurosci Off J Soc Neurosci. 2010;30(23):8012-23
44. Tellez LA, Ren X, Han W. et al. Glucose utilization rates regulate intake levels of artificial sweeteners. J Physiol. 2013;591(Pt 22):5727-44
45. Gillum MP, Zhang D, Zhang XM. et al. N-acylphosphatidylethanolamine, a gut- derived circulating factor induced by fat ingestion, inhibits food intake. Cell. 2008;135(5):813-24
46. Greenberg D, Smith GP, Gibbs J. Intraduodenal infusions of fats elicit satiety in sham-feeding rats. Am J Physiol. 1990;259(1 Pt 2):R110-8
47. Schwartz GJ. Gut fat sensing in the negative feedback control of energy balance-recent advances. Physiol Behav. 2011;104(4):621-3
48. Coleman ME, DeMayo F, Yin KD. et al. Myogenic vector expression of insulin-like growth factor I stimulates muscle cell differentiation and myofiber hypertrophy in transgenic mice. J Biol Chem. 1995;270:12109-16
49. Musaró A, McCullagh K, Paul A. et al. Localized Igf-1 transgene expression sustains hypertrophy and regeneration in senescent skeletal muscle. Nat Genet. 2001;27(2):195-200
50. Wang YX, Zhang CL, Yu RT. et al. Regulation of muscle fiber type and running endurance by PPARdelta. PLoS Biol. 2004;2(10):e294
Author contact
![]() Corresponding author: Alexandra C. McPherron, National Institute of Diabetes and Digestive and Kidney Diseases, National Institutes of Health Bldg. 10, Rm. 9D11, 9000 Rockville Pike, Bethesda, Maryland 20892 USA. Phone: 301-451-9250; Fax: 301-402-4136; E-mail: mcpherronanih.gov.
Corresponding author: Alexandra C. McPherron, National Institute of Diabetes and Digestive and Kidney Diseases, National Institutes of Health Bldg. 10, Rm. 9D11, 9000 Rockville Pike, Bethesda, Maryland 20892 USA. Phone: 301-451-9250; Fax: 301-402-4136; E-mail: mcpherronanih.gov.