Impact Factor ISSN: 1449-2288
- Issue 9; 2026
- Issue 8; 2026
- Issue 7; 2026
- Issue 6; 2026
- Issue 5; 2026
- Volume 22; 2026
- Past Issues
- Advance Articles
- Editorial Board
- Cover Images
- Index & Coverage
- Cover Suggestion
- Special Issues
Introduction
Materials and Methods
Results and Discussion
Supplementary Material
Acknowledgements
References

 Global reach, higher impact
Int J Biol Sci 2018; 14(12):1669-1677. doi:10.7150/ijbs.27819 This issue Cite
Research Paper
BERMP: a cross-species classifier for predicting m6A sites by integrating a deep learning algorithm and a random forest approach
Yu Huang1,#, Ningning He2,#, Yu Chen1, Zhen Chen2, ![]() , Lei Li1,2,3,4,
, Lei Li1,2,3,4, ![]()
1. School of Data Science and Software Engineering, Qingdao University, 266021, Qingdao, China
2. School of Basic Medicine, Qingdao University, 266021, Qingdao, China
3. Cancer institute, the Affiliated Hospital of Qingdao University, Qingdao, Shandong, 266061, China
4. Qingdao Cancer Institute, Qingdao, Shandong 266061, China
# Contributed equally.
Received 2018-6-11; Accepted 2018-8-14; Published 2018-9-7
Abstract

N6-methyladenosine (m6A) is a prevalent RNA methylation modification involved in several biological processes. Hundreds or thousands of m6A sites identified from different species using high-throughput experiments provides a rich resource to construct in-silico approaches for identifying m6A sites. The existing m6A predictors are developed using conventional machine-learning (ML) algorithms and most are species-centric. In this paper, we develop a novel cross-species deep-learning classifier based on bidirectional Gated Recurrent Unit (BGRU) for the prediction of m6A sites. In comparison with conventional ML approaches, BGRU achieves outstanding performance for the Mammalia dataset that contains over fifty thousand m6A sites but inferior for the Saccharomyces cerevisiae dataset that covers around a thousand positives. The accuracy of BGRU is sensitive to the data size and the sensitivity is compensated by the integration of a random forest classifier with a novel encoding of enhanced nucleic acid content. The integrated approach dubbed as BGRU-based Ensemble RNA Methylation site Predictor (BERMP) has competitive performance in both cross-validation test and independent test. BERMP also outperforms existing m6A predictors for different species. Therefore, BERMP is a novel multi-species tool for identifying m6A sites with high confidence. This classifier is freely available at
Keywords: Deep learning, Recurrent neural network, bidirectional Gated Recurrent Unit, N6-methyladenosine, Random forest
Introduction
N6-methyladenosine (m6A), the methylation modification on the nitrogen at the sixth position of the adenosine base, is abundant post-transcriptional modification and found from bacteria to Homo sapiens [1, 2]. Recent studies have indicated that m6A is involved in numerous biological processes, e.g. protein translation and localization [3], mRNA splicing and stability [4]. As m6A is non-randomly distributed in the genome [5], the identification of m6A sites on a large scale from transcriptome allows for the understanding their biological functions.
The methylated RNA immunoprecipitation sequencing techniques such as MeRIP-seq or m6A-seq [6, 7] have been developed for the identification of m6A sites on a genome-wide scale from several species, i.e. Saccharomyces cerevisiae [5], Arabidopsis thaliana [8], Mus musculus [9], and Homo sapiens [9]. It is reported that m6A peaks from both Mus musculus and Homo sapiens have a consensus motif DRACH (where D = A, G or U; R = A or G; H = A, C or U) [9], whereas those from Saccharomyces cerevisiae have the motif RGAC [5] and those from Arabidopsis thaliana have RRACH [10]. Although these motifs are different, they share the pattern GAC, suggesting evolutionary conservation of m6A-containing sequences. The experimental approaches have made outstanding contributions to systematic analysis of m6A modification, but they are costly and time-consuming. It is necessary to develop computational approach for predicting m6A sites.
A few predictors have been developed to identify m6A sites based on high-resolution experimental data (See Table S1 for summary of the methods). They are based on two conventional machine-learning (ML) algorithms, i.e. Support Vector Machine (SVM) and Random Forest (RF), with different combinations of three types of features that are physical-chemical, sequential and structural features. Most of the predictors are species-centric (e.g. Arabidopsis thaliana, Saccharomyces cerevisiae and mammals), whereas only the approach RAM-NPPS covers all the species. As the numbers of experimentally identified m6A sites from different species range widely (e.g. about 1,000 sites for Saccharomyces cerevisiae, 2,500 sites for Arabidopsis thaliana, and over 50,000 sites for Mammalia), it seems difficult to develop a cross-species predictor with high accuracy. Indeed, in comparison with species-specific classifiers, RAM-NPPS has better performance for the species with a small amount of identified m6A sites (e.g. Saccharomyces cerevisiae) but seems unsatisfactory for mammals with enormous m6A sites [11].
In addition to traditional ML methods, deep learning (DL) has become a popular and powerful tool because it provides multiple-layer networks and non-linear mapping operations to detect potential complex patterns in a data-driven manner. DL approaches have demonstrated superior performances to ML methods for the solution of several prediction problems, such as RNA splicing [12], protein structure [13], and protein modification [14]. However DL has not been applied to the prediction of m6A sites. In this study, we constructed and compared two DL classifiers for the multi-species prediction of m6A sites: one based on a unidirectional Gated Recurrent Unit (UGRU) with a word embedding approach and the other based on a bidirectional GRU (BGRU). BGRU outperformed UGRU for both cross-validation and independent test datasets across the species. In comparison with the conventional ML classifiers, the DL classifiers were superior for the species with the large training datasets but inferior for the species with the small datasets. To compensate for the poor efficiency of DL classifiers for small datasets, we developed a BGRU-based Ensemble RNA Methylation site Predictor (BERMP) by integrating BGRU and a Random Forest classifier with a novel encoding of enhanced nucleic acid content (ENAC). BERMP performed better than individual components and the classifiers using other feature encodings. Additionally, BERMP compared favorably to existing m6A prediction approaches for different species. Overall, BERMP is a novel multi-species tool for identifying m6A sites with high confidence.
Materials and Methods
Dataset construction
Two prediction modes were constructed in this study: full transcript mode and mature mRNA mode [15]. The former uses the whole DNA sequences as its input while the later uses the mature mRNA sequences. The two modes were employed for mammalian datasets, whereas the mRNA mode only was used for the datasets of Saccharomyces cerevisiae and Arabidopsis thaliana.
Figure S1 shows dataset flowcharts for three species. All the datasets are derived from previous publications. Generally, we separated the dataset into five groups of which four were used for training and the rest was employed for independent test. Specifically, for Mammalian datasets [15], we randomly selected four-fifths of the total samples for training and the remaining one-fifth for independent testing (Figure S1A). For Saccharomyces cerevisiae datasets [16], we randomly selected 2200 samples for training, and the remaining 414 for independent testing (Figure S1B). For Arabidopsis thaliana datasets [17], the 4200 samples were randomly selected for training, and the remaining 836 for independent testing (Figure S1C). Each training set was further used for five-fold or ten-fold cross validation (Figure S1). For instance, the training set of 2200 samples from Saccharomyces cerevisiae were divided into 10 groups, of which nine (1980) were used for training and the rest (220) was used for validation. The data processing flows for Arabidopsis thaliana and Mammalia excerpted from the previous studies (Figure S1A&C) [15, 17]. The cross-validation and independent test datasets are available at http://www.bioinfogo.org/bermp/download.php.
Feature encodings
M6A/non-m6A containing sequence fragments with certain length, where the m6A/non-m6A sites was located in the center, were extracted from DNA or mRNA sequences. If the m6A/non-m6A sites appeared at one terminal of the sequence, the gap symbol '-' was added accordingly to the corresponding positions to ensure that the sequence length was same for all the fragments. The encoding schemes were described below.
Enhanced Nucleic Acid Composition (ENAC) encoding
Nucleic Acid Composition (NAC) reflects the frequency of the four types of nucleotides (i.e. A, G, C, U/T) surrounding the m6A sites in the sequence fragments with the window size W. Based on the NAC encoding, we designed an ENAC encoding scheme in which the frequency of the nucleic acids was calculated in the window continuously sliding from the N- to C-terminal of each RNA fragment in the dataset. Given the size of sliding window S, a Wnt window corresponds to (W-S+1) sliding windows and its feature vector dimension of the ENAC encoding is (W-S+1)*4 (Figure S2). We searched for the optimized W and S values through the grid search approach. The value of W ranged from 51 to 101 with an interval of 10 and the value of S ranged from 1 to 14 with an interval of 2. The optimized W and S values corresponded to the best performance based on five-fold or ten-fold cross-validation, which was listed in Table S2, S3, S4, S5.
Construction of ENAC-encoding RF classifier
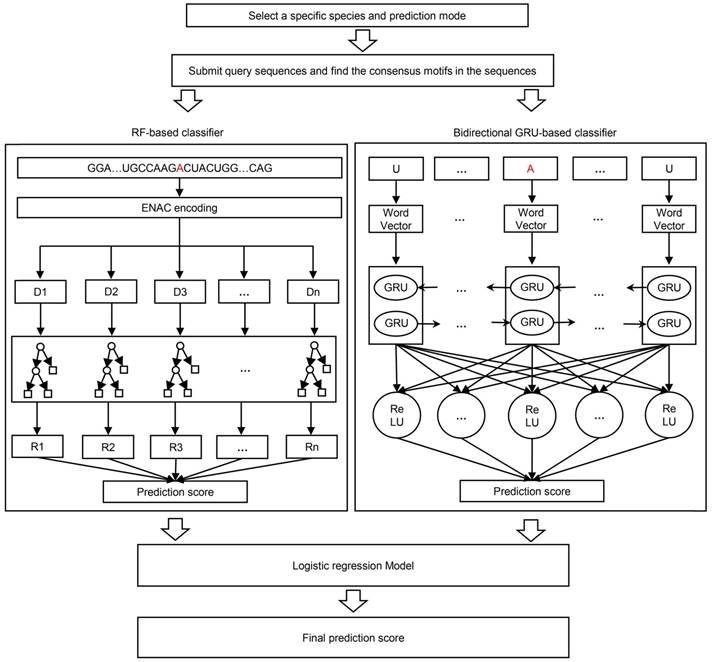
The RF algorithm, as a traditional ML methodology, is widely used in a variety of bioinformatics studies with effective performance. It integrates multiple decision trees and chooses the classification with the most votes from the trees. Each tree depends on the values of a random vector sampled independently with the same distribution for all trees in the forest. The framework of the ENAC-based RF classifier was shown in Figure 1, where the number of trees was set 300. This classifier was developed based on the Python module “sklearn”.
The framework of BERMP. BERMP covered three species (i.e. Mammalia, Saccharomyces cerevisiae, Arabidopsis thaliana) with two prediction modes (i.e. full transcript mode and mature mRNA mode). After the selection of a specific species and mode, the query sequences, the query sequences were analyzed and consensus motifs were extracted with flanking nucleic acids and submitted to the random forest (RF) based classifier with ENAC encoding (left) and the bidirectional GRU-based deep learning classifier with word embedding (right). The prediction scores from both classifiers were integrated through logistical regression approach and finally the final prediction score were outputted.
Two GRU-based DL classifiers
Both the unidirectional GRU (UGRU)-based classifier and the bidirectional GRU (BGRU)-based DL classifier included five layers (Figure 1), which were detailed as follows:
(i) Input layer: A sequence of nucleotides with the optimized size (Table S6) were inputted as categorical features.
(ii) Embedding layer: each nucleotide (including '-') was converted to a three-dimensional word vector for the representation of nucleotide properties according to its relative position in the sequence.
(iii) Recurrent layer: It included a bidirectional GRU block for the BGRU-based classifier that contained two GRUs each of which had 64 units, whereas it covered a unidirectional GRU block that had 64 units for the UGRU-based classifier.
(iv) Fully connected layer: 64 neuron units were established in which the rectified linear unit (ReLU) was chosen as its activation function.
(v) Output layer: One neuron unit activated using the “sigmoid” function outputted the possibility of the m6A modification. The sequence was predicted as positive if the possibility was larger than a specified threshold.
During the network training, the Adam [18] algorithm was employed to optimize the categorical cross entropy loss function. The dropout [19] rate of neurons was 20% between different layers to prevent overfitting. Meanwhile, the batch size was 1024 to guarantee a high rate of convergence. The total training process contained 1000 epochs to ensure that the loss function value was converged. The entire model was implemented by Tensorflow [20].
Integration of the classifiers
The outputs of the individual classifiers were integrated to calculate the prediction score S of BERMP through the following logistic regression approach:
(1)
The weight wi of each classifier output Ci and the bias b were obtained using the regression process, with the final score S denoting the confidence level of the central adenosine to be methylated. The weight wi and bias b were trained and tested in a ten-fold cross-validation using the prediction outputs from the bidirectional GRU (BGRU)-based DL classifier and the ENAC-based RF classifier. The logistic model was based on the 'glm' function in the R package (http://www.r-project.org/).
Performance assessment of the predictors
The performance of each predictor was assessed through both cross-validation and independent tests. We used Sensitivity (Sn), Specificity (Sp), Accuracy (Ac) and Matthews Correlation Coefficient (MCC) to measure the predictor's performance at certain thresholds. They are defined as:
(2)
(3)
(4)
(5)
Where TP, FP, TN and FN each represent the true positive, false positive, false negative and true negative predictions, respectively. We also plotted the receiver-operating-characteristic (ROC) curves for the predictors and calculated the area under ROC curve (AUC) to evaluate the overall performance of the predictors. The area under ROC curve with <10% false positive rate (AUC01) was considered because it reflects the performance of the predictor in a low false positive rate, which is significant in practical application.
Results and Discussion
The ENAC encoding performed best in the comparison of different feature encodings
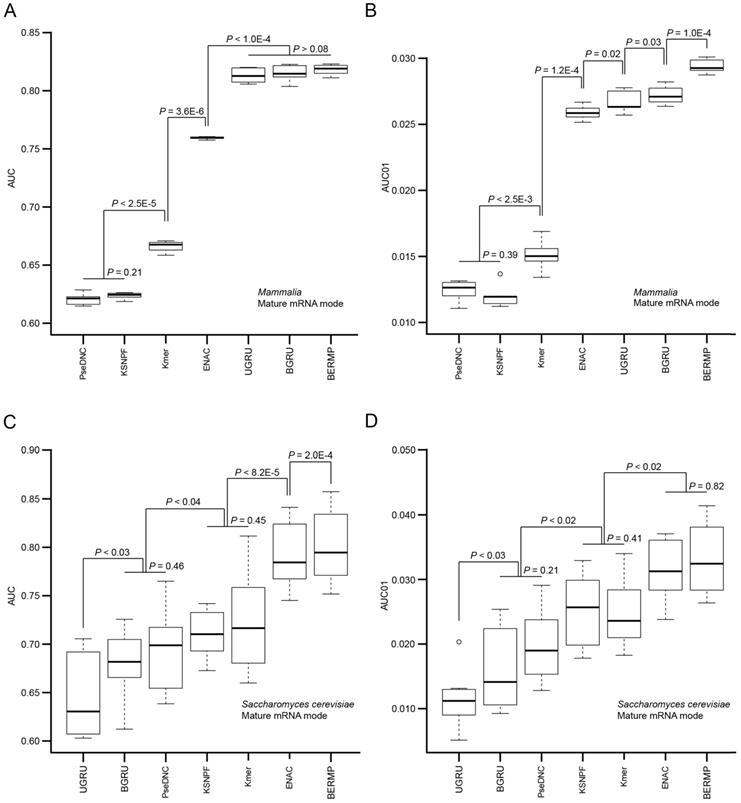
The computational approaches for predictions of m6A sites are generally based on different ML methods combined with various pre-defined features. We reason that although the accuracy of a prediction approach is affected by the selection of the ML method, the major determinant likely comes from the encoding schemes. Accordingly, we constructed RF-based predictors with different common encoding schemes to evaluate these encodings. We selected three common features used in the state-of-the-art m6A predictors, i.e. Kmer, K-spaced nucleotide pair frequencies (KSNPF) and Pseudo dinucleotide composition (PseDNC) (Table S1). Additionally, we designed a novel encoding of Enhanced NAC (ENAC) in which the frequency of the nucleic acids was counted in the window continuously sliding from the N- to C-terminal of the RNA sequence (See Methods for detail). Among these encoding schemes, the ENAC encoding performed the best in the prediction of m6A sites for both cross-validation and independent tests for Saccharomyces cerevisiae, mammalian full transcript and mRNA datasets, respectively (Figure 2A&C, Figure S3A, Table 1&S7). As performance at a low false positive rate is crucial in practical prediction applications, we estimated the predictors using AUC01 where specificity was determined as >90%. ENAC still demonstrated the best performance via cross-validation and independent tests for these species (Figure 2B&D, Figure S3B, Table 1&S7).
Performance comparison of the seven m6A predictors via cross-validation. The AUC (A) and AUC01 values (B) for mammalian mRNA mode were calculated via five-fold cross validation (Figure S1A). The AUC (C) and AUC01 values (D) for Saccharomyces cerevisiae mRNA mode were calculated via ten-fold cross validation (Figure S1B). For each algorithm, the AUC or AUC01 values between the adjacent data sets were statistically compared and the horizontal line represented no statistical difference (P >0.05). The P value was calculated by a paired student's t-test.
Prediction results of different classifiers via cross validation.
| Species1 | Classifiers2 | Acc3 | Sn3 | Sp3 | MCC3 | AUC3 | AUC013 |
|---|---|---|---|---|---|---|---|
| Mammalia full transcript | RFENAC | 86.13 | 47.12 | 90.02 | 0.314 | 0.806 | 0.0340 |
| RFKmer | 85.39 | 37.33 | 90.18 | 0.241 | 0.769 | 0.0255 | |
| RFKSNPF | 85.39 | 34.45 | 90.46 | 0.222 | 0.769 | 0.0219 | |
| RFPseDNC | 85.17 | 30.70 | 90.60 | 0.193 | 0.727 | 0.0204 | |
| UGRU | 87.48 | 62.21 | 90.00 | 0.423 | 0.885 | 0.0403 | |
| BGRU | 87.57 | 63.15 | 90.00 | 0.430 | 0.889 | 0.0413 | |
| BERMP | 87.80 | 65.76 | 90.00 | 0.448 | 0.891 | 0.0456 | |
| Mammalia mature mRNA | RFENAC | 85.74 | 38.80 | 90.42 | 0.256 | 0.761 | 0.0251 |
| RFKmer | 84.38 | 22.79 | 90.58 | 0.125 | 0.666 | 0.0143 | |
| RFKSNPF | 83.75 | 20.08 | 90.09 | 0.094 | 0.623 | 0.0132 | |
| RFPseDNC | 84.00 | 19.80 | 90.40 | 0.095 | 0.621 | 0.0124 | |
| UGRU | 85.90 | 43.73 | 90.10 | 0.289 | 0.813 | 0.0263 | |
| BGRU | 85.90 | 44.74 | 90.00 | 0.296 | 0.815 | 0.0272 | |
| BERMP | 86.14 | 46.58 | 90.08 | 0.311 | 0.817 | 0.0294 | |
| Saccharomyces cerevisiae mRNA | RFENAC | 67.64 | 44.91 | 90.36 | 0.396 | 0.792 | 0.0285 |
| RFKmer | 61.41 | 32.27 | 90.55 | 0.281 | 0.724 | 0.0207 | |
| RFKSNPF | 60.45 | 30.27 | 90.64 | 0.262 | 0.719 | 0.0209 | |
| RFPseDNC | 58.77 | 27.36 | 90.18 | 0.226 | 0.693 | 0.0153 | |
| UGRU | 54.86 | 19.45 | 90.27 | 0.138 | 0.648 | 0.0101 | |
| BGRU | 56.86 | 23.64 | 90.09 | 0.184 | 0.679 | 0.0142 | |
| BERMP | 68.59 | 47.10 | 90.10 | 0.412 | 0.800 | 0.0280 | |
| Arabidopsis thaliana mRNA | RFENAC | 81.02 | 71.71 | 90.33 | 0.632 | 0.898 | 0.0511 |
| RFKmer | 85.53 | 81.24 | 90.02 | 0.714 | 0.928 | 0.0612 | |
| RFKSNPF | 84.33 | 78.67 | 90.00 | 0.691 | 0.919 | 0.0572 | |
| RFPseDNC | 83.55 | 77.10 | 90.00 | 0.677 | 0.910 | 0.0514 | |
| UGRU | 84.95 | 79.71 | 90.20 | 0.703 | 0.923 | 0.0581 | |
| BGRU | 85.93 | 81.71 | 90.14 | 0.721 | 0.928 | 0.0583 | |
| BERMP | 85.95 | 81.81 | 90.10 | 0.722 | 0.927 | 0.0582 |
Note: 1 The datasets and the number of folds for cross validation were depicted in Figure S1. 2RFENAC=RF classifier with the ENAC encoding, RFKSNPF= RF classifier with the encoding of K-spaced nucleotide pair frequencies, RFPseDNC=RF classifier with the encoding of Pseudo dinucleotide composition, UGRU= the unidirectional GRU-based RNN classifier with word embedding, BGRU= the bidirectional GRU-based RNN classifier with word embedding, BERMP= BGRU-based Ensemble RNA Methylation site Predictor that integrating BGRU and RFENAC. 3Acc=accuracy, Sn=sensitivity, Sp=specificity, MCC=Matthew's Correlation Coefficient, AUC=area under the receiver operating characteristic, AUC01 = AUC with a <10% false positive rate (i.e., specificity>90%).
The bidirectional GRU-based DL approach with word embedding demonstrated superior performance
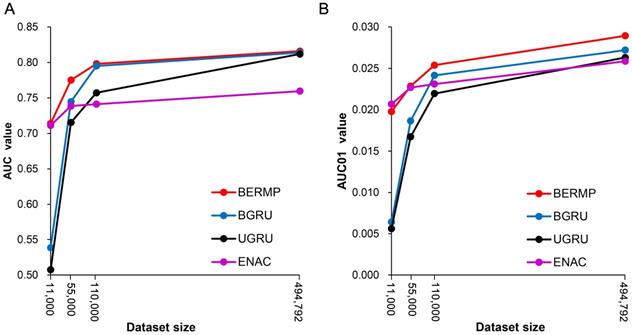
The general PTM prediction approaches are based on traditional ML algorithms where pre-defined features are determined. Recently, DL approaches have been reported to outperform traditional ML methods in the field of bioinformatics, such as predictions of protein modifications [14, 21]. In this study, we constructed two DL classifiers: a unidirectional GRU (UGRU)-based RNN classifier with word embedding and a bidirectional GRU (BGRU)-based counterpart (Figure 1; See Methods for detail). BGRU had larger AUC or AUC01 values than UGRU for all the three species (P<0.03, paired student's t-test), suggesting that the complex network architecture of BGRU is more suitable for the m6A prediction (Figure 2, Figure S3&S5, Table 1&S7). The further comparison between BGRU and the traditional ML classifiers showed that BGRU performed better for the mammalian full transcript and mRNA datasets but the reverse was true for the yeast dataset (Figure 2, Figure S3, Table 1&S7). Because the sizes of the mammalian datasets are over 50 times larger than that of the yeast dataset, we hypothesized that BGRU is more sensitive to the size of training data. To test it, we calculated the performances of BGRU and the ML representative RFENAC that were constructed separately using all (>550,000), one-fifth (110,000), one-tenth (55,000) and one-fiftieth (11,000) of the mammalian datasets with five-fold cross-validation (Figure 3&S4). Indeed, BGRU has larger AUC values than RFENAC for larger-sized data but not for smaller-sized data, although the overall performances of both approaches increased with the size of the training dataset (Figure 3A&S4A). A similar observation was made for the comparison of AUC01 values (Figure 3B&S4B). In summary, BGRU is advantageous to the m6A prediction when trained using the large-scale data.
Relationship between data size and prediction performance of classifiers using the Mammalia mRNA dataset. The AUC values (A) and AUC01 values (B) were calculated using four different data sizes (all, one-fifth, one-tenth and one-fiftieth) via five-fold cross validation (Figure S1A).
Establishment of the BERMP framework by the combination of BGRU and the ENAC-encoding RF classifier
According to the comparisons above, BGRU showed the better performance for the mammalian datasets whereas RFENAC was superior for the yeast dataset. As the combination of different classifiers have potential complementary effects on the better achievement, we explored whether an integration of the two classifiers could be more robust or perform better for the cross-species prediction. Accordingly, we developed BERMP that integrated BGRU and RFENAC through the logistic regression approach (Figure 1). BERMP achieved larger AUC01 values than BGRU for mammals (P = 1.0x10⁻⁴ for the mRNA mode; P = 3.8x10⁻³ for the full transcript mode; paired student's t test) and had larger AUC values than RFENAC for yeast (P = 2.0 x10⁻⁴, paired student's t test) via cross-validation (Figure 2, Table 1). The similar observations were made for the independent tests (Table S7).
We also evaluated BERMP for Arabidopsis thaliana by comparing it with other classifiers described above. All these classifiers had outstanding performances with AUC>0.89 and AUC01>0.05, compared with their performances for other species (Figure S5, Table 1&S7). In these classifiers, BERMP, RFKmer and BGRU had similar AUC and AUC01 values and outperformed others via cross-validation (Figure S5). Therefore, BERMP is a competitive classifier for this species (Table 1&S7).
Comparison of BERMP with published m6A prediction tools
We compared BERMP with the reported m6A predictors for three species, i.e. the Saccharomyces cerevisiae, Arabidopsis thaliana and Mammalia, respectively. As a few predictors have been developed for different species, we selected representatives for each species that were documented with good performances, i.e. SRAMP [15] for Mammalia, RFAthM6A [17] for Arabidopsis thaliana, pRNAm-PC [22], M6A-HPCS [23] and RAM-NPPS [24] for Saccharomyces cerevisiae.
The mammalian dataset was used to train and independently test both SRAMP and BERMP (Figure S1A). Four different stringency thresholds (i.e. very high, high, moderate and low) that correspond to approximately 99%, 95%, 90% and 85% specificities were employed for comparison (Table 2). For each stringency and each mode, BERMP had the larger sensitivity and MCC values than SRAMP, suggesting that BERMP performs better than SRAMP. To further estimate the accuracy of BERMP, we introduced the golden standard dataset that contained experimentally verified 7 m6A positives and 15 negatives from four human transcripts (i.e. MALAT1, TUG1, TPT1 and BSG1) [25], which were previously used for the evaluation of SRAMP [15]. As shown in Figure S6, both BERMP and SRAMP correctly identified all of the bona fide m6A sites using the high stringency threshold; but BERMP resulted in three false positives and SRAMP outputted four false positives (Figure S6). These indicate that BERMP compared favorably to SRAMP for mammalian m6A prediction.
Performance comparison of SRAMP and BERMP on the independent mammalian dataset at various stringency thresholds.
| Mode | Stringency (Specificity) | SRAMP | BERMP | ||
|---|---|---|---|---|---|
| Sensitivity | MCC | Sensitivity | MCC | ||
| Full transcript mode | Very high (98.7%) | 25.7% | 0.373 | 29.6% | 0.421 |
| High (93.7%) | 50.3% | 0.414 | 60.3% | 0.492 | |
| Moderate (88.1%) | 64.5% | 0.405 | 74.9% | 0.475 | |
| Low (83.0%) | 72.8% | 0.385 | 82.5% | 0.447 | |
| Mature mRNA mode | Very high (99.1%) | 11.0% | 0.211 | 11.0% | 0.215 |
| High (95.0%) | 29.6% | 0.273 | 33.5% | 0.309 | |
| Moderate (90.0%) | 44.0% | 0.293 | 48.7% | 0.325 | |
| Low (85.3%) | 54.2% | 0.294 | 58.9% | 0.325 | |
Note: The very high, high, moderate and low stringency thresholds correspond to approximately 99%, 95%, 90% and 85% specificities in five-fold cross-validation tests, respectively. The same datasets were used to develop and compare both classifiers (Figure S1). The results for SRAMP excerpted from [15].
Three developed classifiers (i.e. pRNAm-PC, M6A-HPCS and RAM-NPPS) were selected to compare with BERMP for Saccharomyces cerevisiae. All of them were based on the same dataset that contained 1307 positives and 1307 negatives with the length of 51 nucleic acids [16]. The specificity threshold was set around 69% for BERMP and the re-implemented RAM-NPPS to produce the sensitivity, Accuracy, MCC values. Table 3 summaries the results of the comparison of these predictors. BERMP outperformed the others with respect to sensitivity, Accuracy, MCC and AUC values. Using AUC as an example, 8.7%, 3.8% and 2.0% improvements were observed compared with M6A-HPCS, pRNAm-PC and RAM-NPPS, respectively.
Comparison of BERMP and other predictors on identifying m6A sites from Saccharomyces cerevisiae.
| Predictor | Specificity | Sensitivity | Accuracy | MCC | AUC |
|---|---|---|---|---|---|
| BERMP | 69.56 | 72.95 | 71.26 | 0.43 | 0.800 |
| pRNAm-PC | 69.75 | 69.72 | 69.74 | 0.40 | 0.762 |
| M6A-HPCS | 62.89 | 71.77 | 67.33 | 0.35 | 0.713 |
| RAM-NPPS | 69.08 | 72.46 | 70.77 | 0.42 | 0.780 |
Note: The classifiers were based on the same dataset [16]. The results for pRNAm-PC excerpted from [22] and those for M6A-HPCS excerpted from [23]. RAM-NPPS was re-implemented and BERMP was developed using the same training dataset (Figure S1). The identical independent dataset was employed for comparison and the corresponding results were shown above (Figure S1).
BERMP was compared with RFAthM6A for the prediction of m6A sites from Arabidopsis thaliana. Both classifiers were developed using the same dataset and evaluated based on five-fold cross-validation (Table 4). High, moderate and low specificity thresholds were selected to produce sensitivity and MCC values. BERMP performed better than RFAthM6A with respect to both evaluation indexes for each threshold. In summary, BERMP was a cross-species m6A predictor with high accuracy.
Comparison between BERMP and RFAthM6A on identifying m6A sites from Arabidopsis thaliana.
| Specificity level | High specificity (90%) | Moderate specificity (85%) | Low specificity (80%) | |||||
|---|---|---|---|---|---|---|---|---|
| Sensitivity | MCC | Sensitivity | MCC | Sensitivity | MCC | |||
| BERMP | 0.823 | 0.726 | 0.888 | 0.739 | 0.917 | 0.722 | ||
| RFAthM6A | 0.822 | 0.725 | 0.873 | 0.724 | 0.908 | 0.712 | ||
Advantages, limitations and future perspectives
There are a few in-silico approaches for identifying m6A sites from different species where only one is developed for multiple species. In this paper, we presented BERMP as a novel cross-species method for m6A site prediction. Although BERMP is the second multi-species classifier, it outperformed the existing m6A classifiers for different species. BERMP integrated the bidirectional GRU-based DL approach BGRU and the random forest method with extended nucleic acid content RFENAC. We believe the superior performance is mainly due to that following aspects: (1) BGRU captured the underlying sequence patterns related to m6A for the large dataset better than feature engineering-based methods; (2) Although the advantage of BGRU on the large dataset is not reflected in the small dataset, another member of BERMP RFENAC caught the informative features from the small dataset better than its competitors; (3) the integration of BGRU and RFENAC compensated for the shortcomings of the two individuals and further improved the performance for different species. To our best knowledge, this is the first application of any deep-learning method in m6A site prediction across the species with high accuracy. Besides the m6A site prediction, BERMP also provides customized model training that enables advanced users to build other RNA/DNA modification models using their own data.
According to our analysis above, prediction accuracy of the DL algorithm is sensitive to the size of dataset. It demonstrated good performance based on the large data set, however its performance decreased when the training set is reduced. On one hand, it will be helpful to generate more high-resolution m6A sites for the construction of DL classifiers with higher accuracy. On the other hand, the development of novel DL architecture that is suitable for a small dataset is urgently demanded. Indeed, a novel DL classifier was developed based on hundreds of positives obtained competitive results in kinase specific phosphorylation prediction compared to traditional ML approaches [14].
To summarize, BERMP is an across-species classifier for identifying m6A sites with high confidence. We believe that the superior performance of our DL method is mainly due to its strong capability for learning sparse representation in a self-taught manner and thus it could auto-capture the most informative features. We are also excited by the prospect that DL methods may be applied broadly to the development of classifiers for predicting other types of modification sites.
Supplementary Material
Supplementary figures and tables.
Acknowledgements
This work was supported, in part, by funds from the Young Scientists Fund of the National Natural Science Foundation of China (Grant No. 31701142 to ZC; Grant No. 81602621 to NH), Qingdao Postdoctoral Science Foundation (Grunt No. 2016061 to NH), the Shandong Provincial Natural Science Foundation (Grant No. ZR2016CM14 to LL), the National Natural Science Foundation of China (Grant No. 31770821 to LL), LL is a recipient of “Distinguished Expert of Overseas Tai Shan Scholar”.
Author contributions
Y.H., Z.C. and L.L. conceived and designed the project. Y.H. and Z.C. constructed the algorithms under the supervision of L.L. Y.H., Z.C., Y.Z., N.H., L.L. analyzed the data. Y.H. and L.L. wrote the manuscript.
Competing Interests
The authors have declared that no competing interest exists.
References
1. Boccaletto P, Machnicka MA, Purta E, Piatkowski P, Baginski B, Wirecki TK. et al. MODOMICS: a database of RNA modification pathways. 2017 update. Nucleic Acids Res. 2018;46:D303-D7
2. Deng X, Chen K, Luo GZ, Weng X, Ji Q, Zhou T. et al. Widespread occurrence of N6-methyladenosine in bacterial mRNA. Nucleic Acids Res. 2015;43:6557-67
3. Meyer KD, Jaffrey SR. The dynamic epitranscriptome: N6-methyladenosine and gene expression control. Nat Rev Mol Cell Biol. 2014;15:313-26
4. Nilsen TW. Molecular biology. Internal mRNA methylation finally finds functions. Science. 2014;343:1207-8
5. Schwartz S, Agarwala SD, Mumbach MR, Jovanovic M, Mertins P, Shishkin A. et al. High-resolution mapping reveals a conserved, widespread, dynamic mRNA methylation program in yeast meiosis. Cell. 2013;155:1409-21
6. Meyer KD, Saletore Y, Zumbo P, Elemento O, Mason CE, Jaffrey SR. Comprehensive analysis of mRNA methylation reveals enrichment in 3' UTRs and near stop codons. Cell. 2012;149:1635-46
7. Dominissini D, Moshitch-Moshkovitz S, Salmon-Divon M, Amariglio N, Rechavi G. Transcriptome-wide mapping of N(6)-methyladenosine by m(6)A-seq based on immunocapturing and massively parallel sequencing. Nat Protoc. 2013;8:176-89
8. Wan Y, Tang K, Zhang D, Xie S, Zhu X, Wang Z. et al. Transcriptome-wide high-throughput deep m(6)A-seq reveals unique differential m(6)A methylation patterns between three organs in Arabidopsis thaliana. Genome Biol. 2015;16:272
9. Dominissini D, Moshitch-Moshkovitz S, Schwartz S, Salmon-Divon M, Ungar L, Osenberg S. et al. Topology of the human and mouse m6A RNA methylomes revealed by m6A-seq. Nature. 2012;485:201-6
10. Levis R, Penman S. 5'-terminal structures of poly(A)+ cytoplasmic messenger RNA and of poly(A)+ and poly(A)- heterogeneous nuclear RNA of cells of the dipteran Drosophila melanogaster. J Mol Biol. 1978;120:487-515
11. Xiang S, Yan Z, Liu K, Zhang Y, Sun Z. AthMethPre: a web server for the prediction and query of mRNA m(6)A sites in Arabidopsis thaliana. Mol Biosyst. 2016;12:3333-7
12. Leung MK, Xiong HY, Lee LJ, Frey BJ. Deep learning of the tissue-regulated splicing code. Bioinformatics. 2014;30:i121-9
13. Heffernan R, Yang Y, Paliwal K, Zhou Y. Capturing non-local interactions by long short-term memory bidirectional recurrent neural networks for improving prediction of protein secondary structure, backbone angles, contact numbers and solvent accessibility. Bioinformatics. 2017;33:2842-9
14. Wang D, Zeng S, Xu C, Qiu W, Liang Y, Joshi T. et al. MusiteDeep: a deep-learning framework for general and kinase-specific phosphorylation site prediction. Bioinformatics. 2017;33:3909-16
15. Zhou Y, Zeng P, Li YH, Zhang Z, Cui Q. SRAMP: prediction of mammalian N6-methyladenosine (m6A) sites based on sequence-derived features. Nucleic Acids Res. 2016;44:e91
16. Chen W, Feng P, Ding H, Lin H, Chou KC. iRNA-Methyl: Identifying N(6)-methyladenosine sites using pseudo nucleotide composition. Anal Biochem. 2015;490:26-33
17. Wang X, Yan R. RFAthM6A: a new tool for predicting m(6)A sites in Arabidopsis thaliana. Plant Mol Biol. 2018;96:327-37
18. Kingma DP, Ba J. Adam: A Method for Stochastic Optimization. ArXiv e-prints. 2014
19. Srivastava N, Hinton GE, Krizhevsky A, Sutskever I, Salakhutdinov R. Dropout: a simple way to prevent neural networks from overfitting. Journal of Machine Learning Research. 2014;15:1929-58
20. Rampasek L, Goldenberg A. TensorFlow: Biology's Gateway to Deep Learning? Cell systems. 2016;2:12-4
21. He F, Bao L, Wang R, Li J, Xu D, Zhao X. A multimodal deep architecture for large-scale protein ubiquitylation site prediction. 2017 IEEE International Conference on Bioinformatics and Biomedicine (BIBM). 2017 p. 108-13
22. Liu Z, Xiao X, Yu DJ, Jia J, Qiu WR, Chou KC. pRNAm-PC: Predicting N(6)-methyladenosine sites in RNA sequences via physical-chemical properties. Anal Biochem. 2016;497:60-7
23. Zhang M, Sun JW, Liu Z, Ren MW, Shen HB, Yu DJ. Improving N(6)-methyladenosine site prediction with heuristic selection of nucleotide physical-chemical properties. Anal Biochem. 2016;508:104-13
24. Xing P, Su R, Guo F, Wei L. Identifying N(6)-methyladenosine sites using multi-interval nucleotide pair position specificity and support vector machine. Sci Rep. 2017;7:46757
25. Liu N, Parisien M, Dai Q, Zheng G, He C, Pan T. Probing N6-methyladenosine RNA modification status at single nucleotide resolution in mRNA and long noncoding RNA. Rna. 2013;19:1848-56
Author contact
![]() Corresponding authors: E-mail: leiliedu.cn (Li, L). E-mail: zhenchenedu.cn (Chen, Z).
Corresponding authors: E-mail: leiliedu.cn (Li, L). E-mail: zhenchenedu.cn (Chen, Z).