Impact Factor ISSN: 1449-2288
- Issue 9; 2026
- Issue 8; 2026
- Issue 7; 2026
- Issue 6; 2026
- Issue 5; 2026
- Volume 22; 2026
- Past Issues
- Advance Articles
- Editorial Board
- Cover Images
- Index & Coverage
- Cover Suggestion
- Special Issues
Introduction
Materials and Methods
Results
Discussion
Supplementary Material
Acknowledgements
References

 Global reach, higher impact
Int J Biol Sci 2019; 15(9):1802-1815. doi:10.7150/ijbs.34785 This issue Cite
Research Paper
CHL1 suppresses tumor growth and metastasis in nasopharyngeal carcinoma by repressing PI3K/AKT signaling pathway via interaction with Integrin β1 and Merlin
Juan Chen1,2, Chen Jiang1, Li Fu7, Cai-Lei Zhu1, Yan-Qun Xiang6, Ling-Xi Jiang1, Qian Chen3, Wai Man Liu1, Jin-Na Chen1, Li-Yi Zhang1, Ming Liu1, Chao Chen8, Hong Tang1, Bo Wang2, Sai Wah Tsao4, Dora Lai-Wan Kwong1, Xin-Yuan Guan1,5 ![]()
1. Departments of Clinical Oncology, Li Ka Shing Faculty of Medicine, The University of Hong Kong, Hong Kong, China;
2. Department of Clinical Oncology, The Seventh Affiliated Hospital, Sun Yat-sen University.
3. Departments of Pathology, Li Ka Shing Faculty of Medicine, The University of Hong Kong, Hong Kong, China;
4. Departments of Anatomy, Li Ka Shing Faculty of Medicine, The University of Hong Kong, Hong Kong, China;
5. State Key Laboratory of Oncology in Southern China, Sun Yat-Sen University Cancer Center, Guangzhou, China;
6. Department of Nasopharyngeal, Sun Yat-Sen Cancer Center, Guangzhou, China.
7. Guangdong Key Laboratory for Genome Stability & Disease Prevention, Department of Pharmacology and Shenzhen University International Cancer Research Centre, Shenzhen University school of Medicine, Shenzhen, China.
8. Department of Orthopedics, Union Hospital, Tongji Medical College, Science and Technology of Huazhong University, Wuhan, China.
Received 2019-3-11; Accepted 2019-4-19; Published 2019-7-11
Abstract

Deletion of Chromosome 3p is one of the most frequently detected genetic alterations in nasopharyngeal carcinoma (NPC). We reported the role of a novel 3p26.3 tumor suppressor gene (TSG) CHL1 in NPC. Down-regulation of CHL1 was detected in 4/6 of NPC cell lines and 71/95 (74.7%) in clinical tissues. Ectopic expressions of CHL1 in NPC cells significantly inhibit colony formation and cell motility in functional study. By up-regulating epithelial markers and down-regulating mesenchymal markers CHL1 could induce mesenchymal-epithelial transition (MET), a key step in preventing tumor invasion and metastasis. CHL1 could also cause the inactivation of RhoA/Rac1/Cdc42 signaling pathway and inhibit the formation of stress fiber, lamellipodia, and filopodia. CHL1 could co-localize with adhesion molecule Integrin-β1, the expression of CHL1 was positively correlated with Integrin-β1 and another known tumor suppressor gene (TSG) Merlin. Down-regulation of Integrin-β1 or Merlin was significantly correlated with the poor survival rate of NPC patients. Further mechanistic studies showed that CHL1 could directly interact with integrin-β1 and link to Merlin, leading to the inactivation of integrin β1-AKT pathway. In conclusion, CHL1 is a vital tumor suppressor in the carcinogenesis of NPC.
Keywords: nasopharyngeal carcinoma, tumor suppressor gene, tumor invasion, tumor metastasis
Introduction
Nasopharyngeal carcinoma (NPC) is a widespread head and neck malignancy that poses a serious threat to health especially in Southeast Asia [1]. Although the molecular mechanism underlying the development of NPC remains unclear, some factors such as genetic susceptibility, EBV infection and environmental risk have been associated with its pathogenesis [2, 3]. Cytogenetic studies have been able detect multiple recurrent chromosomal abnormalities in NPC including the deletion of the short arm of chromosome 3p, suggesting that the resident genes at this region play important roles in NPC pathogenesis [4-6]. Studies has showed that the loss of chromosome 3p was recurrently observed in several carcinogenic disease including NPC [7], lung cancer [8] and esophageal carcinomas [9] . By using single-nucleotide polymorphism (SNP)-mass array, we identified the corresponding tumor suppressor genes (TSGs) commonly deleted at 3p in non-small cell lung cancer [10] and esophageal squamous cell cancer [11]. A putative TSG called cell close homologue of L1 (CHL1, also known as CALL) located at 3p26 loci was identified because it is commonly deleted in lung, esophageal and nasopharyngeal carcinoma respectively.
CHL1 encodes a protein with 1,224 amino acids belonging to a member of the L1 gene family of neural cell adhesion molecules (CAM) [12]. CHL1 protein contains a single-pass transmembrane peptide, 6 immunoglobulin (Ig) domains, 4 fibronectin type III (FNIII) domains, and a 105-amino acid cytoplasmic domain [13]. Being a neurotransmitter, CHL1 has been reported to be involved in the general cognitive activities [14, 15]. It is also reported to be involved in some neurological diseases such as schizophrenia [16]. Deleting a copy of this gene may be associated with mental dysfunction of 3p- syndrome [14]. As a CAM member, CHL1 and L1CAM another CAM have been reported in cancer development and metastasis in ovarian [17], breast [18], colon [19], pancreatic [20] and gallbladder [21] cancers. A study has also reported that 3p26 is a major predisposition locus for prostate cancer [22]. Collectively these findings suggest that CHL1 is involved in the carcinogenesis. In this study, the expression status of CHL1, its potential tumor suppressive role and molecular mechanism in NPC development were characterized.
Materials and Methods
Cell lines and clinical samples
Two immortalized nasopharyngeal epithelial cell lines (NP460 and NP69) and three NPC cell lines (C666, CNE2 and SUNE1) were used in this study. C666 was derived from EBV-positive NPC, while SUNE1 and CNE2 from EBV-negative NPC cell line. Both NP69 and NP460 are EBV-negative cell lines. NPC cell lines were cultured in high-glucose Dulbecco's Modified Eagle Medium (DMEM) (Gibco BRL, Grand Island, NY) supplemented with 10% fetal bovine serum (FBS). NP460 and NP69 on the other hand were cultured in a defined keratinocyte serum-free medium (Invitrogen, Carlsbad, CA). Guangzhou Cohort consisting of 95 NPC tumor biopsies were obtained from Sun Yat-Sen University Cancer Center (Guangzhou, China). The clinical samples used in this study were reviewed and approved by the Committee for Ethical Review of Research involving Human Subjects at Sun Yat-sen University. Hong Kong Cohort consisting of 15 tumor tissues of primary nasopharyngeal carcinoma and their matched non-tumor tissues endoscopic biopsies were taken from the Queen Mary Hospital in Hong Kong. The samples in this study were based on the standard method approved by the Ethics Review Committee of research involving Human Subjects at the University of Hong Kong.
Quantitative Real-time PCR (qPCR)
Quantitative Real-time qPCR was performed using a SYBR Green PCR kit (Applied Biosystems, Foster City, CA) following the instructional protocol contained in manufacturer's manual and the signal detection was obtained using ABI PRISM7900 Sequence Detector (Applied Biosystems, Foster City, CA). GAPDH was an internal control. The data were collected and analyzed with SDS Relative Quantification Software 2.2.3 (Applied Biosystems, Foster City, CA).
Promoter methylation analysis
CpG islands were predicted using the MethPrimer software. We extracted Genomic DNA from cell lines with bisulfite treatment method using Epitect Bisulfite Modification Kit (Qiagen, Valencia, CA). Bisulfite genomic sequencing (BGS) was performed with CHL1 primers (Forward primer: 5'-TTTTAAATGAAGGAAAGTAAGAAG-3'; Reverse primer: 5'-TCTACTCCCTTCCTAAATTCTAC-3'). The reagent 5-aza-2′-deoxygcitidine (Sigma-Aldrich, St Louis, MO) was used to test if CHL1 expression could be restored by demethylation treatment, it was also employed for the extraction of total RNA (qPCR method) which we used to detect the expression of CHL1.
In vitro tumorigenicity assays
Tumor suppressive function of CHLI was studied by cloning a full-length CHL1 into pcDNA3.1 vector (Invitrogen, Carlsbad, CA) the clones were gently transfected into NPC cell lines C666 (CHL1-C666) and SUNE1 (CHL1-SUNE1). Non-transfected cells (Vec-C666 and Vec-SUNE1) were used as controls. To measure the growth rate, the cells were implanted into a 96-well plate at a density of 1×10³ per well and cultured for 6 days. Cell growth rate was determined using cell proliferation XTT kit (Sigma-Aldrich, St. Louis, MO) at specific time intervals according to manufacturer's instruction. To assay the foci formation, we implanted cells in a 6-well plate at a density of 1×10³ cells per well and incubated at 37 ºC for 14 days. Surviving colonies (>50 cells per colony) were stained with 0.1% crystal violet and counted. This experiment was performed independently three times.
In vivo tumorigenicity assay
Approximately 1×10⁶ CHL1- and Non-transfected cells, respectively were subcutaneously injected into the bilateral dorsal region of 4-week-old nude mice (n=10 for each group). Tumor growth rate was determined by measuring tumor volume throughout a period of 4-weeks (Formula: Volume= 0.5×L×W2). Experiments on animals were carried out according to the protocols approved by the Committee on the Use of Live Animals in Teaching and Research (CULATRA).
Cell motility assays
For wound healing assay, cells were implanted into a 6-well plate until they are confluent. Cultured cells were wounded with a sterile tip and photographed under a phase contrast microscope at different time intervals. For cell invasion assay, the cells were implanted into a 24-well Biocoat Matrgel Invasion Chamber (BD Biosciences, San Jose, CA) according to the instructional procedures in manufacturers' guide. After 24 hours, cells that invaded through the Matrigel were fixed on a slide using 100% methanol, stained with 0.1% crystal violent and counted under a microscope. This experiment was performed independently three times.
Experimental metastasis assay
Five-week-old severe combined immunodeficient (SCID)-Beige mice were used for in vivo metastasis assay. Briefly, 5×10⁵ cells were injected into the tail vein of each SCID mouse (n=5 for each group). All tested mice were sacrificed at week 12. To determine the number of tumor nodules formed on the surface of the lung sections of tissues from the lungs were extracted and then embedded in paraffin, removed and were stained with H&E. All procedures were approved by the University of Hong Kong CULATR.
Cell cycle analysis with flow cytometry
CHL1- and non-transfected cells (5×10⁶) were cultivated in DMEM medium that is supplemented with 10% FBS. The addition of serum to culture medium was discontinued when 70% of the cells were synchronized with cells at G1 phase. After 72hr of incubation, 10% FBS was added to the medium and incubated for further 12hr. Thereafter the cells were fixed with 70% ethanol, stained with propidium iodide, and DNA content was determined using Cytomics FC (Beckman Coulter, Brea, CA). The results obtained were evaluated using Cell Quest and ModFit LT2.0 software (BD Biosciences, San Jose, CA). Triplicate independent experiments were also performed.
RNA interference with siRNA
Silencing of CHL1 expression was achieved using siRNA from Sigma (Sigma-Aldrich, St. Louis, MO). Scramble siRNA obtained from Ambion's predesigned siRNA database (Ambion, Inc., Austin, TX) was used as negative control. siRNA was transiently transfected into NP 460 cells by liposome TM-2000 (Invitrogen, Carlsbad, CA). 48 hours after transfection, the efficiency of gene silencing was analyzed with RT-PCR.
F-actin staining
The slides attached with cells were fixed with 4% paraformaldehyde in PBS for 10min, followed by staining with 6.6µM Rhodamine phalloidin (Invitrogen, Carlsbad, CA) at room temperature. cells were further counterstained with DAPI and images were collected by a Leica DMRA fluorescence microscope (Rueil-Malmaison, Germany).
Rho-GTPase activation assay
Rhotekin-agarose (for isolating Rho-GTP) and PAK1 PBD-agarose (for isolating Rac1-GTP and Cdc42-GTP) (Upstate Biotechnology, Lake Placid, NY) were used to assay for Rho-GTPase activation following the instructional procedure from manufacturer's guide. The quantification and characterization of Rho, Rac1, and Cdc42 were carried out using western blot assay.
Western blotting and antibodies
Western blot analysis was performed using the standard method with β-actin as the loading control. Antibodies used in this study are listed in the Supplementary Table 2.
Immunofluorescence (IF)
The cells transfected with CHL1 and vectors were placed on gelatin coated tablets, fixed with 4% paraformaldehyde, permeabilized in PBS with 0.1% Triton-X 100, and blocked with 1% bovine serum albumin. The cells were incubated overnight with primary antibodies at 4°C followed by another incubation at room temperature with FITC-conjugated anti-mouse secondary antibody and Texas red-conjugated anti-rabbit secondary antibody for 1 hour. Images were taken after adding anti-fade 4′, 6-diamidino-2-phenylindole (DAPI).
Co-immunoprecipitation (Co-IP)
Co-immunoprecipitation (Co-IP) assay was performed with immunoprecipitation kit (Roche, Mannheim, Germany) according to the manufacturer's instructions. Briefly after cell lysis, sample preparation, preclearing with protein A/G agarose, and immune-precipitation of the target protein, gel electrophoresis was performed followed by western blotting.
Statistical analysis
Statistical analysis was carried out using the standard version of SPSS 13.0. Results were presented as mean ±SD. χ2 test (categorial variables) or Student t-test (continuous variables) was used to compare data from the two groups. The correlations between Integrinβ1 and CHL1 in clinical samples were analyzed using Pearson correlation. The survival data was analyzed by Kaplan-Meier method and the P (Pearson co-efficient) value was calculated with log-rank analysis. A significant difference was considered when P value was less than 0.05.
Results
CHL1 is frequently down-regulated in NPC
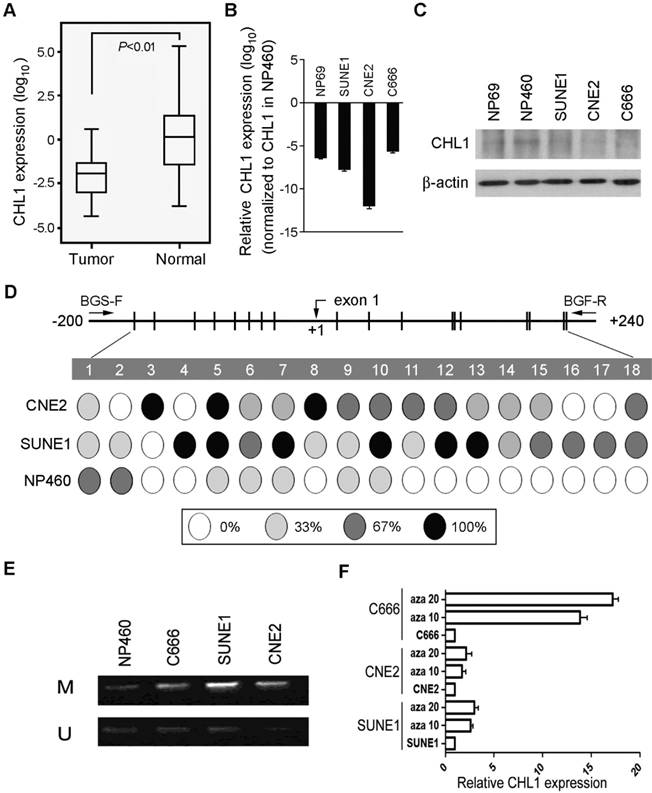
The expression pattern of CHL1 was analyzed with qPCR using samples obtained from 95 primary NPC patients (patient that has not received any form of treatment prior to the collection of the sample) and compared against the control (pool RNA from 10 non-tumor nasopharyngeal tissues), down-regulation of CHL1 was detected in 71/95 (74.7%) of NPC cases. (Supplementary Fig. 1A). Kaplan-Meier analysis was used analyze the down-regulation of CHL1, the result showed that CHL1 was not significantly associated with the Disease-Free Survival (DFS) time (P>0.05), however, after 30 months of observation a different result was obtained, as shown in the diagram. (Supplementary Fig 1B). Clinical correlation study also showed that the down-regulation of CHL1 was not significantly associated with any tested clinical features (Supplementary Table 1). In the paired tumor and non-tumor tissue, down-regulation of CHL1 was detected in 12/15 (80.0%) of the NPC cases (Fig. 1A). The chart showed a significant difference (P<0.01) in the levels of CHL1 between NPC and paired non-tumor tissues. We also investigated the mechanism of expression of CHL1 using qPCR and western blot analysis (Fig. 1B & 1C) in 3 NPC cell lines (C666, SUNE1 and CNE2) and 2 immortalized nasopharyngeal (NP) cell lines (NP69 and NP460). The result revealed that down-regulation of CHL1 was observed in 4 cell lines (NP69, C666, SUNE1 and CNE2), except NP460. To explore the mechanism behind CHL1 down-regulation, promoter methylation status of CHL1 in NP460, SUNE1 and CNE2 were characterized by BGS. The results showed that promoter hypermethylation was observed in cell lines of SUNE1 and CNE2 with low expression of CHL1, except in NP460 cells where the expression of CHL1 is high (Fig. 1D). To determine whether the down-regulation of CHL1 in NPC was caused by hypermethylation in this promoter region, the methylation status of CHL1 was examined using MSP methylation or unmethylation specific primers in three NPC cell lines (SUNE1, CNE2 and C666), on observation both methylated and unmethylated alleles were expressed in SUNE1 and CNE2 cell lines, except in NP460 where a weak expression of methylated allele is observed (Fig. 1E). In other to confirm the effect of promoter methylation on CHL1 expression, SUNE1, CNE2 and C666 cells were treated with the demethylating agent 5-aza-2'-deoxycytidine. After the treatment, the expression of CHL1 was restored (Fig. 1F), which strongly indicated that the promoter hypermethylation was the major vehicle in the mechanism of CHLI down-regulation.
Downregulation of CHL1 in NPC. (A) Quantification and characterization of mRNA levels in CHL1 of 95 primary NPC cases was obtained using qRT-PCR these results were contrasted with those obtained for normal tissue (N);. GAPDH was used as an internal control. (B) CHL1 Fold changes detected using qRT-PCR in 15 primary NPC tissues and their corresponding non-tumor tissues (N). CHL1 was normalized by internal control GAPDH (*P<0.01, independent Student t test). (C) qRT-PCR analysis of CHL1 expression in three NPC cell lines (C666, CNE2 and SUNE1) and NP69. The fold change expressions of CHLI detected were compared against those of the immortalized NP cell line, NP460. (D) The expression of CHL1 in the three NPC cell lines, NP 460 and NP69 were characterized by Western blot assay. (E) Mapping of the methylation status of CpG dinucleotides within the CHL1 promoter region was done with BGS in NPC cell lines (CNE2 and SUNE1) and normal cell line (NP460). A 400-bp region spanning through the CpG island with 18 CpG sites was analyzed. The methylation status at each CpG dinucleotide was represented in the pie charts. The chart shows the methylation activities at three levels indicated with these colours, black, white and grey circle representing completely methylated, completely unmethylated and partially methylated CpGs respectively. (F) Promoter methylation analysis of CHL1 in NPC cell lines was carried out by MSP, with Immortalized nasopharyngeal epithelial cell line NP460 as normal control. Expressed as M & U; M, methylated allele and U, unmethylated allele respectively. (G) Expression of CHLI by qPCR analysis after treatment with 5-aza-dC a demethylation agent in NPC cell lines (C666, CNE2 and SUNE1 cells). Again, GAPDH served as the internal control. Three representing NPC cell lines (C666, CNE2 and SUNE1) without treatment; Aza 10, cell lines treated with 10 µM 5-aza-2'-deoxycytidine; Aza 20, cell lines treated with 20 µM 5-aza-2'-deoxycytidine.
CHL1 shows strong tumor suppressive ability
In other to investigate the anti-tumor ability of CHL1, CHL1 was transfected into 2 nasopharyngeal carcinoma cells (CHL1-SUNE1 and CHL1-C666) for functional study. Non-transfected cells (Vec-SUNE1 and Vec-C666) were used as controls. Expressions of CHL1 in CHL1- and non-transfected cells were determined using qPCR and Western blot analysis (Fig. 2A). The study of the tumor suppressive role of CHL1 was characterized by an in vitro and in vivo assay. The results of the assay portrayed that growth rates were significantly decreased in CHL1-transfected cells (P<0.01, Student's t-test) compared to the control (Fig. 2B). Foci formation assay showed that CHL1 have a significant inhibitory effect on CHL1-transfected cells (P<0.01, Student's t-test) compared to control cells (Fig. 2C).
Tumor suppressive function of CHL1 in NPC cells. (A) Ectopic expression of CHL1 was detected in CHL1-transfected cells by qRT-PCR and western blotting. (B) Cell growth rates of CHL1- and non-transfected cells were compared by MTT assay. The results are expressed as mean ±SD of three independent experiments: *P<0.05, **P<0.01, independent Student t test. (C) A brief of the decreased foci formation in monolayer culture induced by CHL1. Quantitative analyses of foci numbers are indicated in the right panel. Values are displayed as the mean ±SD of at least three independent experiments: *P<0.05, **P<0.01, independent Student t test. (D) A brief of tumor formation in nude mice. Tumors induced by vector (left) and clone (right) are indicated by arrows. Excised tumors were shown in the bottom, along with the summary of tumor growth rates in nude mice induced by CHL1- and empty vector-transfected NPC cells. The average tumor volume is expressed as mean ± SD in 10 inoculated sites for each group (* P<0.05; ** P<0.001, Student's t-test). (E) qRT-PCR and Western blot analysis results for the Expression of CHL1 in siCHL1 and scramble NP69 cell (** p<0.001, Student's t-test). (F) Comparison of cell growth rates of siCHL1 and scramble NP69 cells by MTT assay. The results are expressed as mean ±SD of three independent experiments: *P<0.05, **P<0.01, independent Student t test. (G) Summary of the foci formation of the scramble cells. Quantitative analyses of foci numbers are shown in the right panel. The values presented as mean ±SD of at least three independent experiments: **P<0.01, independent Student t test. (H) Briefs of DNA content detected by flow cytometry showed that the percentage of cells in the S phase was lower while the percentage of cells in the G1 phase was higher in CHL1-transfected cells than in non-transfected cells (*p<0.05, Student's t-test). The values are expressed as mean ± SD of three independent experiments. (I) Protein expressions of CDK2, CDK4, cyclin D1 and cyclin E were compared with CHL1- and non-transfected NPC cells. β-actin was used as a loading control.
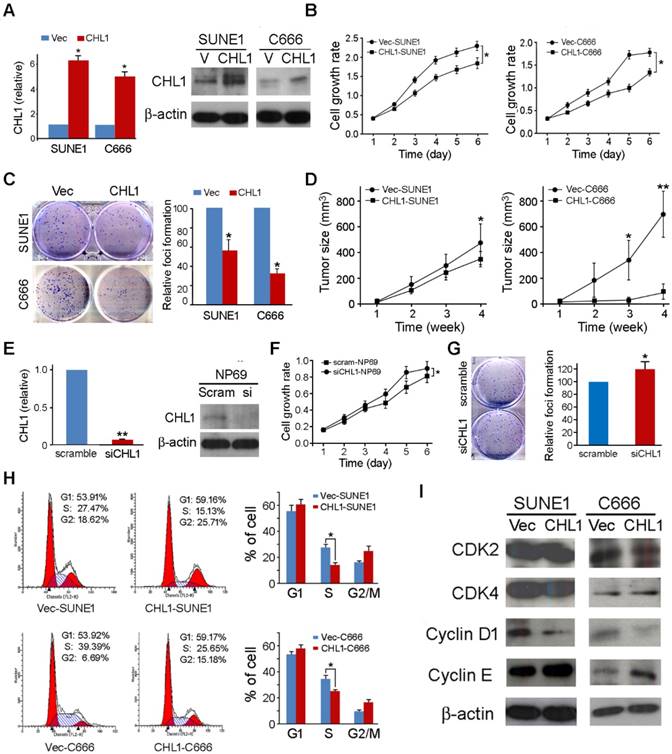
Moreover, we further investigated the tumor suppressive potential of CHL1 by in vivo tumor formation assay in nude mice. Here we subcutaneously injected CHL1- and non-transfected cells into the bilateral dorsal region of nude mice. The Xenograft tumor growth curve showed that tumors induced by CHL1-transfected cells grew much slower than tumors induced by non-transfected cells (Fig. 2D). Four weeks later, mice were sacrificed, and the tumors were harvested. The average tumor volume induced by CHL1-transfected cells was significantly smaller compared to tumors volume induced by non-transfected cells: CHL1-SUNE1 vs Vec-SUNE1 (351.92±70.69mm3 vs 491.56±196.38mm3, P<0.05); CHL1-C666 vs Vec-C666 (93.12±66.41mm3 vs 697.10±207.26mm3, P<0.01).
Knockdown of CHL1 abolishes its tumor suppressive function
To further explore the tumor-suppressive function of CHL1, RNAi was selected to silence/knockdown the endogenous CHL1 expression levels in NP69 cells using siRNA. The effect of silencing was revealed by qPCR and Western blot (Fig. 2E). Functional assays were performed to characterize the effect of CHL1 knockdown in NP69 cells. The results showed that when CHL1 is silenced the rate of cancerous cell growth significantly increased (P<0.05, Student's t-test, Fig. 2F) as well as the foci formation ability (P<0.05, Student's t-test, Fig. 2G).
CHL1 arrests cell cycle by arresting at G1/S checkpoint
To explore the mechanism of the tumor suppressive function of CHL1, flow cytometry was utilized to make the DNA content comparison between CHL1- transfected and non-transfected cells. The results indicated that the ratio of cells in the S phase was significantly decreased in CHL1-transfected cells compared to non-transfected cells (P<0.05, Student's t-test, Fig. 2H), indicating that CHL1 arrest tumor growth at the G1/S checkpoint in the growth cycle. Western blotting showed that compared to non-transfected cells, in CHL1-transfected cells the promoting factors cyclin D1 at the G1/S checkpoint were down-regulated while cyclin E was up-regulated (Fig. 2I).
CHL1 inhibits cell motility and tumor metastasis
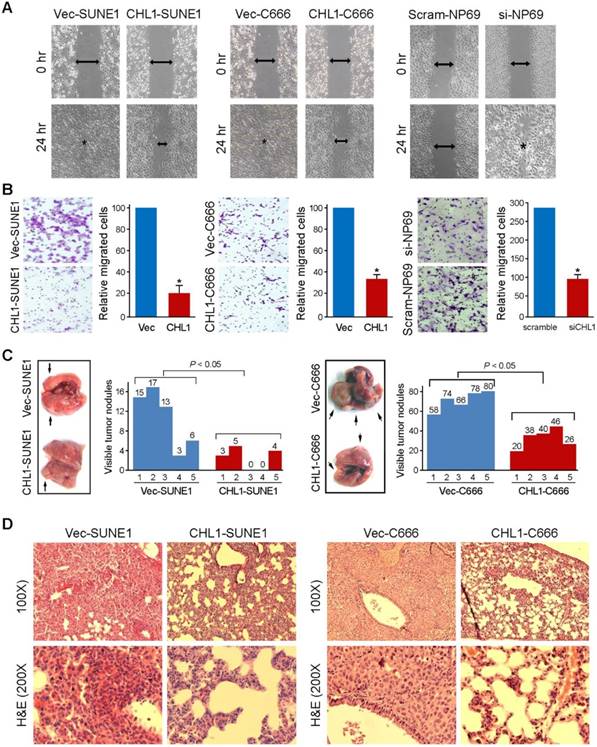
Wound-healing and cell invasion assays were used to study the effect of CHLI on cell motility. The wound-healing assay indicated that the ability of the cells to migrate in CHL1-transfected cells were significantly inhibited compared to non-transfected cells (Fig. 3A). The cell invasion assay showed that CHL1 could significantly inhibit the invasiveness of NPC cells in CHL1-transfected cells, compared to the non-transfected cells (P<0.05, Fig. 3B). In addition, experimental metastasis assay was used to study the in vivo effect of CHL1 on tumor metastasis. CHL1- transfected and non-transfected cells were injected into tail veins of SCID mice. The mice were sacrificed 8 weeks after to enumerate the metastatic nodules on the surface of lungs and livers. No visible metastatic nodules were observed on the surface of the liver. The appearance of nodules on the surface of the lungs significantly decreased in mice injected with CHL1-transfected cells compared to mice injected with non-transfected cells (P<0.05, independent Student's t test; Fig. 3C). H&E staining was performed on several sections of the lungs, and the results confirmed the nodules were metastatic tumors (Fig. 3D).
CHL1 inhibits migration and invasion in vitro and in vivo. (A) The cell migration rate between CHL1-expressing cells and control cells was compared by wound-healing assay. Microscopic observation was recorded at 0 and 24 hours after scratching the cell layer. The spreading speed of CHL1-expressing cells along the wound edge was slower than that in control cells. (B) Representative images showed the CHL1-expressing and control cells that invaded through the matrigel. Number of invaded tumor cells was quantified in the right panel (*P<0.05; Student's t-test). (C) Representatives of lungs derived from SCID mice after tail vein injection of CHL1 and vector transfected cells. The metastatic nodules at lung surface are indicated by arrows. The summary of metastatic nodules at liver surface is mean of six SCID mice for each group (* p<0.05; Student's t-test). (D) Representatives of H&E (upper) and IHC (lower) staining show lung tissue observed in SCID mice injected with vector (left) and CHL1 (right) cells, respectively; magnification 100× (upper) and 200× (lower).
CHL1 inhibits epithelial-mesenchymal transitions (EMT)
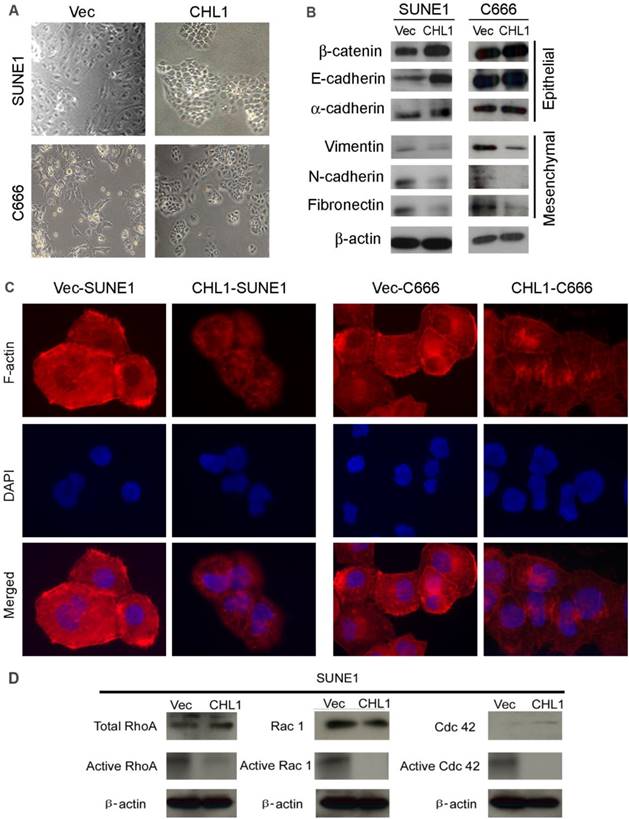
Morphological analysis showed that CHL1-transfected cells maintained highly organized cell-cell adhesion while non-transfected cells showed spindle-shaped morphology with undermined cell-cell contact, suggesting that CHL1 inhibit EMT (Fig. 4A). In order to test this hypothesis, Western blot analysis was performed to compare the expression of EMT markers between CHL1- transfected and non-transfected cells. The results showed that compared to the non-transfected cells the expression of epithelial markers in CHL1 transfected cells increased (E-cadherin, α-cadherin and β-catenin) while its expression decreased in mesenchymal markers (fibronectin, N-cadherin and vimentin) (Fig. 4B). This result was further authenticated by IF staining (Fig. 4C), confirming that CHL1 inhibit cell motility via the inhibition of EMT.
CHL1 inhibits epithelial-mesenchymal transitions (EMT) and formation of F-actin and activation of Rho/Rac1 GTPases. (A) Cell morphology of CHL1-transfected and vector-transfected cells. (B) Western blot analysis was used to compare expression levels of epithelial and mesenchymal markers between empty vector- and CHL1-transfected cells. β-actin was used as loading control. (C) Stress fiber, lamellipodia and filopodia were formed in vector-transfected cells, but not in CHL1-transfected cells (magnification 400×). (D) Total and active forms of Rho-GTPases, including RhoA, Rac1, and Cdc42, were compared with CHL1-transfected and vector-transfected cells. GTP-bound (active) forms of RhoA, Rac1, and Cdc42 were pulled down and detected by western blot. Active forms of RhoA and Rac1 were much lower in CHL1-transfected SUNE1 cell lines than that in vector-transfected cell lines.
CHL1 inhibits the activation of Rho-GTPase signaling
Studies had showed that the activation of Rho-GTPase signaling pathway induces the reorganization of cytoskeletons and subsequently disrupts the cell-cell adherent junctions, the effect of CHL1 on Rho-GTPase activity and cytoskeleton remodeling was therefore investigated. F-actin staining revealed that more stress fiber, lamellipodia and filopodia was observed in non-transfected cells, compared to CHL1-transfected cells (Fig. 4D), which suggests the migratory phenotype inhibited by CHL1 may be associated with Rho-GTPases activity. To test this hypothesis, pull-down assay was used to compare the amount of RhoA, Rac1 and Cdc42 (total and GTP-bound active form) between CHL1- transfected and non-transfected cells. Despite having similar level of total RhoA and Rac1in CHL1- transfected and non-transfected cells, the pulled down active forms of RhoA-GTP and Rac1-GTP were dramatically decreased in CHL1-transfected cells (Fig. 4D). Also, more amount of Cdc42-GTP was pulled down in non-transfected cells although the total Cdc42 was barely detectable in both non-and CHL1-transfected cells (Fig. 4D).
The interaction of CHL1 with Integrin β1
CHL1 has been reported to interact with Integrin β1, with its Integrin recognition domain on the cell surface [23]. Human Merlin encoded by NF2 is a magic molecule that functions as a linker to actin-cytoskeleton [24]. To study the relationship of these proteins, qPCR was performed (Fig. 5A). Additionally, Western blot was also used to analyze the expression of Integrin β1 in NPC cell lines (Fig. 5B). The mRNA levels of these three proteins were investigated by qPCR using non-paired clinical NPC tissues (Fig. 5D). A significant positive correlation was observed between CHL1 and Integrin β1 in paired and non-paired clinical tissues (Fig. 5E). Furthermore, the box plot showed that NPC tumors differed significantly from their paired tumor samples in the mean expression level of Integrin β1 (P=0.0006; Supplementary 1E & 1F). It was observed that the expressive tendency of Integrin β1 is the same with CHL1 in the clinical samples. Kaplan-Meier analysis showed that the down-regulation of Integrin β1 and Merlin was not correlated with Disease-Free Survival (DFS) time (P >0.05) in NPC patients, but results after 30 months of observation was different, as shown in the diagram (Supplementary 1C and Supplementary 1D). Moreover, the expression of Integrin β1 and Merlin were investigated in the non- transfected and CHL1transfected-cells by qPCR and western blot (Fig. 5C, Fig. 5G and Fig. 5F). To determine whether CHL1 interacts with Integrin β1 and Merlin, two-color immunofluorescence staining was performed to visualize their subcellular distribution in NP460 (Fig. 5H). The result revealed that CHL1 and Integrin β1 were co-localized on the cell membrane. To confirm the interaction of CHL1 and Integrin β1, we conducted a co-immunoprecipitation (co-IP) assay. The result showed that Integrin β1 and Merlin could be pulled down by CHL1 and vice versa, suggesting an interaction between the two proteins (Fig. 5I).
CHL1 interacts with Integrin β1 and Merlin. (A) qPCR analysis of CHL1, Integrin β1 and Merlin expression in three NPC cell lines (C666, CNE2 and SUNE1), NP 460 and NP69 cell lines. GAPDH was set as an internal control. (B) Western blot analysis of CHL1, Integrin β1 and Merlin expression in three NPC cell lines (C666, CNE2 and SUNE1), NP 460 and NP69. (C) Expression of CHL1, Integrin β1 and Merlin in CHL1-transfected SUNE1 and C666 was confirmed by Western blot. Empty vector-transfected cells were used as control. Expression of CHL1, Integrin β1 and Merlin between scramble and siCHL1 transfected NP69 cells was also confirmed by Western blot. (D) Expression of CHL1, Integrin β1 and Merlin in non-paired primary NPC cases was compared using qPCR with its non-tumor tissue (N). (E) A positive correlation between CHL1 and Integrin β1 expressions in non-paired tumor tissue was determined with linear regression lines and Pearson correlation significance (p<0.0001, Pearson correlation 0.4529). (F) The expression of integrin β1 was done by qPCR between vector and CHL1 transfected cell lines (**p<0.001, Student's t-test). (G) Merlin was done by qPCR between vector and CHL1 transfected cell lines (*p<0.05; **p<0.001, Student's t-test). (H) Distribution of CHL1 and Integrin β1 by IF. (I)The interaction of CHL1, Integrin β1 and Merlin were performed by Co-IP. (J) The expression of p-FAK, FAK, p-AKT, AKT and Snail was done by western blot between vector and CHL1 transfected cells, scramble and siCHL1 transfected NP69 cells.
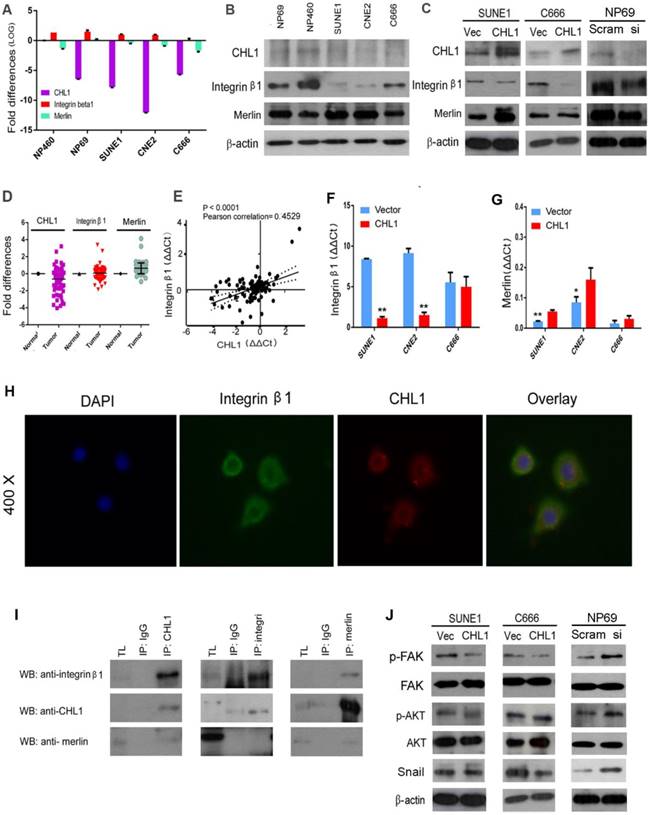
CHL1 inhibits Integrin β1-mediated activation of Akt signaling
To investigate how CHL1 affect Integrin β1-mediated Akt signaling pathway, western blot was performed. Compared to vector control, our analysis revealed that overexpression of CHL1 contributed to the reduction of phosphorylated FAK, and coincidentally decreased the downstream phosphorylation of Akt in CHLI-transfected cells (Ser473) (Fig. 5J). Conversely, increased phosphorylation of FAK and Akt was detected in CHL1-suppressed cells compared to NP69 cells (Fig. 5J). Overexpression of CHL1 in NPC cell lines was found to decrease the expression of 'Snail', whereas knock down of CHL1 increased its expression in NP69 cells. Collectively, the results of our findings indicated that CHL1 exerts the tumor-suppressive function in NPCs by regulating the Akt signaling pathway.
Discussion
In this study, a resident tumor suppressor gene CHL1, located on human chromosome 3p26.1, was reported to show tumor suppressive function in NPC. In this study, down-regulation of CHL1 was frequently detected in NPCs at transcriptional level, suggesting that this gene plays a crucial role in NPC carcinogenesis. The tumor-suppressive function of CHL1 was characterized in two NPC cell lines (SUNE1 and C666).
In all the NPC cell lines tested in which CHL1 was not expressed or poorly expressed, frequent methylation promoters were discovered, showing that methylation is a potential mechanism for silencing CHL1. The expression of CHL1 was restored after demethylation with 5'Aza. Both in vitro (cell growth rate and foci formation) and in vivo (tumor formation in nude mouse) assays showed that CHL1 has a potent inhibitory effect on nasopharyngeal carcinoma cells.
Molecular analysis revealed that the tumor-suppressive effect of CHL1 regulates cell cycle arrest at G1/S checkpoint by down-regulating cyclin D1, which is accumulating before S-phase and reaching its maximum. This process favors the movement of cells to the S-phase, making cyclin D1 a critical target of proliferative signals in G1. These results indicate that CHL1 could be required at G1/S transition in NPC cells.
CHL1 also showed strong inhibitory effects on cell motility, invasion and epithelial- mesenchymal transition. In the transition phase several of the epithelial markers were increased in the same process several mesenchymal markers were decrease in CHL1 transfected cells compared to non-transfected cells, which indicates the negative role of CHL1 in EMT. Also, it was revealed that CHL1 could disrupt F-actin formation by inactivation of Rac1/Cdc42, which is an important regulator in the formation of lamellipodia and filopodia.
During tumor initiation, invasion and metastasis, the activity of Rho GTPase would affect the construction of actin cytoskeleton and the interaction of adherent junctions in cytoskeleton [25-27]. The activities of RhoA, Rac and Cdc42 have been well defined in regulating the actin cytoskeleton [28]. Activation of RhoA could induce formation of stress fibers, Rac1 could induce lamellipodium, while Cdc42 could induce filopodia [29]. Actin cytoskeleton rearrangement promotes progression and metastasis of cancer by crossing the basement membrane and easily reaching distant organs. Therefore, we proposed that the down-regulation of CHL1 plays a vital role in NPC invasion and metastasis. Both in vitro and in vivo assays supported the hypothesis and these findings strongly suggest that the function of CHL1 could inhibit both cancer progression and metastasis.
Integrins are transmembrane α and β subunit comprising transmembrane receptors essential for the development and survival of organisms [30, 31]. Although the role of Integrin-mediated cell-matrix adhesions in metastasis had been recognized, Integrin β1 can also act as critical receptor for a well-known oncoprotein [32]. As a transmembrane glycoprotein, it could interact with CHL1- the integrin recognition sequence (SFT) on cell surfaces [33]. As suggested by immunofluorescence assay, Integrin β1 overlaps with CHL1 on the cell surface. The expressive tendency of Integrin β1 is the same with CHL1. In addition, the box plot demonstrated a significant difference in the expression level of integrin β1 between the nasopharyngeal carcinoma and non-tumor tissues, with a significant positive correlation observed between these two proteins.
Integrins activate FAK and trigger the fast recruitment of cytoskeletal proteins like talin and paxillin to its cytoplasmic domains [34]. Co-localized FAK, paxillin, integrins, tailin were found in the layer of the cell surface[35]. Talin is a highly molecular cytoskeleton protein, which is mainly concentrated in the lower cell contact area [36] and at the cell-cell contacts of lymphocytes. It can directly or indirectly link integrin to the actin skeleton through interaction with NYC and alpha actin [37, 38]. In addition, in vitro studies showed that integrin is associated with talus, although the affinity was low [39]. Talin also binds to vinculin, another cytoskeletal protein associated with cell adhesion. Talin has a large C-terminal domain containing alpha helices which binds to actin and an N-terminal FERM (band 4.1,ezrin, radixin, and moesin) domain with three subdomains: F1, F2, and F3[40-43]. The F3 subdomain contains the Integrin binding site with the highest affinity of integrin beta tails to activate integrins sufficiently. [44].
Ezrin, Radisin, Moesin (ERM) and NF2 type neurofibromatosis (NF2) constitute a distinct subfamily of cytoskeletal members, which belong to the 4.1 band protein family [45]. The ERM-NF2 protein has a conserved structure, an amino acid terminal domain, an extended alpha helix region and an actin binding carboxy terminal (C) region [46]. The FERM domain pocket is the competitive site of the C- terminal self-binding region of ERM protein, and this head to tail interaction leads to "closed" monomer or in dimers. When in closed conformation the biding sites for FERM ligands and the actin is blocked, the inactive ERM is most likely confined in the cytoplasm [47, 48]. During the phosphorylation of a conserved C-terminal Thr residue [49], the ERM proteins are in the open conformation, which could link plasma membrane proteins to the actin cyto skeleton[50]. While in contrast an overlapping view is observed condition when it binds to Merlin.
Human Merlin encoded by NF2 is a magic molecule that functions as a linker to actin-cytoskeleton [24] and as a tumor suppressor in many brain cancers, including schwannomas [51], meningioma[52-57], and ependymomas [51, 58]. By using the pull-down assay the relationship between CHL1, Integrin-β1, and Merlin has been demonstrated. When CHL1 is lost, integrin beta1-AKT pathway would be activated by phosphorylation and inactivation of Merlin, so that CHL1 it no longer plays its tumor suppressive role (Fig. 6).
Proposed model illustrating the roles of CHL1 during NPC carcinogenesis.
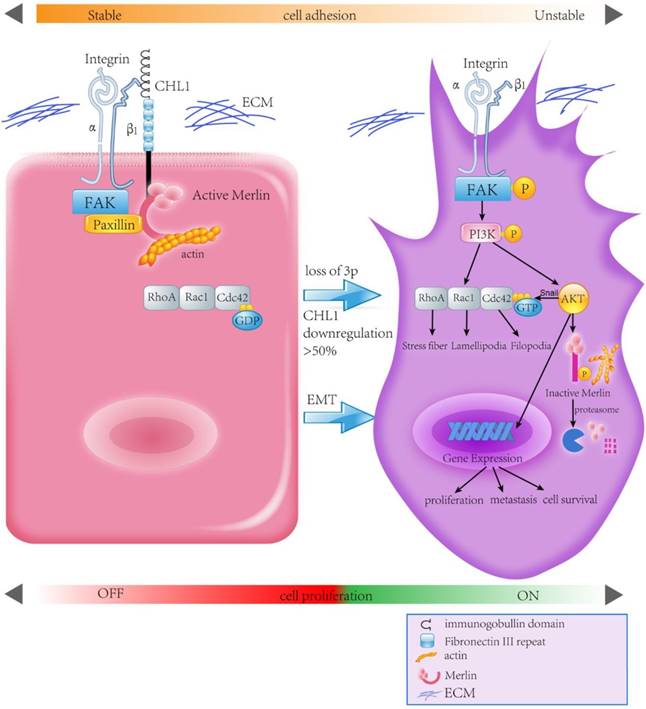
In conclusion, this study reveals CHL1 as a tumor suppressor gene for both nasopharyngeal carcinoma progression and metastasis. CHL1 plays this role through a mechanism involving the interaction of Integrin β1 and Merlin, and subsequently the inactivation of a host of downstream signaling cascades, called the PI3K/Akt pathway. In view of the important role of Akt and Merlin in the development of tumor, a more comprehensive understanding of the mechanism of CHL1 in nasopharyngeal carcinoma will provide a more effective therapeutic strategy for the treatment of nasopharyngeal cancer patients.
Supplementary Material
Supplementary figures and tables.
Acknowledgements
Immortal nasopharyngeal epithelial cell lines NP69, NP 460 were kindly provided by Prof. George S. W. Tsao from the Department of Anatomy, The University of Hong Kong, Hong Kong, China.
Authors' Contributions
Conceptualization: Juan Chen, Cai-Lei Zhu, Xin-Yuan Guan
Methodology: Juan Chen, Cai-Lei Zhu, Wai-Man Liu, Li Fu, Li-Yi Zhang, Jin-Na Chen
Data curation: Juan Chen, Yan-Qun Xiang, Dora Lai-Wan Kwong, Xin-Yuan Guan
Formal analysis: Juan Chen, Cai-Lei Zhu, Yan-Qun Xiang, Chen Jiang, Li-Yi Zhang, Ming Liu, Chen Jiang
Writing - original draft: Juan Chen, Li Fu, Chen Jiang, Dora Lai-Wan Kwong, Xin-Yuan Guan
Writing - review and editing: Juan Chen, Chen Jiang, Xin-Yuan Guan
Investigation and resources: Ming Liu, Ling-Xi Jiang, Qian Chen, Chao Chen, Bo Wang, Hong Tang
Funding acquisition, project administration supervision: Dora Lai-Wan Kwong, Xin-Yuan Guan
Competing Interests
The authors have declared that no competing interest exists.
References
1. Tao Q, Chan AT. Nasopharyngeal carcinoma: molecular pathogenesis and therapeutic developments. Expert Rev Mol Med. 2007;9:1-24
2. Young LS, Rickinson AB. Epstein-Barr virus: 40 years on. Nat Rev Cancer. 2004;4:757-68
3. Busson P, Keryer C, Ooka T, Corbex M. EBV-associated nasopharyngeal carcinomas: from epidemiology to virus-targeting strategies. Trends Microbiol. 2004;12:356-60
4. McDermott AL, Dutt SN, Watkinson JC. The aetiology of nasopharyngeal carcinoma. Clin Otolaryngol Allied Sci. 2001;26:82-92
5. Feng BJ, Huang W, Shugart YY, Lee MK, Zhang F, Xia JC. et al. Genome-wide scan for familial nasopharyngeal carcinoma reveals evidence of linkage to chromosome 4. Nat Genet. 2002;31:395-9
6. Huang DP, Ho JH, Chan WK, Lau WH, Lui M. Cytogenetics of undifferentiated nasopharyngeal carcinoma xenografts from southern Chinese. Int J Cancer. 1989;43:936-9
7. Shih-Hsin Wu L. Construction of evolutionary tree models for nasopharyngeal carcinoma using comparative genomic hybridization data. Cancer Genet Cytogenet. 2006;168:105-8
8. Tai AL, Mak W, Ng PK, Chua DT, Ng MY, Fu L. et al. High-throughput loss-of-heterozygosity study of chromosome 3p in lung cancer using single-nucleotide polymorphism markers. Cancer Res. 2006;66:4133-8
9. Qin YR, Fu L, Sham PC, Kwong DL, Zhu CL, Chu KK. et al. Single-nucleotide polymorphism-mass array reveals commonly deleted regions at 3p22 and 3p14.2 associate with poor clinical outcome in esophageal squamous cell carcinoma. Int J Cancer. 2008;123:826-30
10. Hung J, Kishimoto Y, Sugio K, Virmani A, McIntire DD, Minna JD. et al. Allele-specific chromosome 3p deletions occur at an early stage in the pathogenesis of lung carcinoma. JAMA. 1995;273:558-63
11. Hu N, Roth MJ, Polymeropolous M, Tang ZZ, Emmert-Buck MR, Wang QH. et al. Identification of novel regions of allelic loss from a genomewide scan of esophageal squamous-cell carcinoma in a high-risk Chinese population. Genes Chromosomes Cancer. 2000;27:217-28
12. Rathjen FG, Rutishauser U. Comparison of two cell surface molecules involved in neural cell adhesion. EMBO J. 1984;3:461-5
13. Grumet M, Mauro V, Burgoon MP, Edelman GM, Cunningham BA. Structure of a new nervous system glycoprotein, Nr-CAM, and its relationship to subgroups of neural cell adhesion molecules. J Cell Biol. 1991;113:1399-412
14. Angeloni D, Lindor NM, Pack S, Latif F, Wei MH, Lerman MI. CALL gene is haploinsufficient in a 3p- syndrome patient. Am J Med Genet. 1999;86:482-5
15. Frints SG, Marynen P, Hartmann D, Fryns JP, Steyaert J, Schachner M. et al. CALL interrupted in a patient with non-specific mental retardation: gene dosage-dependent alteration of murine brain development and behavior. Hum Mol Genet. 2003;12:1463-74
16. Sakurai K, Migita O, Toru M, Arinami T. An association between a missense polymorphism in the close homologue of L1 (CHL1, CALL) gene and schizophrenia. Mol Psychiatry. 2002;7:412-5
17. Manderson EN, Birch AH, Shen Z, Mes-Masson AM, Provencher D, Tonin PN. Molecular genetic analysis of a cell adhesion molecule with homology to L1CAM, contactin 6, and contactin 4 candidate chromosome 3p26pter tumor suppressor genes in ovarian cancer. Int J Gynecol Cancer. 2009;19:513-25
18. He LH, Ma Q, Shi YH, Ge J, Zhao HM, Li SF. et al. CHL1 is involved in human breast tumorigenesis and progression. Biochem Biophys Res Commun. 2013;438:433-8
19. Gavert N, Vivanti A, Hazin J, Brabletz T, Ben-Ze'ev A. L1-mediated colon cancer cell metastasis does not require changes in EMT and cancer stem cell markers. Mol Cancer Res. 2011;9:14-24
20. Raveh S, Gavert N, Ben-Ze'ev A. L1 cell adhesion molecule (L1CAM) in invasive tumors. Cancer Lett. 2009;282:137-45
21. Jung J, Son YS, Park H, Jeon SK, Lee JW, Choi SY. et al. The cell adhesion molecule L1 promotes gallbladder carcinoma progression in vitro and in vivo. Oncol Rep. 2011;25:945-52
22. Rokman A, Baffoe-Bonnie AB, Gillanders E, Fredriksson H, Autio V, Ikonen T. et al. Hereditary prostate cancer in Finland: fine-mapping validates 3p26 as a major predisposition locus. Hum Genet. 2005;116:43-50
23. Buhusi M, Midkiff BR, Gates AM, Richter M, Schachner M, Maness PF. Close homolog of L1 is an enhancer of integrin-mediated cell migration. J Biol Chem. 2003;278:25024-31
24. James MF, Manchanda N, Gonzalez-Agosti C, Hartwig JH, Ramesh V. The neurofibromatosis 2 protein product merlin selectively binds F-actin but not G-actin, and stabilizes the filaments through a lateral association. Biochem J. 2001;356:377-86
25. Sit ST, Manser E. Rho GTPases and their role in organizing the actin cytoskeleton. Journal of cell science. 2011;124:679-83
26. Aepfelbacher M, Zumbihl R, Heesemann J. Modulation of Rho GTPases and the actin cytoskeleton by YopT of Yersinia. Current topics in microbiology and immunology. 2005;291:167-75
27. Begum R, Nur EKMS, Zaman MA. The role of Rho GTPases in the regulation of the rearrangement of actin cytoskeleton and cell movement. Experimental & molecular medicine. 2004;36:358-66
28. Lozano E, Betson M, Braga VM. Tumor progression: Small GTPases and loss of cell-cell adhesion. BioEssays: news and reviews in molecular, cellular and developmental biology. 2003;25:452-63
29. Hall A. Rho GTPases and the actin cytoskeleton. Science. 1998;279:509-14
30. Giancotti FG, Ruoslahti E. Integrin signaling. Science. 1999;285:1028-32
31. Takagi J, Petre BM, Walz T, Springer TA. Global conformational rearrangements in integrin extracellular domains in outside-in and inside-out signaling. Cell. 2002;110:599-11
32. Aguirre Ghiso JA, Kovalski K, Ossowski L. Tumor dormancy induced by downregulation of urokinase receptor in human carcinoma involves integrin and MAPK signaling. The Journal of cell biology. 1999;147:89-104
33. Wei MH, Karavanova I, Ivanov SV, Popescu NC, Keck CL, Pack S. et al. In silico-initiated cloning and molecular characterization of a novel human member of the L1 gene family of neural cell adhesion molecules. Human genetics. 1998;103:355-64
34. Lim ST, Chen XL, Tomar A, Miller NL, Yoo J, Schlaepfer DD. Knock-in mutation reveals an essential role for focal adhesion kinase activity in blood vessel morphogenesis and cell motility-polarity but not cell proliferation. The Journal of biological chemistry. 2010;285:21526-36
35. Kanchanawong P, Shtengel G, Pasapera AM, Ramko EB, Davidson MW, Hess HF. et al. Nanoscale architecture of integrin-based cell adhesions. Nature. 2010;468:580-4
36. Burridge K, Connell L. A new protein of adhesion plaques and ruffling membranes. The Journal of cell biology. 1983;97:359-67
37. Kupfer A, Singer SJ, Dennert G. On the mechanism of unidirectional killing in mixtures of two cytotoxic T lymphocytes. Unidirectional polarization of cytoplasmic organelles and the membrane-associated cytoskeleton in the effector cell. The Journal of experimental medicine. 1986;163:489-98
38. Burn P, Kupfer A, Singer SJ. Dynamic membrane-cytoskeletal interactions: specific association of integrin and talin arises in vivo after phorbol ester treatment of peripheral blood lymphocytes. Proceedings of the National Academy of Sciences of the United States of America. 1988;85:497-501
39. Horwitz A, Duggan K, Buck C, Beckerle MC, Burridge K. Interaction of plasma membrane fibronectin receptor with talin-a transmembrane linkage. Nature. 1986;320:531-3
40. Chishti AH, Kim AC, Marfatia SM, Lutchman M, Hanspal M, Jindal H. et al. The FERM domain: a unique module involved in the linkage of cytoplasmic proteins to the membrane. Trends in biochemical sciences. 1998;23:281-2
41. Garcia-Alvarez B, de Pereda JM, Calderwood DA, Ulmer TS, Critchley D, Campbell ID. et al. Structural determinants of integrin recognition by talin. Molecular cell. 2003;11:49-58
42. Papagrigoriou E, Gingras AR, Barsukov IL, Bate N, Fillingham IJ, Patel B. et al. Activation of a vinculin-binding site in the talin rod involves rearrangement of a five-helix bundle. The EMBO journal. 2004;23:2942-51
43. Rees DJ, Ades SE, Singer SJ, Hynes RO. Sequence and domain structure of talin. Nature. 1990;347:685-9
44. Calderwood DA, Yan B, de Pereda JM, Alvarez BG, Fujioka Y, Liddington RC. et al. The phosphotyrosine binding-like domain of talin activates integrins. The Journal of biological chemistry. 2002;277:21749-58
45. Bretscher A, Edwards K, Fehon RG. ERM proteins and merlin: integrators at the cell cortex. Nature reviews Molecular cell biology. 2002;3:586-99
46. Terawaki S, Maesaki R, Hakoshima T. Structural basis for NHERF recognition by ERM proteins. Structure. 2006;14:777-89
47. Gary R, Bretscher A. Ezrin self-association involves binding of an N-terminal domain to a normally masked C-terminal domain that includes the F-actin binding site. Molecular biology of the cell. 1995;6:1061-75
48. Reczek D, Bretscher A. The carboxyl-terminal region of EBP50 binds to a site in the amino-terminal domain of ezrin that is masked in the dormant molecule. The Journal of biological chemistry. 1998;273:18452-8
49. Matsui T, Maeda M, Doi Y, Yonemura S, Amano M, Kaibuchi K. et al. Rho-kinase phosphorylates COOH-terminal threonines of ezrin/radixin/moesin (ERM) proteins and regulates their head-to-tail association. The Journal of cell biology. 1998;140:647-57
50. Fehon RG, McClatchey AI, Bretscher A. Organizing the cell cortex: the role of ERM proteins. Nature reviews Molecular cell biology. 2010;11:276-87
51. Gutmann DH, Giordano MJ, Fishback AS, Guha A. Loss of merlin expression in sporadic meningiomas, ependymomas and schwannomas. Neurology. 1997;49:267-70
52. Kimura Y, Koga H, Araki N, Mugita N, Fujita N, Takeshima H. et al. The involvement of calpain-dependent proteolysis of the tumor suppressor NF2 (merlin) in schwannomas and meningiomas. Nature medicine. 1998;4:915-22
53. James MF, Han S, Polizzano C, Plotkin SR, Manning BD, Stemmer-Rachamimov AO. et al. NF2/merlin is a novel negative regulator of mTOR complex 1, and activation of mTORC1 is associated with meningioma and schwannoma growth. Molecular and cellular biology. 2009;29:4250-61
54. Striedinger K, VandenBerg SR, Baia GS, McDermott MW, Gutmann DH, Lal A. The neurofibromatosis 2 tumor suppressor gene product, merlin, regulates human meningioma cell growth by signaling through YAP. Neoplasia. 2008;10:1204-12
55. Perry A, Cai DX, Scheithauer BW, Swanson PE, Lohse CM, Newsham IF. et al. Merlin, DAL-1, and progesterone receptor expression in clinicopathologic subsets of meningioma: a correlative immunohistochemical study of 175 cases. Journal of neuropathology and experimental neurology. 2000;59:872-9
56. Ikeda K, Saeki Y, Gonzalez-Agosti C, Ramesh V, Chiocca EA. Inhibition of NF2-negative and NF2-positive primary human meningioma cell proliferation by overexpression of merlin due to vector-mediated gene transfer. Journal of neurosurgery. 1999;91:85-92
57. Maxwell M, Shih SD, Galanopoulos T, Hedley-Whyte ET, Cosgrove GR. Familial meningioma: analysis of expression of neurofibromatosis 2 protein Merlin. Report of two cases. Journal of neurosurgery. 1998;88:562-9
58. Buccoliero AM, Castiglione F, Rossi Degl'Innocenti D, Sardi I, Genitori L, Taddei GL. Merlin expression in pediatric anaplastic ependymomas real time PCR study. Fetal and pediatric pathology. 2010;29:245-54
Author contact
![]() Corresponding author: Xin-Yuan Guan, Department of Clinical Oncology, The University of Hong Kong, Room L10-56, Laboratory Block, 21 Sassoon Road, Pokfulam, Hong Kong, Tel: 852-3917-9782, E-Mail: xyguanhk; or Dora Lai-Wan Kwong, Department of Clinical Oncology, University of Hong Kong, 1/F, Professorial Block, Queen Mary Hospital, Hong Kong, Tel: 852-28554521, E-mail: dlwkwonghk.
Corresponding author: Xin-Yuan Guan, Department of Clinical Oncology, The University of Hong Kong, Room L10-56, Laboratory Block, 21 Sassoon Road, Pokfulam, Hong Kong, Tel: 852-3917-9782, E-Mail: xyguanhk; or Dora Lai-Wan Kwong, Department of Clinical Oncology, University of Hong Kong, 1/F, Professorial Block, Queen Mary Hospital, Hong Kong, Tel: 852-28554521, E-mail: dlwkwonghk.