International Journal of Biological Sciences
ISSN: 1449-2288
10
Impact Factor
ISSN: 1449-2288

 Global reach, higher impact
Int J Biol Sci 2019; 15(9):1921-1932. doi:10.7150/ijbs.33274 This issue Cite
Research Paper
A kind of integrated serial algorithms for noise reduction and characteristics expanding in respiratory sound
Fei Meng1, Yixuan Wang1, Yan Shi1,2 ![]() , Hongmei Zhao3
, Hongmei Zhao3
1. School of Automation Science and Electrical Engineering, Beihang University, Beijing 100191, China
2. The State Key Laboratory of Fluid Power Transmission and Control, Zhejiang University, Hangzhou 310058, China
3. Department of Pulmonary and Critical Care Medicine, China-Japan Friendship Hospital
Received 2019-1-18; Accepted 2019-5-5; Published 2019-7-21
Citation:
Meng F, Wang Y, Shi Y, Zhao H. A kind of integrated serial algorithms for noise reduction and characteristics expanding in respiratory sound. Int J Biol Sci 2019; 15(9):1921-1932. doi:10.7150/ijbs.33274. https://www.ijbs.com/v15p1921.htm
Other stylesAbstract

The computer‑based lung respiratory sound analysis, which can provide more information about the condition of lung station, has achieved a great development in recent years. However, the external noise in respiratory sound signal is a large restriction to the further promotion of this technique. In this paper, a kind of serial integrated de-noising algorithms which consist of a FIR band-pass filter and a modified wavelet filter and an adaptive filter, is proposed to suppress the noise in respiratory sound signals. The design of this kind of filter and its practical application are studied. The practical application in de-noise of the lung sound shows that this filter has a good de-noising effect and a good performance in outstanding the acoustic characteristics.
Keywords: respiratory sounds, de-noising algorithm, band-pass filter, wavelet, adaptive filter
Introduction
Respiratory sounds can provide much information about the condition of lung station, and they are a kind of nonlinear and non‑stationary signals. The auscultation of lung sounds provides a point of reference for the diagnose of respiratory diseases, like pneumonia, bronchitis and sleep apnea [1]. Most of the auscultation of lung sounds and diagnose of respiratory disorders, traditionally, depend on the medical skills and diagnostic experience of physicians. In the last decades of years, the computer‑based respiratory sound technique has achieved a great development to serve as a more effective and general tool in the diagnose of lung abnormalities [2].
In recent years, the electronic stethoscope has been widely used in the field of lung sound analysis, with its unique feature of digitalization and high sensitivity similar to the traditional stethoscope. Some mature products like, 3M Littmann, have emerged on the market. However, the external interference which is produced by high-frequency and low-frequency environmental noises, human voices and heart sounds, is a large restriction to the lung sound collected by electronic stethoscopes in the field of auscultation and further research. Hence, the noise reduction becomes a crucial step of lung-sound signals processing.
The traditional approach to the problem is to use a linear high-pass filter with a cutoff frequency from 50Hz to 150Hz. However, because the frequency of lung sounds is in the range of 20Hz to 1600Hz [3], overlapping the frequency of heart sounds varying from 20Hz to 150Hz [4,5]. Therefore, a single high-pass linear filter is bound to cause the distortion of the respiratory sounds, which is not effective in the problem. The 3M Littmann electronic stethoscope shows good de-noising effect in mid-frequency and high-frequency bands. However, some components in overlapping frequency region in low frequency domain are degraded in the signals measured by the products, which produces a certain degree of distortion of lung sounds.
To achieve better performance on de-noising, researchers have developed two basic approaches for noise reduction: the wavelet shrinkage de-noising and the adaptive filtering algorithm.
Thanks to the mature technology and low-complexity, wavelet transform is widely used in the medical-signal process, for example [6,7,8,9]. In the field of respiratory sound de-noising, the wavelet shrinkage de-noising also plays a significant role. M Bahoura et al [10] proposed a new technique for de-noising lung sounds based on the wavelet packet, which can reduce the noise without distortion of the original sound. Hossain I et al [11] investigated the spectral characteristics of the lung sound signals through wavelet transform filters and found that the filters reduce the lung sound average power greatly over the whole frequency range.
The adaptive filter, which is used by many researchers, is another de-noising algorithm in respiratory sound. Sankar et al [12] compared the de-noising effect of several different types of adaptive filters applied on the model respiratory sound with second order Auto Regressive process. However, the adaptive filter is usually utilized to reduce heart sounds, for the good de-noising effect, without significantly affecting the components of lung sounds in low-frequency region. This method applied in heart sound reduction is generally considered to be proposed by Iyer et al [4] to use an adaptive filter with an 'augmented electrocardiogram (ECG)' signal as reference signal to reduce heart sounds by 50-80 percent. But the import of external ECG signal makes the filter inconvenience to use. Hence, Kompis et al [13] modified the algorithm model to get an adaptive filter which needs only a single microphone as input. Heart noises (HN) can be reduced moderately by 24% to 49% using this method. To improve the HN reduction, an adaptive filter combined with the fourth-order statistics (FOS) was proposed by Hadjileontiadis and Panas [14]. The HN reduction of this algorithm is more than 90%, at the expense of algorithm complexity. In addition, Hadjileontiadis and Panas[15] proposed a new type of adaptive filter based on wavelet transform (WT), combining the method of an adaptive filter and wavelet composition, which has an efficient reduction of heart noises.
In this paper, a Type I Chebyshev band-pass filter with a pass-band from 20Hz to 1600Hz is firstly proposed to reduce the noise of the lung respiratory sounds under the low frequency and high frequency environment. Next, we put forward a unification wavelet threshold de-noising method to reduce the environmental noises further and to mitigate the second heart sound and human voice. Last, an adaptive noise cancellation filter is designed to reduce the heart sounds. The following sections will discuss the configuration and the practical experiment practical in the experiment signals collected from eleven patients in the hospital.
Lung sound signal acquisition
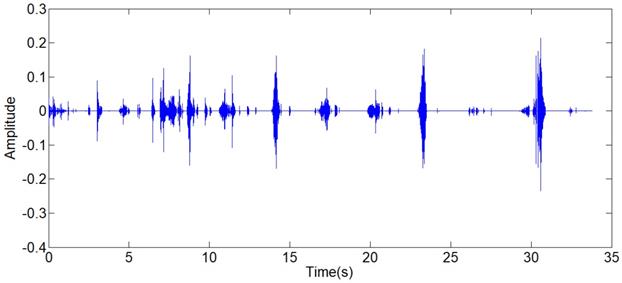
The lung sound signals are recorded by the equipment designed and assembled by the research team, as shown in Fig 1. The main component of the set of sound measurement equipment is a highly sensitive noise transducer fixed in a short piece of plastic tubing connected to a stethoscope chest piece. The sensitivity of transducer is -36dB and the frequency response is 5Hz to 100kHz. The input impedance is more than 5G ohms and the output impedance is less than 110 ohms. The other part of the system is consisted of a power supply circuit of the transducer, a 32-bit sound card used to collect the digital signal and a computer for data storage. The sampling frequency of the sound card is 48000Hz. The study was conducted in the hospital on eleven patients with moist rales, dry rales and normal lung sounds. An example of lung sounds is used to analyze the de-noising algorithm as shown in Fig 2(a), which is defined as the standard signal in this paper, while the other samples are used to verify the effect of the algorithm and adjust algorithm parameters. The main parameters of the signal device are shown as follows.
De-noising Algorithm
The structure of the overall serial integrated algorithms is shown in Fig 3, combined with a FIR band-pass filter, a modified wavelet filter and an adaptive filter. The type I Chebyshev band-pass filter is designed to decrease the high frequency and low frequency environmental noises. The modified wavelet filter can reduce the environmental noises further and mitigate the second heart sounds and human voices. The least-mean-square (LMS) adaptive filter with the modified reference signal is used to decrease the influence of the heart sounds. The principle of the serial integrated filter is introduced in this chapter.
Type I Chebyshev band-pass filter
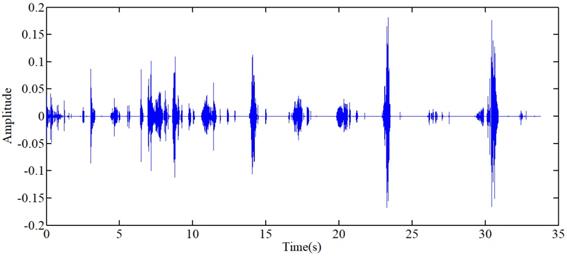
Influenced by the environment factors, device factors and physical factors, the noise of lung sounds collected is concentrated in the low-frequency and high frequency. To eliminate the main part of low-frequency and high-frequency noises, we choose a type I Chebyshev band-pass filter for ensuring a steep roll-off frequency. The frequency spectrum (see Fig 3.b) shows that the frequency of original signals varies from 0Hz to 500Hz. For retaining the whole frequency domain of the lung sounds, the pass-band of FIR filter is set from 15Hz to 1700Hz. The output of the filter is shown in Fig 4.
Figure 1
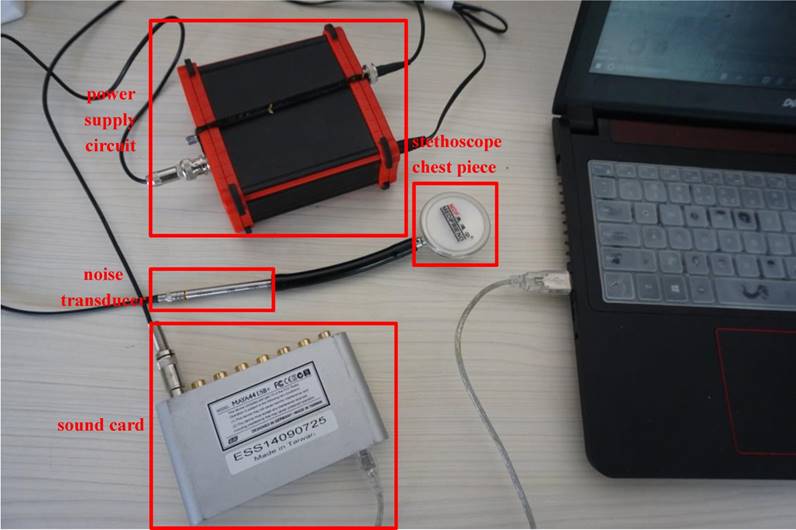
respiratory sound recorded equipment
Figure 2
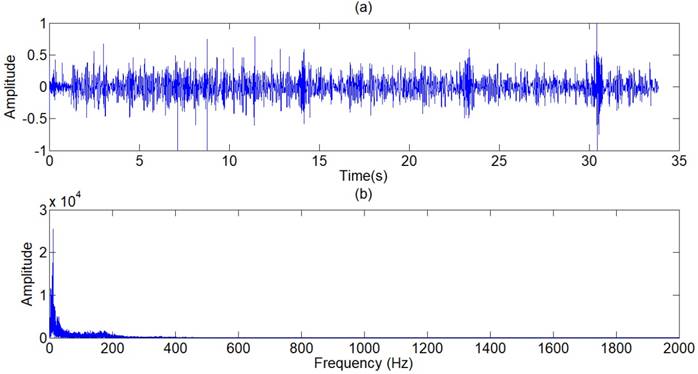
(a) Standard signal, (b) Frequency spectrum of standard signal.
Figure 3
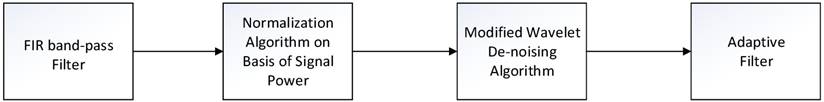
Configuration of the proposed serial integrated algorithm
Figure 4
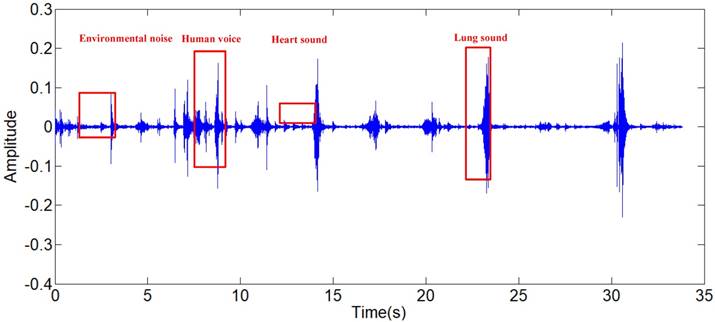
Output signal of FIR filter
Figure 5
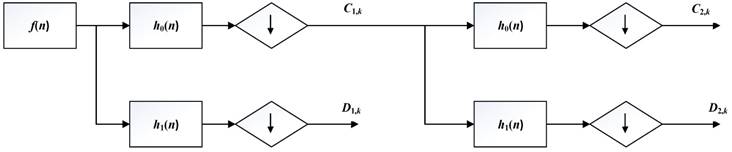
Structure of MALLAT algorithm
Modified wavelet threshold de-noising method
Wavelet decomposition
The wavelet transform is defined as:
(1)
where a is the dyadic dilation, b is the dyadic position, and the wavelet mother functionφ(x) is defined as:
(2)
The discrete wavelet transform (DWT) is
(3)
if the dyadic dilation a0=2 and the dyadic position b0=1, the DWT is called 2-band wavelet transform.
But the DWT still has high calculation complexity. Figure 5 shows the process of MALLAT algorithm which is a simple algorithm of wavelet decomposition. The signal f(n) to be decomposed is filtered by high-frequency filter h0(n) and low-frequency filter h1(n). Then the filtered signals are down-sampled to get the wavelet coefficients  and approximation coefficients
  where j and k are respectively the dyadic dilation and dyadic position. The step of ↓ means the process of down-sampling. In the next layer of wavelet decomposition, the approximation coefficients of former layer are transformed as the signal to be decomposed and processed in the same way. The relationship of the two filters is
(4)
In the MALLAT algorithm, the signal is firstly through periodic extension, to eliminate the boundary effect, as
(5)
where srcLen is the length of the signal, filterLent is the length of the filter ho and h1.
Then the signal is filtered by the high frequency filter and low frequency filter to get the wavelet coefficients and approximation coefficients. After the filters, the signal is down-sampled and a signal with half of the length is gotten.
(6)
(7)
After one step of decomposition, the approximation coefficients are processed in the same way to get wavelet coefficients and approximation coefficients in the next layer. After n steps of iteration, the signal is decomposed into n groups of wavelet coefficients and one group of approximation coefficients. The wavelet reconstruction is the inverse operation of wavelet decomposition.
Wavelet threshold de-noising algorithm
The concept of the wavelet transform de-noising was firstly proposed by Hadjileontiadis [14,15] and Panas [16], assuming that the wavelet coefficients of the “nonstationary” part is much lower than that of “stationary” part. Among the wavelet transform de-noising algorithms, the most widely used one is the wavelet threshold de-noising algorithm, which was firstly proposed by Donoho[17, 18]. A contaminated signal with finite length is assumed to be expressed as:
(8)
where fi is the desired signal, zi is the Gaussian noise with zero mean and variance σ2, which is independent from the desired signal fi.
Transform the noisy signal yi by discrete wavelet transform (DWT). Let W be a left invertible wavelet transformation matrix of the DWT [19]. Then the Eq can be written as
(9)
where Y=Wy is the wavelet coefficients of noisy signal yi, F=Wf is the wavelet coefficients of the uncontaminated signal fi, Z=Wz is the wavelet coefficients of noise signal zi. The basic idea of wavelet threshold de-noising is to zero the wavelet coefficients belonging to the noise Z, while keep the wavelet coefficients belonging to the useful signal F, and the filtered signal approximates the desired signal fi.
The wavelet thresholding consists of two methods: hard thresholding
(10)
and soft thresholding.
(11)
where Ŷ is the estimation of wavelet coefficients Y. The filtered signal x can be obtained by inverse DWT:
(12)
Several selection methods of threshold value play an important role in wavelet de-noising. Donoho proposed the thresholding rule [17]:
(13)
where N is the number of sampled points. While Guoxiang[18] et al proposed the thresholding rule
(14)
where j is the DWT scale. However, sound signals are highly sensitive to the thresholding value selection. An excessive thresholding value can lead to the distortion of sound signals, while a small thresholding value may not achieve a good filtering result. Therefore, the selection of thresholding values in this research cannot depend on a single fixed formula.
In this research, a coif2 wavelet basis is chosen. The signal s is decomposed to 9 layers, as shown in Fig 6, and nine sub-signals si is reconstructed by each layer of wavelet coefficients. The relationship of the original signal s and sub-signals si is given by:
(15)
At the low resolutions (layer 1 and 2), there are only coefficients belonging to the noise at the high frequency domain. Therefore, the hard threshold method can be used to eliminate the high frequency noises directly. At most resolutions (layer 3,4,5,6,9), the proportion of useful signal components is higher, so the soft threshold method is chosen to avoid pseudo Gibbs phenomena. The selection of threshold value, as shown in Table 1, depends on the repeated adjustment based on the low distortion and high de-noising effect rather than any fixed formula. The majority components of the lung sound signal concentrate in the layer 7 and 8. A small deviation between the threshold value and ideal value may lead to a great distortion. Therefore, to ensure the low distortion of lung sound, the sub-signal is not processed by threshold de-noising filtered but the type I Chebyshev band-pass filter with the band-pass from 20Hz to 1600Hz to eliminate the noises beyond the frequency band. The reconstructed signal is shown in Fig 8, in which, the high-frequency and low-frequency noises, human voices and second heart sounds are largely reduced.
Figure 6
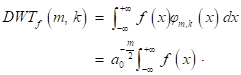
(a) ~(f) Wavelet coefficients of standard signal CD1~CD6, (j) Approximation coefficients of standard signal CA9.
Figure 7
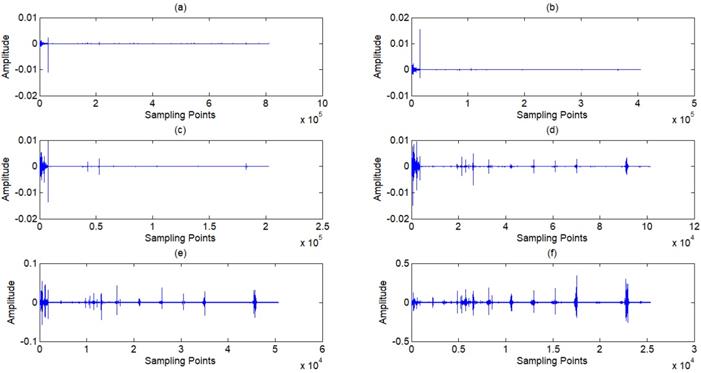
(a) ~(c) Wavelet coefficients of standard signal CD7~CD9, (d) Approximation coefficients of standard signal CA9
Figure 8
Reconstructed signal of wavelet filter
Table 1
Selection of threshold type and threshold value
| Wavelet Decomposition Layer | Hard Threshold or Soft Threshold (H/S) | Threshold Value |
|---|---|---|
| CD1 | H | 0.01 |
| CD2 | H | 0.05 |
| CD3 | S | 0.05 |
| CD4 | S | 0.001 |
| CD5 | S | 0.002 |
| CD6 | S | 0.005 |
| CD9 | S | 0.08 |
| CA9 | S | 0.3 |
The threshold value is determined on the basis of the standard signal in this paper. However, the signal strength has a considerable difference with the standard signal for the different patient situations and measurement environments, which leads to the different selection of threshold value. The phenomenon limits the generalization of the algorithm among different signals collected. To solve the problem, a normalization method based on the power of signals is proposed. The power of a discrete signal is given by
(16)
where, x[n] is the sampling points of the signal, N is the length of signal acquired. The original signal is normalized by
(17)
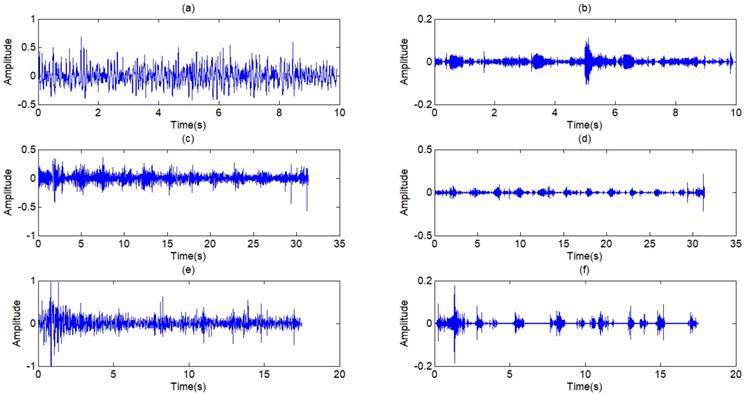
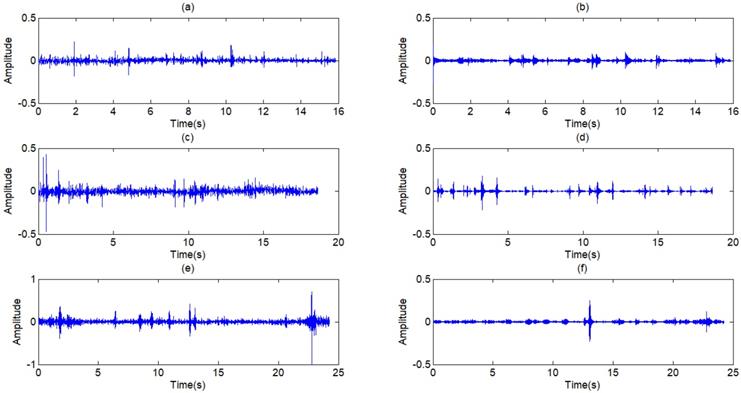
where, P1 is the power of standard signal. s is the signal to be processed. P2 is the power of the signal to be processed. Because the arrangement can reduce the effect of environmental noises on the power of signal, the step of normalization is arranged after the step of Chebyshev band-pass filter, as shown in Fig 3. Through this method, the strength of original signals is set to the similar magnitude of the standard signal, and the threshold value can be generalized on the signals with different signal strengths. There are three other signals acquired shown in Fig 9, which have similarly favorable de-noising effect. The first signal and the third signal belong to dry rales. The second signal belongs to the normal lung sound.
Figure 9
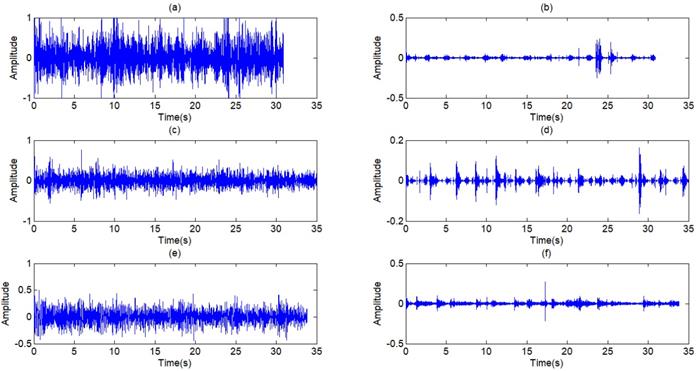
(a),(c),(e) The other three typical respiratory sounds, (b),(d),(f) The filtered signals of the three signals
Figure 10
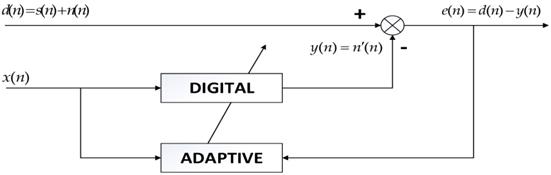
Principle of adaptive filter
Adaptive filter
Because the frequency of heart sounds overlaps with the low-frequency component of lung sounds, the filtering algorithms in frequency domain are not effective in this situation. The main approach in recent years to the problem is the adaptive filter. In this paper, a least-mean-square (LMS) adaption algorithm referring to [7,16,21] is modified to reduce the first heart sound. The block diagram of the algorithm is shown in Fig 10.
The obtained signal d(n) is the output signal of the wavelet threshold filter containing the desired the pure lung sound signal s(n) and the first heart sound n(n) as inference. The reference signal x(n), which is linearly related with the inference signal n(n), is obtained from the signal d(n). The estimated signal n'(n) is calculated through the Finite Impulse Response (FIR) filter by the reference signal x(n). The bias signal e(n) is obtained by the estimated signal n'(n) from the corrupted signal d(n). The coefficients of FIR filter are adjusted by the bias signal on cost function ξ(n) to make the estimated signal n'(n) more close to the inference n(n). In this way, the bias signal e(n) as the output of the filter can be more closed to the desired signal d(n).
The cost function of LMS adaptive filter to get a desired estimation of the inference n(n) is the minimization of mean-square error [16], which is defined as:
(18)
And the algorithm adjusts the taps of FIR filter by Eq (19).
(19)
where w(n) is the tap of FIR filter, μ is step size which is chosen as 0.01. Referring to [4], from Fig 10, we can write
(20)
The first term E{[s(n)]2} is determined when the desired signal s(n) is fixed. Assuming that the inference signal and the desired signal are independent, and the second term 2E{s(n)[n(n)-y(n)]} can be expressed as:
(21)
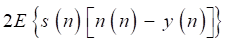
where E{[n(n)-y(n)]} is reduced to zero with iterations to run, and the second term is zero. Hence, the minimization of the mean-square error E{[s(n)]2} is equivalent to the minimization of the third term E{[n(n) -y(n)]2}. Therefore, the inference n(n) approximates the estimated signal n'(n), and the basis signal e(n) approximates the desired signal s(n). That is the basic mechanism of the LMS adaptive filter for heart-noise reduction.
The obtainment of reference signal x(n) is summarized as follows:
- On the basis of the estimation of the normal breath period, the signal is intercepted by the epoch window with the duration Ne. The elements of the first column of two-dimensional vectors MAX{maxv1, maxt1; maxv2, maxt2;…; maxvm, maxtm } and MIN {minv1, mint1; minv2, mint2; ...; minvm, mintm } are the positive peak values and negative peak values of each window, while the elements of the second column are the corresponding time, and m is the number of windows.
- This step is to confirm whether the peaks are caused by heart beats or breath. Firstly, sort the positive peak values from large to small to get an ordered vector OMAX {omax1,omax2,…,omaxm}, whose mean value is MAXave. Secondly, find the element omaxi-1, which is greater than 1.5∙MAXave, while the following element, omaxi, is less than 1.5∙MAXave. The elements omaxi+1, omaxi+2,…, omaxm, which are less than omaxi, can be regarded as the peaks caused by breath or caused by the first heart sounds which are too small to be ignored. To avoid the phenomenon that the positive peak and the negative peak in the same window are caused by two different heart sounds on the edge of the window, the interval of the positive peak and negative peak in one window need to be checked. If the interval |maxtj-mintj| is less than a fixed value Nt, the positive peak and negative peak can be supposed to be from the same heat beat, and the time of positive peak maxtj can be regarded as the time of heart beats.
- After confirming the time of heart beats, copy the original signal in the interval of [maxtj-timeheart, maxtj+timeheart], where timeheart is half of the estimated heart beat times, while other regions of the signal are set to zero, and the signal obtained can be considered as the reference signal.
The reference signal of the standard signal is shown in Fig 11.
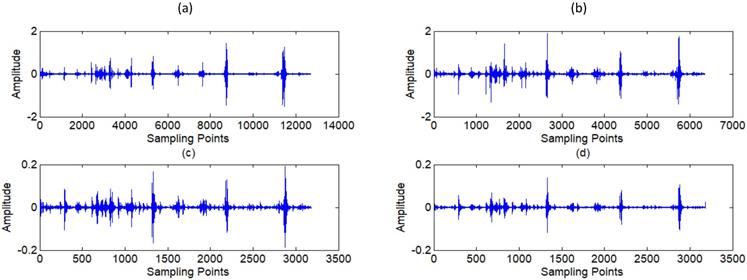
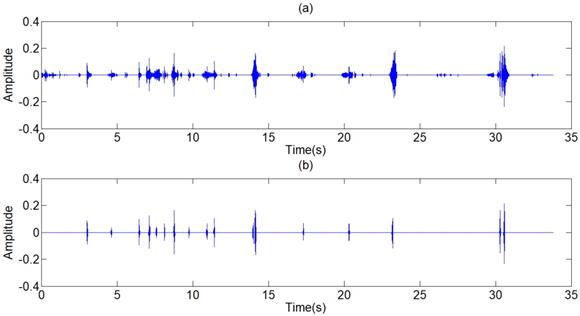
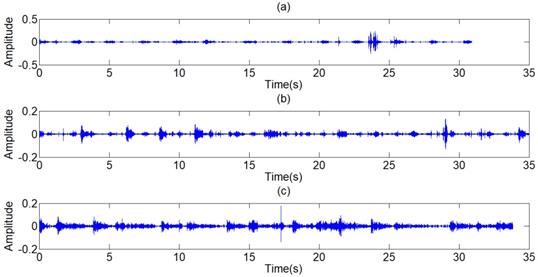
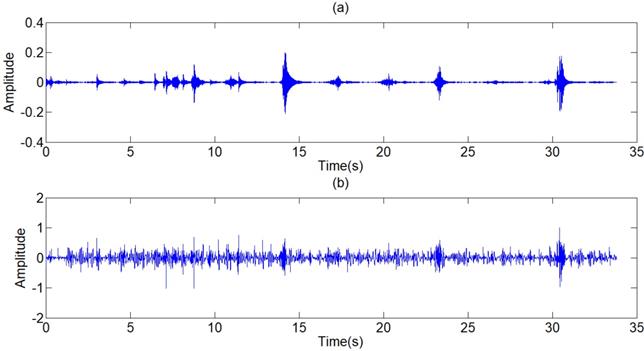
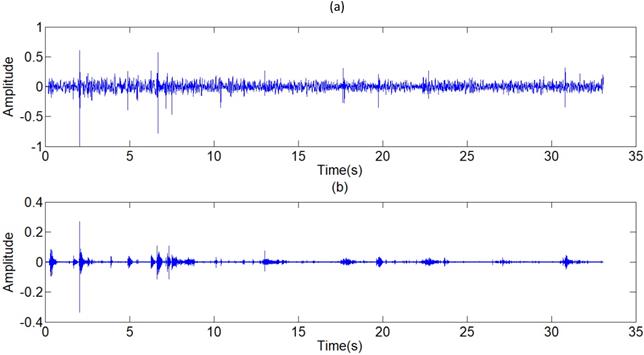
The filtered results of the standard signal are shown in Fig 12. Except some individual heart sounds, most heart sounds are found to be reduced by 30-50 percent. The filtered results of other typical signals are shown in Fig 13. The results prove the general utilization of the algorithm. Fig 14 and Fig 15 show other filter results of the eleven patients.
Figure 11
(a),(c),(e) The other three respiratory sounds, (b),(d),(f) The filtered signals of the three signals
Figure 12
Filtered result of standard signal
Figure 13
Filtered result of other typical signals
Figure 14
(a),(c),(e) Other three respiratory sounds, (b),(d),(f) The filtered signals of the three signals
Figure 15
(a),(c),(e) Another three typical respiratory sounds, (b),(d),(f) The filtered signals of the three signals
Discussion
The series of algorithms contain three steps of filters, a type I Chebyshev band-pass filter with the pass-band from 20Hz to1600Hz, a modified wavelet threshold de-noising filter and an adaptive filter. Each step of filters processes different components of noises. The FIR band-pass filter reduces most of the high-frequency and low-frequency noises beyond the pass-band, which accounts for the majority of the noises in original signals. However, because of the transitional band and the noise produced by the FIR filter, a single linear filter cannot cancel out all the noises in the stop-band. The modified wavelet threshold filter segments the signal into different frequency regions in the wavelet-domain, and processes the signals in narrower frequency bands to get more effective de-noising results. Majority of the remaining high-frequency and low-frequency noises, a portion of human voices and most of the second heart sounds are reduced in this step. On account of the overlap of heart sounds and lung sound in frequency, the first heart sounds cannot be filtered by the method in frequency domain. The adaptive filter, serving as a time-domain filter, is designed to reduce the first heart sounds. Because the reference is obtained by the estimation of the first heart sounds on the signals to be filtered, no external signals are required in the filter. To attain the trade-off between convergence rate and mean squared error, the step size is chosen as 0.001, and the order of FIR filter is chosen as 32 for reducing the algorithm complexity.
The filter results of the different signals collected are shown in Fig 12. Judged by the auscultation of physicians, most of the environment noises are canceled out and a large proportion of human voices and heart sounds are reduced, without distortion of the lung sounds. In the aspect of general utilization of algorithm, the frequency domain of pulmonary sounds is relatively stable, the normalization wavelet method based on the power of signal has great improvement in extension of the algorithm, and the algorithm of adaptive filter itself has good universality. Therefore, the series of algorithm has very wide generality and great effect on different signals. The Fig 16 shows the filter result of other typical de-noising algorithms. The part (a) of Fig 16 is the result of a single FIR band-pass filter with a narrow pass band. The algorithm has good effect in de-noising but also leads to much distortion. Fig 4 shows the result of a single FIR band-pass filter with a wide pass band. The signal has no distortion but still has much noise. The part (b) of Fig 16 is the result the traditional wavelet de-noising algorithm. The threshold values are selected by Eq (13). The filtered signal still has too much noise. By comparison, the filter algorithm proposed in this paper shows good effect in de-noising without any distortion.
Figure 16
Filtered result of other typical de-noising algorithms. (a) Filtered result of a single FIR band-pass filter with a narrow pass band. (b) Filtered result of the wavelet de-noising algorithm
Figure 17
(a) Signal with weak acoustic characteristics, (b) Filtered result with strengthened components of plosive
Another advantage of the algorithm is to expand signal characteristics of lung sounds. The filter algorithm can be used to expand most acoustic features of different lung sounds, such as plosives in moist rales and wheezes in dry rales. The function of the algorithm can assist physicians to recognize the categories of the respiratory lungs of patients on the basis of acoustic characteristics, and is convenient for the feature detection in the further research of pattern recognition. The function can also make some lung sounds, which are originally not applicable for the week acoustic characteristics, available in the research and auscultation. Because of the occasionally poor signal measuring environment or feebleness of patients, the acoustic characteristics of respiratory sounds are sometimes too week to judge the state of lungs. For instance, the plosives of the moist rale signal shown in Fig 17 are not apparent for the strong environment noises and week components of plosives. The algorithm helps outstanding the plosives, and makes filtered signals contain strong enough components of plosives in the judgment of lung conditions.
Conclusion
Addressing the issue of suppressing noises in lung sounds, a series of filters are proposed to reduce the external noises and inferences of the collected lung sounds for further analysis. The filter algorithm consists of a Type I Chebyshev band-pass filter, a modified wavelet threshold filter and an adaptive filter. The analysis and the practical experiment show that the filters have good de-noising effect. The algorithm also has a good performance in outstanding the acoustic characteristics of lung sound signals. Adopting the serial integrated de-noising algorithms, the filtered signal can be used to diagnosis better.
Acknowledgements
The research is funded by Grants (51575020) of the National Natural Science Foundation of China and Open Foundation of the State Key Laboratory of Fluid Power Transmission and Control.
Competing Interests
The authors have declared that no competing interest exists.
References
1. Khan TEA, Vijayakumar P. Separating Heart Sound from Lung Sound Using LabVIEW. International Journal of Computer and Electrical Engineering. 2010;2:524
2. Palaniappan R, Sundaraj K, Ahamed NU. et al. Computer-based respiratory sound analysis: a systematic review. IETE Technical Review. 2013;30:248-256
3. Rosenblatt M. Cumulants and cumulant spectra. Handbook of Statistics. 1983;3:369-382
4. Iyer VK, Ramamoorthy PA, Fan H. et al. Reduction of heart sounds from lung sounds by adaptive filterng. IEEE transactions on biomedical engineering. 1986;33:1141-1148
5. Ploysongsang Y, Iyer VK, Ramamoorthy PA. Characteristics of Normal Lung Sounds after Adaptive Filtering. American Review of Respiratory Disease. 1989;139:951-956
6. Alfaouri M, Daqrouq K. ECG signal denoising by wavelet transform thresholding. American Journal of applied sciences. 2008;5:276-281
7. Chen Y, Cheng Y, Liu H. Application of improved wavelet adaptive threshold de-noising algorithm in FBG demodulation. Optik-International Journal for Light and Electron Optics. 2017;132:243-248
8. Ho CYF, Ling BWK, Wong TPL. et al. Fuzzy multiwavelet denoising on ECG signal. Electronics Letters. 2003;39:1163-1164
9. Kabir MA, Shahnaz C. Denoising of ECG signals based on noise reduction algorithms in EMD and wavelet domains. Biomedical Signal Processing and Control. 2012;7:481-489
10. Papadimitriou S, Gatzounas D, Papadopoulos V. et al. Denoising of the fetal heart rate signal with non-linear filtering of the wavelet transform maxima. International journal of medical informatics. 1997;44:177-192
11. Hossain I, Moussavi Z. An overview of heart-noise reduction of lung sound using wavelet transform based filter. In Proceedings of the 25th Annual International Conference of the IEEE Engineering in Medicine and Biology Society. 2003;1:458-461
12. Sankar AB, Kumar D, Seethalakshmi K. Performance study of various adaptive filter algorithms for noise cancellation in respiratory signals. Signal processing: An international journal (SPIJ). 2010;4:267
13. Kompis M, Russi E. Adaptive heart-noise reduction of lung sounds recorded by a single microphone Engineering in Medicine and Biology Society, 1992 14th Annual International Conference of the IEEE. IEEE. 1992;2:691-692
14. Hadjileontiadis LJ, Panas SM. Adaptive reduction of heart sounds from lung sounds using fourth-order statistics. IEEE Transactions on Biomedical Engineering. 1997;44:642-648
15. Hadjileontiadis LJ, Panas SM. A wavelet-based reduction of heart sound noise from lung sounds. International Journal of Medical Informatics. 1998;52:183-190
16. Hadjileontiadis LJ, Panas SM. Separation of discontinuous adventitious sounds from vesicular sounds using a wavelet-based filter. IEEE Transactions on Biomedical Engineering. 1997;44:1269-1281
17. Donoho DL, Johnstone JM. Ideal spatial adaptation by wavelet shrinkage. Biometrika. 1994;81:425-455
18. Donoho DL. De-noising by soft-thresholding. IEEE transactions on information theory. 1995;41:613-627
19. Burrus CS, RA Gopinath, Haitao Guo. Introduction to wavelets and wavelet transforms. New Jersey, USA: Prentice Hall. 1998
20. Guoxiang S, Ruizhen Z. Three novel models of threshold estimator for wavelet coefficients. Lecture Notes in Computer Science. 2001;2251:145-150
21. Widrow B. Adaptive filters. Aspects of network and system theory. 1971;687:563-587
Author contact
![]() Corresponding author: Yan Shi, Professor.(yesoyoucom), School of Automation Science and Electrical Engineering, Beihang University, Beijing 100191, CHINA; The State Key Laboratory of Fluid Power Transmission and Control, Zhejiang University, Hangzhou 310058, China), Tel/Fax: +86 15810834177
Corresponding author: Yan Shi, Professor.(yesoyoucom), School of Automation Science and Electrical Engineering, Beihang University, Beijing 100191, CHINA; The State Key Laboratory of Fluid Power Transmission and Control, Zhejiang University, Hangzhou 310058, China), Tel/Fax: +86 15810834177
Citation styles
APA
Meng, F., Wang, Y., Shi, Y., Zhao, H. (2019). A kind of integrated serial algorithms for noise reduction and characteristics expanding in respiratory sound. International Journal of Biological Sciences, 15(9), 1921-1932. https://doi.org/10.7150/ijbs.33274.
ACS
Meng, F.; Wang, Y.; Shi, Y.; Zhao, H. A kind of integrated serial algorithms for noise reduction and characteristics expanding in respiratory sound. Int. J. Biol. Sci. 2019, 15 (9), 1921-1932. DOI: 10.7150/ijbs.33274.
NLM
Meng F, Wang Y, Shi Y, Zhao H. A kind of integrated serial algorithms for noise reduction and characteristics expanding in respiratory sound. Int J Biol Sci 2019; 15(9):1921-1932. doi:10.7150/ijbs.33274. https://www.ijbs.com/v15p1921.htm
CSE
Meng F, Wang Y, Shi Y, Zhao H. 2019. A kind of integrated serial algorithms for noise reduction and characteristics expanding in respiratory sound. Int J Biol Sci. 15(9):1921-1932.
This is an open access article distributed under the terms of the Creative Commons Attribution License (https://creativecommons.org/licenses/by/4.0/). See http://ivyspring.com/terms for full terms and conditions.