Impact Factor ISSN: 1449-2288

 Global reach, higher impact
Int J Biol Sci 2018; 14(8):983-991. doi:10.7150/ijbs.23817 This issue Cite
Research Paper
Improving Prediction of Self-interacting Proteins Using Stacked Sparse Auto-Encoder with PSSM profiles
Yan-Bin Wang1,2*, Zhu-Hong You2 ![]() *, Li-Ping Li2
*, Li-Ping Li2 ![]() , De-Shuang Huang3, Feng-Feng Zhou4, Shan Yang2
, De-Shuang Huang3, Feng-Feng Zhou4, Shan Yang2
1. University of Chinese Academy of Sciences, Beijing 100049, China;
2. Xinjiang Technical Institute of Physics and Chemistry, Chinese Academy of Science, Urumqi 830011, China;
3. Institute of Machine Learning and Systems Biology, School of Electronics and Information Engineering, Tongji University, Caoan Road 4800, Shanghai 201804, China;
4. College of Computer Science and Technology, and Key Laboratory of Symbolic Computation and Knowledge Engineering of Ministry of Education, Jilin University, Changchun, Jilin 130012, China.
*These authors contributed equally to this work.
Received 2017-11-13; Accepted 2018-3-29; Published 2018-5-23
Abstract

Self-interacting proteins (SIPs) play a significant role in the execution of most important molecular processes in cells, such as signal transduction, gene expression regulation, immune response and enzyme activation. Although the traditional experimental methods can be used to generate SIPs data, it is very expensive and time-consuming based only on biological technique. Therefore, it is important and urgent to develop an efficient computational method for SIPs detection. In this study, we present a novel SIPs identification method based on machine learning technology by combing the Zernike Moments (ZMs) descriptor on Position Specific Scoring Matrix (PSSM) with Probabilistic Classification Vector Machines (PCVM) and Stacked Sparse Auto-Encoder (SSAE). More specifically, an efficient feature extraction technique called ZMs is firstly utilized to generate feature vectors on Position Specific Scoring Matrix (PSSM); Then, Deep neural network is employed for reducing the feature dimensions and noise; Finally, the Probabilistic Classification Vector Machine is used to execute the classification. The prediction performance of the proposed method is evaluated on S.erevisiae and Human SIPs datasets via cross-validation. The experimental results indicate that the proposed method can achieve good accuracies of 92.55% and 97.47%, respectively. To further evaluate the advantage of our scheme for SIPs prediction, we also compared the PCVM classifier with the Support Vector Machine (SVM) and other existing techniques on the same data sets. Comparison results reveal that the proposed strategy is outperforms other methods and could be a used tool for identifying SIPs.
Keywords: Deep learning, Zernike Moments, Probabilistic Classification Vector Machines
Introduction
As a manifestation of life, proteins do not exist in isolation, but by interacting with each other, they complete most of the cellular functions. SIPs (Self-interacting proteins) are usually considered a particular case of protein interactions [1]. SIPs have the same arrangement of amino acids. This leads to the formation of homodimer. Research have shown that SIPs play a more vital role in the evolution of cellular function and protein interaction networks. Understanding whether proteins can react with themselves is sometimes crucial for clarifying the function of proteins, having an insight into the regulation function of protein and predicting and preventing disease. The homo-oligomerization have proven to play a significant role in the wide-ranging biological processes, for instance, immunological reaction, signal transduction, activation of enzyme, and regulation of gene expression. Ispolatov et al. point out that SIPs hold an important place in the protein interaction networks (PINs), which demonstrated that self-interaction of protein is an important factor in protein functions rule and have great potentials to interact with other proteins [2]. Many studies have shown that the diversity of proteins can be extended by SIPs without growing genome size. SIPs have an ability to improve the stability of protein and avoid the denaturation of proteins and reduce its superficial area. As a result, there is a strong requirement to develop an effective and reliable method of machine learning for detecting SIPs.
In recent years, some method based on computational technology have been proposed for protein interaction prediction. For example, Zaki et al. [3] developed an efficient and simple to predict PPIs based on similarity theory by using structural property. Zhou et al. [4] designed a way for predicting PPIs named as CCPPI which used Support Vector Machine model based on frequency difference of codon pair. You et al. [5] designed a prediction model to detect PPIs uses only proteins sequence information. Zahiri et al. [6] put a feature extraction algorithm based on evolutionary characteristics using the evolutionary feature of protein. Shi et al. [7] presented a method that combined SVM with CC (Correlation Coefficient) transformation. These methods usually consider certain information about protein pairs, for instance, colocalization, coexpression and coevolution. Yet, that information is not applicable to the treatment of SIPs. Nevertheless, such feature is not applicable to deal with SIPs problems. Besides, the PPIs data sets adopted in above approaches do not cover SIPs. For these reasons, above computational methods unsuited for SIPs prediction. Therefore, it is an imperative task to design an efficient and reliable method to predict SIPs [8-14].
In this study, a novel machine learning technique is proposed for detecting SIPs from protein sequence., consisting of a new feature extraction scheme combined with a PCVM classifier. More specific, each protein sequence transformed into Position Specific Scoring Matrix (PSSM), which contains the evolutionary information about proteins. Then, a novel feature extractor named as Zernike Moments (ZMs) is used to obtain 1260-dimensional feature vector from PSSM. The last step of the feature extraction scheme is to use Stacked Sparse Auto-Encoder (SSAE) to eliminate noise and reduce the feature dimension. At last, the PCVM model is employed to finish classification. The method we proposed was performed on S.erevisiae and Human SIPs data sets, the accuracies of 92.55% and 97.47% shown that our method achieves satisfactory results. For further demonstrate the advantage of this technique that is compared with other methods that have combined our feature extraction strategy with SVM, other (named as SLIPPER, CRS, SPAR DXECPPI, PPIevo and LocFuse). The validations and comparisons illustration that our method is superior to the previous proposed methods. These experimental results clearly show that this model provides high accuracy, good flexibility and strong stability [15-20].
Dataset
The UniProt database provides 20,199 Human sequence proteins for download [21]. The data come from a variety of resources, including from a variety of resources, including BioGRID, DIP, MatrixDB, InnateDB and IntAct [22-26]. In this study, we extracted interacting protein data containing only SIPs whose interaction type is ''direct interaction'' in the databas. As a result, we obtained 2,994 Human proteins sequences that having self-interacting in this experience. In order to ensure reliable experiments, the choice of experimental data is strictly followed by the following three steps: (1) The protein sequence with below 50 and above 5000 residues was detached from the entire Human protein; (2) The selection of protein data for positive self-interaction must match one of the following conditions: (a) At least two mass experiments or one small scale experiment have shown that this protein sequence can interact with itself; (b) the protein must be homooligomer in UniProt; (c) the self-interaction of this protein have been reported by more than one publication; (3) For the sake of establish negative data set, all known SIPs were deleted from the whole Human proteome.
As a result, we selected 17,379 protein pairs to establish a Human SIPs dataset, in which the number of negative SIPs and positive SIPs were 15,938 and 1,441, respectively. In addition, the effectiveness of the proposed method is further evaluated on S.erevisiae dataset, which contain 5,511 negative non-SIPs and 710 confident SIPs by use of the same strategy.
Method
Position Specific Scoring Matrix
The Position Specific Scoring Matrix (PSSM) was always adopted for obtaining evolutionary and conservative information about proteins. A PSSM can used to predict folding patterns of protein, RNA binding sites and protein structural classes [27-29]. In this work, the PSSM was adopted for predicting SIPs. A PSSM is an T╳20 matrix P={tij: i=1… T and j=1…20} for a given amino acid sequence, where the T represents the size of the protein sequence and the number of columns of T matrix denotes 20 amino acids. The score Tij is expressed as Tij=∑20 k=1c(a, k)╳v(b, k), where (a, k) is the probability that the kth amino acid appears at position a, and (b, k) is a matrix whose elements represent the mutation value between two different amino acids. Thus, high scores represent a conservative position; conversely, low scores mean a weak conservative position [30]. The PSI-BLAST (Position specific iterated BLAST) was employed for creating PSSMs, for obtaining highly and broadly homologous sequences, the e-parameter of PSI-BLAST was set as  , and we perform 3 iterations.
Zernike moments
The ZMs are frequently utilized for many image processing and computer vision tasks. Because it has the power to extract information from different depths. In this work, the ZMs was used for extracting key information on PSSM of a protein [31,32].
A set of complex polynomials is introduced by Zernike, which is a complete orthogonal set over the within of the unit circle, the set of these polynomials is represented as { }, which has the following form:
Vuv(x, y)= Vuv(ρ, θ) =Ruv(ρ)ejvθ for ρ≤1 (1)
where u is zero or positive integer, v is negative and positive integer, and it satisfies |v| < u, where u - |v| is an even number. is angle that vector
  deviated counterclockwise from the X axis,
  the length from (0, 0) to the pixel (x, y).
  is represented as:
Ruv(ρ) = ∑(u-|v|/2) s=0(-1)s (u - s)!/(s!(((u+|v|)/2)-s)!(((u-|v|)/2)-s)!) ρu-2s (2)
Note that Ru,-v(ρ)= Ruv(ρ). These polynomials are orthogonal and satisfy:
∫2π 0∫1 0V * uv(ρ,θ)Vpq(ρ,θ)ρdρdθ=π/n+δuρδvρ (3)
with
(4)
ZMs of order u with repetition v are finally defined as
Auv=(u+1/π) ∫2π 0∫1 0f (ρ,θ)V * uv(ρ,θ) ρdρdθ (5)
where f (ρ, θ) represents the image function. As we can see (5), the method for producing ZMs is calculate inner product between the Zernike basis function and the image function [33,34]. The ZMs of a digital image was computed by the summations. The digital image must be mapped in a unit circle. Figure 1 shows a wide-ranging case of the mapping transform. As Figure 1, Points that fall outside the circle are not used for calculation of the Zernike moments. Accordingly, the form of the ZMs of a digital image is expressed as follows:
General case of mapping transforms.
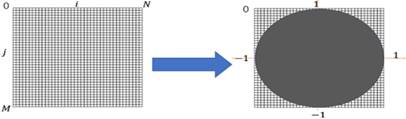
Auv=(u+1/π) ∑(ρ,θ)∈unit circle∑f (ρ,θ)V * uv(ρ,θ) (6)
We use the ZMs information to design a novel feature descriptor. Let the ZMs be sorted by u and v in order. According to ZMs theory, the greater the value of U and V, the more information we get, because the lower-order moments extract gross information and the higher-order moments capture high details information. In this work, the maximum order U and maximum repetition V are set to 70. Hence, the 1,260 features of protein can be obtained by utilizing the ZMs. The sorted ZMs form feature vector  as follows:
 =[|A11|,|A11|,… …, |AUV|]T, where |Auv| is the absolute value of Zernike moments. The zeroth order moments are not computed because they do not contain any valuable information and ZMs without considering m<0, since they are inferred through An, -m = A* nm [22].
Stacked Sparse Auto-Encoder
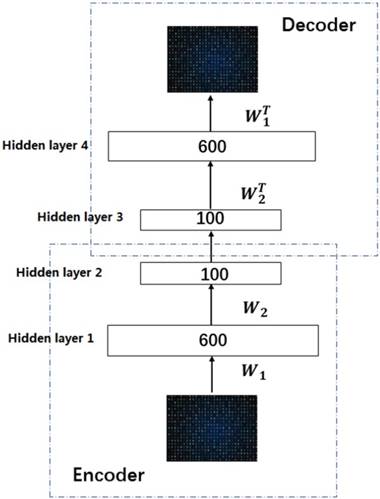
Deep learning is a significant concept in the machine learning theory at present. It is the focus of academic and industrial research. The Stacked Sparse Auto-Encoder (SSAE) is multilayer neural networks, which achieves the approximation of nonlinear function, and has the strong ability to extract the intrinsic features of training data. In this paper, the SSAE is adopted for feature reduction by data reconstruction.
The outputs of the current layer neuron of SSAE are fed to the connectivity layer neuron. The aim of SSAE is to learn a distinctive representation for Zernike moments feature, typically for the purpose of noise elimination and dimensionality reduction. The first layer is in charge of rough integration original input. The second layer is responsible for extracting and integrating the features learned earlier. Higher successive layers will be inclined to produce low dimensional, low noise, high cohesion features. In this work, the SSAE was used for obtaining more distinctive and stable representation from ZMs features [35-38].
In order to clearly understand the SSAE, we must first explain the SAE (Sparse Auto Encoder). The basic SAE is a three-layer neural network fully connected imposing sparsity on the hidden units during training, including the encoding part and the decoding part. In the coding stage, the primary data x is mapped onto hidden layer. This process can be represented as z =σ1(w1x+b1), which maps the input x∈ɌN to z∈ɌK, K<N, and the hidden layer z can be a new feature representation. These parameters (σ1, w1, b1) are represent a function, weight matrix and bias, respectively. After that the original data is reconstructed by the decoding function x' =σ2(w2x+b2), where parameters (σ2, w2, b2) are represent a function, weight matrix of decoding and bias. The purpose of SAE is to make the output as close as possible to the input by a loss function L: θ=argmin(1/n)∑n i=1L(xi, yi).
In this work, we build a SSAE with two hidden layers. The structure is shown in Figure 2. For simplicity, the decoder parts of SSAE has not shown in the Figure 2. Just like SAE, training SSAE is to find best parameter input in the case of minimizing the reconstructed difference. Once the optimal parameters θ are obtained, the SSAE yield function  that transforms original data to a low dimensional space [39,40].
Illustration of the architecture of SSAE.
Related classification Models
Support vector machines (SVMs) have high reputation in the field of pattern recognition machine learning and classification. Extensive comparisons also have shown that SVMs obtain good generalization performance on various dataset. However, this approach has some obvious drawbacks: (1) The count of support vector increases approximately in a line with the scale of training set; (2) SVM do not generate probabilistic outputs; (3) Cross validation based kernel parameter optimization strategy takes up a large amount of computing resources. Based on Bayesian theory, RVM (relevance vector machine) have been developed that can solve these problems in SVMs. The RVMs method takes advantage by the zero mean Gauss a priori, partial training of the Bayesian inference and the prior of weight  follow a zero-mean Gaussian distribution. However, the RVM has the potential to produce some unreliable vectors that lead to system error decisions. Because the weights of the negative class and the positive class are given samples that non-interacting might be assigned confident weights, and vice versa. To tackle this problem, the Probabilistic Classification Vector Machine (PCVM) approaches have been put forward that gives different priors to samples of different classes. the positive class is associated with right-truncated Gaussian and the negative class is associated with left-truncated Gaussian. Besides the high prediction accuracy, the PCVM method has the following advantages: (1) PCVM produces sparse predictive models and has better efficiency in the testing phase. (2) PCVM provides probabilistic results for each output. (3) The parameter optimization scheme based on Expected Maximum (EM) algorithm saves PCVM's efforts of grid search during training phase and improves the predictive performance of the test phase. [41-43].
Probabilistic Classification Vector Machine (PCVM) provide a sparse prediction tool proposed for solving the stability problem of RVM. Like most classification models, the goal of PCVM is to generate a predictive model f (x; w) by learning a set of labeled data {X, Y}, where X is data set, Y corresponds to the label of each data. The model is determined by a set of parameters learned and expressed as:
f (x; w) = ∑N i=1wi OI,θ (x)+b (11)
here, { O1,θ (x),… … ON,θ (x)} are basis functions (wherein  is the parameter of a basis function), parameters(wi,… …, wi ; b) are the weight of the prediction model.
For the two-classification problem, the Gaussian cumulative distribution function  is used to generate the final results. After incorporating (11) with the
 , the model becomes:
L (x; w, b) ==
(12)
Each weight  is assigned a prior by a truncated Gaussian distribution, as follow:
(W|
)
(13)
the bias b is assigned a zero-mean Gaussian prior, as follow:
(b|
)
N(b|0,
) (14)
where the  denotes truncated Gaussian function,
  means the precision of the corresponding parameter
  ,
,  determines the magnitude of the normal distribution. When
  , the left-truncated Gaussian is used for giving a non-negative prior, and when
  , the right-truncated Gaussian is used for giving a non-positive prior. It is denoted as
(
|
)
(15)
Those parameters (α, β) are hyper prior that are assigned by the gamma distribution. The parameters, w, b and θ, are assigned by the expectation maximization method [44-47].
The performance of PCVMs is affected by unique restriction θ, which is repeatedly adjusted by the system after manual determination. However, the parameter optimization strategy based on EM algorithm makes the parameters sensitive to initial values and converges to local minima. An effective way that avoid this problem is to use an ingenious initialization method. The specific parameter selection procedure is as follows: (1) A model was trained with ten different θ, due to use of the 5-fold experiment, we obtained a 5 × 10 output matrix. (2) For each row, we determined a value with the least error rate. (3) The average of five selected points as the final θ. In this work, the  of S.erevisiae and Human dataset is set to 3.6, 3.8, respectively.
Results and Discussion
Criterion
Our predictor is evaluated by calculating the Accuracy (Acc), Sensitivity (Sn), specificity (Sp), and Matthew`s Correlation Coefficient (Mcc). They are defined as:
(16)
(17)
(18)
(20)
Where TP means those samples that interact with themselves are predicted correctly, FP represents those samples, true non-interacting with themselves, are predicted to be interaction. TN are those samples, true non-interacting with themselves, are predicted correctly. FN represents those samples, true interacting with themselves, are judged to be non-interacting. Furthermore, the Receiver Operating Characteristic (ROC) is portrayed to assess the performance of a set of classification results and the area under ROC (AUC) is computed as a significant evaluation indicator [48,49].
Assessment of method
The proposed method was performed in S.erevisiae and Human datasets. In order to avoid overfitting, the cross-validation method was used in this paper.
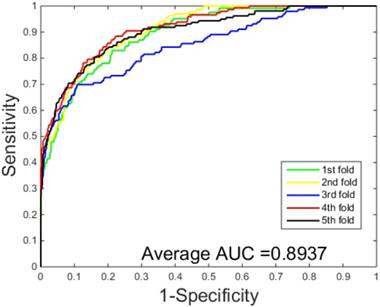
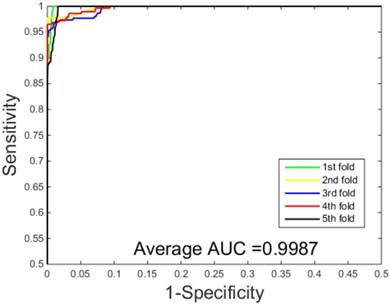
The prediction results obtained by integrating ZMs feature extraction with SSAE neural net and PCVM classifier are given in Table 1-2, from which we can see that the proposed approach achieved high accuracy on two datasets. More specific, The average Acc of S.erevisiae dataset are over 92%, and average Sn, Sp, and Mcc are 43.92%, 98.71% and 58.22%, respectively. We have also achieved a high average value of AUC of 0.8937 using the proposed method on S.erevisiae dataset, as shown in Figure 3. Similarly, the pleasing result (Table 2) was obtained by use of the proposed approach on Human dataset, whose average accuracies of cross-validation are above 97%, and average Acc, Sn, Sp and Mcc are 97.47%, 69.54%, 100%, and 82.24%, respectively. When our method is executed on the Human dataset, the AUC value obtained is close to 1 (Figure 4).
Fivefold results by means of our scheme on S.erevisiae dataset.
| Testing Set | Acc (%) | Sn (%) | Sp(%) | Mcc (%) |
|---|---|---|---|---|
| 1 | 92.96 | 39.84 | 98.39 | 53.11 |
| 2 | 92.85 | 43.70 | 98.83 | 58.41 |
| 3 | 92.20 | 40.41 | 99.09 | 57.07 |
| 4 | 92.60 | 51.02 | 98.18 | 61.97 |
| 5 | 92.13 | 44.65 | 99.08 | 60.56 |
| Average | 92.55 ± 0.3 | 43.92 ± 4.4 | 98.71± 0.4 | 58.22 ± 3.4 |
Five-fold results by means of our scheme on human dataset.
| Testing Set | Acc (%) | Sn (%) | Sp(%) | Mcc (%) |
|---|---|---|---|---|
| 1 | 97.55 | 70.07 | 100 | 82.61 |
| 2 | 97.55 | 69.53 | 100 | 82.30 |
| 3 | 97.29 | 68.98 | 100 | 81.85 |
| 4 | 97.90 | 74.65 | 100 | 85.43 |
| 5 | 97.07 | 64.46 | 100 | 79.03 |
| Average | 97.47 ± 0.3 | 69.54 ± 3.6 | 100 | 82.24 ± 2.2 |
ROC curves performed by our scheme on the S.erevisiae dataset.
ROC curves performed by our scheme on the Human dataset.
Promising predictive performance should be attributed to powerful PCVM classifiers and feature extraction strategy. The major advantage of employing the proposed strategy lies in the following four reasons: (1) PSSM, representing a given protein sequence, which not only retains enough prior knowledge, but also expresses the order information. (2) As a feature extraction method, ZMs be good at capturing useful information from multiple angles. (3) SSAE is a kind of deep learning, used to eliminate noise and reduce feature dimensions. (4) PCVM provides reliable and stable predictive capabilities.
Comparison PCVM with the SVM
We verify the performance of our classifier by compare it with the Support Vector Machine (SVM) classifier representing the most advanced technology. To be fair, the same feature extraction process was executed on S.erevisiae and Human datasets. We used LIBSVM tools [50] to implement the classification of SVM. The SVM parameters of c and g are 0.5 and 0.6 by the grid search method [51-58].
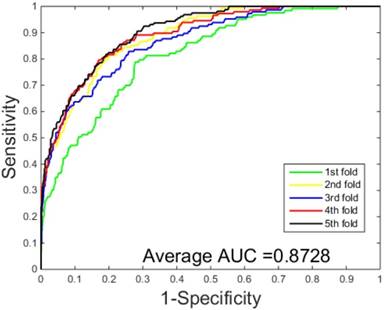
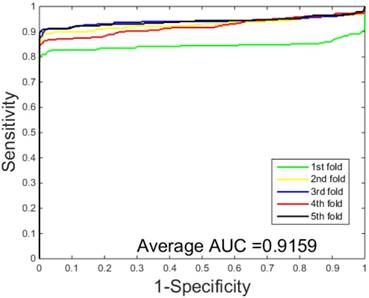
The performances of the two predictors (PCVM-based and SVM-based) have been compared by calculating the AUC, sensitivity, accuracy, specificity and Mcc. The results are provided in Table 3-4 and Figure 5-6. The average accuracies obtained by SVM-based method are 90.85± 0.3% and 96.82± 0.2%, respectively. The AUC obtained by SVM-based method are 0.8728 and 0.9159. However, the average accuracies by use of PCVM-based method are 92.55± 0.3% and 97.47± 0.3%, respectively. The AUC obtained by PCVM-based method are 0.8937 and 0.9987. The prediction performance obtained by PCVM-based technique are significantly better than that of the SVM-based. At the same time, the corresponding ROC curve of the PCVM classifier (Figure 3-4) are also significantly better than those of the SVM classifier (Figure 5-6). Better prediction results are achieved by the PCVM method, due to mainly the two reasons: (1) PCVM has an obvious advantage of employing truncated Gauss priors to produce sufficient robustness and sparse patterns, which narrow complexity of prediction model, but also computation is eased. (2) The kernel optimization strategy derived from probabilistic reasoning enables PCVM to save grid search time.
Fivefold results by means of the SVMs on S.erevisiae dataset.
| Testing Set | Acc (%) | Sn (%) | Sp(%) | Mcc (%) |
|---|---|---|---|---|
| 1 | 91.24 | 30.01 | 99.86 | 32.85 |
| 2 | 91.08 | 40.64 | 96.48 | 53.17 |
| 3 | 90.51 | 30.92 | 99.64 | 42.47 |
| 4 | 90.51 | 30.41 | 99.91 | 42.37 |
| 5 | 90.92 | 40.14 | 98.08 | 55.27 |
| Average | 90.85 ± 0.3. | 34.42 ± 5.4 | 98.79±1.5 | 45.22 ± 9.1 |
Fivefold results by means of the SVMs on Human dataset.
| Testing Set | Acc (%) | Sn (%) | Sp(%) | Mcc (%) |
|---|---|---|---|---|
| 1 | 97.06 | 64.08 | 100 | 78.80 |
| 2 | 96.69 | 58.78 | 100 | 75.33 |
| 3 | 96.60 | 61.06 | 100 | 76.72 |
| 4 | 96.81 | 61.46 | 100 | 77.06 |
| 5 | 96.95 | 63.07 | 100 | 78.13 |
| Average | 96.82 ± 0.2 | 61.69 ± 2.0 | 100 | 77.21 ± 1.3 |
ROC curves performed by SVM-based on the S.erevisiae dataset.
ROC curves performed by SVM-based on the Human dataset.
Comparison with other methods
To validate the advantage of our method for SIPs prediction, computations were performed on S.erevisiae and Human datasets by using six existing predictors (SLIPPER, CRS, SPAR, DXECPPI, PPIevo and LocFuse). The results achieved are given in Table 5-6, from which we can find that the overall performance obtained by the proposed approach in this paper using ZMs feature extraction, SSAE neural net and PCVM classified is remarkably better than those by the other well-known predictors. The performance of the proposed predictor (Table 5) has been found to be the best with 92.55 % cross-validation accuracy versus 71.90%, 87.46%, 66.28%, 66.66%, 72.69% and 76.96%. At the same time, we achieved the highest AUC with 0.8937. The same good results were obtained when we compared the cross-validation accuracies on Human dataset (Table 6). The performance of the proposed predictor achieves the best accuracy of 97.47%, 5.38% higher than the SPAR method. Another important indicator, AUC, is close to 1. These results illustrations that our predictor can obviously improve the prediction accuracy of SIPs.
The prediction results of different methods on the S.erevisiae dataset.
| Model | Acc (%) | Sn (%) | Sp(%) | MCC (%) | AUC |
|---|---|---|---|---|---|
| SLIPPER [11] | 71.90 | 69.72 | 72.18 | 28.42 | 0.7723 |
| DXECPPI [8] | 87.46 | 29.44 | 94.93 | 28.25 | 0.6934 |
| PPIevo [9] | 66.28 | 60.14 | 87.46 | 18.01 | 0.6728 |
| LocFuse [10] | 66.66 | 55.49 | 68.10 | 15.77 | 0.7087 |
| CRS [52] | 72.69 | 59.58 | 74.37 | 23.68 | 0.7115 |
| SPAR [52] | 76.96 | 53.24 | 80.02 | 24.84 | 0.7455 |
| Our method | 92.55 | 34.42 | 98.71 | 45.22 | 0.8937 |
The prediction results of different methods the Human dataset.
| Model | Acc (%) | Sn (%) | Sp(%) | MCC (%) | AUC |
|---|---|---|---|---|---|
| SLIPPER [11] | 91.10 | 47.26 | 95.06 | 41.97 | 0.8723 |
| DXECPPI [8] | 30.90 | 87.08 | 25.83 | 8.25 | 0.5806 |
| PPIevo [9] | 78.04 | 87.83 | 25.82 | 20.82 | 0.7329 |
| LocFuse [10] | 80.66 | 50.83 | 80.50 | 20.26 | 0.7087 |
| CRS [52] | 91.54 | 34.17 | 96.72 | 36.33 | 0.8196 |
| SPAR [52] | 92.09 | 33.33 | 94.70 | 38.36 | 0.8229 |
| Our method | 97.47 | 69.54 | 100.00 | 82.24 | 0.9987 |
Conclusion
Prediction of self-interacting proteins (SIPs) is helpful for dissecting the execution of most important molecular processes in cells. A number of computational approaches have been developed to detect SIPs. However, there are still some limitations existing in these methods. In this study, we developed a two-step procedure to integrate protein evolutionary information with machine learning method to improve SIPs prediction. We designed a novel feature extraction scheme which unite Zernike moments with stacked sparse auto-encoder. Then, the probabilistic classification vector machine was employed to perform predictive tasks. The experimental result indicated that the proposed predictor achieved high accuracies of 92.55% and 97.47% on S.erevisiae and Human data sets, respectively. To further highlight the advantage of our method for SIPs prediction, SVM-based method and other six methods were also implemented on S.erevisiae and Huamn data sets. Comparison results show that our predictor performs better than other competing methods.
Acknowledgements
This work is supported in part by the National Science Foundation of China, under Grants 61732012, 61520106006 and 61572506, in part by the Pioneer Hundred Talents Program of Chinese Academy of Sciences. The authors would like to thank all the editors and anonymous reviewers for their constructive advices.
Author Contributions
YBW, ZHY and DSH considered the algorithm, make analyses, arranged the data sets, carried out experiments, and wrote the manuscript. FFZ, LPL and SY designed, performed and analyzed experiments. All authors read and approved the final manuscript.
Competing Interests
The authors have declared that no competing interest exists.
References
1. Teichmann SA. Principles of protein-protein interactions. Bioinformatics. 2002;93(suppl_2):13-20
2. Ispolatov I, Yuryev A, Mazo I, Maslov S. Binding properties and evolution of homodimers in protein-protein interaction networks. Nucleic Acids Research. 2005;33(11):3629-3635
3. Nazar Z, Sanja LM, Wassim EH, Piers C. Protein-protein interaction based on pairwise similarity. BMC Bioinformatics. 2009;10(1):1-12
4. Zhou Y, Zhou YS, He F, Song J, Zhang Z. Can simple codon pair usage predict protein-protein interaction? Molecular Biosystems. 2012;8(5):1396-1404
5. You ZH, Lei YK, Zhu L, Xia J, Wang B. Prediction of protein-protein interactions from amino acid sequences with ensemble extreme learning machines and principal component analysis. BMC Bioinformatics. 2013;14(8):1-11
6. Zahiri J, Yaghoubi O, Mohammad-Noori M, Ebrahimpour R, Masoudi-Nejad A. PPIevo: Protein-Protein Interaction Prediction from PSWM Based Evolutionary Information. Genomics. 2013;102(4):237-242
7. Shi MG, Xia JF, Li XL, Huang DS. Predicting protein-protein interactions from sequence using correlation coefficient and high-quality interaction dataset. Amino Acids. 2010;38(3):891
8. Du X, Cheng J, Zheng T, Duan Z, Qian F. A Novel Feature Extraction Scheme with Ensemble Coding for Protein-Protein Interaction Prediction. International Journal of Molecular Sciences. 2014;15(7):12731-12749
9. Zahiri J, Yaghoubi O, Mohammad-Noori M, Ebrahimpour R, Masoudi-Nejad A. PPIevo: Protein-Protein Interaction Prediction from PSWM Based Evolutionary Information. Genomics. 2013;102(4):237-242
10. Zahiri J, Mohammadnoori M, Ebrahimpour R, Saadat S, Bozorgmehr JH, Goldberg T, Masoudinejad A. LocFuse: human protein-protein interaction prediction via classifier fusion using protein localization information. Genomics. 2014;104(6):496-503
11. Liu Z, Guo F, Zhang J, Wang J, Lu L, Li D, He F. Proteome-wide Prediction of Self-interacting Proteins Based on Multiple Properties. Molecular & Cellular Proteomics Mcp. 2013;12(6):1689
12. Huang J, Hao P, Zhang YL, Deng FX, Deng Q, Hong Y, Wang XW, Wang Y, Li TT, Zhang XG. Discovering multiple transcripts of human hepatocytes using massively parallel signature sequencing (MPSS). Bmc Genomics. 2007;8(1):207
13. Huang J, Ru B, Dai P. Prediction of Protein Interaction Sites Using Mimotope Analysis. InTech. 2012;9:189-206
14. Liu Z, Huang J, Huo Y, Gong J, Zhang Y, Wei C, Pu J. Identification of Proteins Implicated in the Increased Heart Rate in ShenSongYangXin-Treated Bradycardia Rabbits by iTRAQ-Based Quantitative Proteomics. Evidence-Based Complementray and Alternative Medicine. 2015;18(supplement 3):1-7
15. Lin H, Chen W, Yuan LF, Li ZQ, Ding H. Using Over-Represented Tetrapeptides to Predict Protein Submitochondria Locations. Acta Biotheoretica. 2013;61(2):259-268
16. Feng Y, Lin H, Luo L. Prediction of Protein Secondary Structure Using Feature Selection and Analysis Approach. Acta Biotheoretica. 2013;62(1):1-14
17. Wei C, Hao L, Feng PM, Chen D, Zuo YC, Chou KC. iNuc-PhysChem: A Sequence-Based Predictor for Identifying Nucleosomes via Physicochemical Properties. Plos One. 2012;7(10e):47843
18. Liu X, Li M, Li S, Peng S, Liao X, Lu X. IMGPU: GPU-Accelerated Influence Maximization in Large-Scale Social Networks. IEEE Transactions on Parallel & Distributed Systems. 2014;25(1):136-145
19. Peng S, Li S, Chen L, Xiao N, Peng Y. SenCast: Scalable multicast in wireless sensor networks. IEEE International Symposium on Parallel and Distributed Processing. 2008 1-9
20. Liu G, Yao Y, Peng S. EDEVS. A Scalable DEVS Formalism for Event-Scheduling Based Parallel and Distributed Simulations. In: Ieee/acm International Symposium on Distributed Simulation and Real Time Applications. 2009;2009:239-242
21. Consortium UP. UniProt: a hub for protein information. Nucleic Acids Research. 2015;43(Database issue):204-212
22. Chatr-Aryamontri A, Breitkreutz BJ, Oughtred R, Boucher L, Heinicke S, Chen D, Stark C, Breitkreutz A, Kolas N, O'Donnell L. The BioGRID interaction database: 2015 update. Nucleic Acids Research. 2011;43(Database issue):D470
23. Xenarios I, Rice DW, Salwinski L, Baron MK, Marcotte EM, Eisenberg D. DIP: The Database of Interacting Proteins: 2001 update. Nucleic Acids Research. 2000;32(1D):449
24. Launay G, Salza R, Multedo D, Thierrymieg N, Ricardblum S. MatrixDB, the extracellular matrix interaction database: updated content, a new navigator and expanded functionalities. Nucleic Acids Research. 2014;43(Database issue):321-327
25. Breuer K, Foroushani AK, Laird MR, Chen C, Sribnaia A, Lo R, Winsor GL, Hancock REW, Brinkman FSL, Lynn DJ. InnateDB: systems biology of innate immunity and beyond—recent updates and continuing curation. Nucleic Acids Research. 2013;41(Database issue):1228
26. Orchard S, Ammari M, Aranda B, Breuza L, Briganti L, Broackes-Carter F, Campbell NH, Chavali G, Chen C, Del-Toro N. The MIntAct project-IntAct as a common curation platform for 11 molecular interaction databases. Nucleic Acids Research. 2014;42:358-363
27. Liang Y, Liu S, Zhang S. Prediction of Protein Structural Classes for Low-Similarity Sequences Based on Consensus Sequence and Segmented PSWM. Computational & Mathematical Methods in Medicine. 2015;2015(2):1-9
28. Wang J, Wang C, Cao J, Liu X, Yao Y, Dai Q. Prediction of protein structural classes for low-similarity sequences using reduced PSWM and position-based secondary structural features. Gene. 2015;554(2):241-248
29. Shen HB, Chou KC. QuatIdent. a web server for identifying protein quaternary structural attribute by fusing functional domain and sequential evolution information. Journal of Proteome Research. 2009;8(3):1577-1584
30. Xiao N. Compute PSWM (Position-Specific Scoring Matrix) for given protein sequence.
31. Noll RJ. Zernike polynomials and atmospheric turbulence. Journal of the Optical Society of America. (1917-1983). 1976;66(3):207-211
32. Schwiegerling J, Greivenkamp JE, Miller JM. Representation of videokeratoscopic height data with Zernike polynomials. Journal of the Optical Society of America A Optics Image Science & Vision. 1995;12(10):2105-2113
33. Chen Z, Sun SK. A Zernike Moment Phase-Based Descriptor for Local Image Representation and Matching. IEEE Transactions on Image Processing A Publication of the IEEE Signal Processing Society. 2010;19(1):205-219
34. Hwang SK, Billinghurst M, Kim WY. Local Descriptor by Zernike Moments for Real-Time Keypoint Matching. Image and Signal Processing, Congress on. 2008 781-785
35. Li S, Lee MC, Pun CM. Complex Zernike moments features for shape-based image retrieval. IEEE Transactions on Systems Man & Cybernetics Part A Systems & Humans. 2009;39(1):227-237
36. Wang Y-B, You Z-H, Li X, Jiang T-H, Chen X, Zhou X, Wang L. Predicting protein-protein interactions from protein sequences by a stacked sparse autoencoder deep neural network. Molecular BioSystems. 2017;7:1336-1344
37. Xu J, Xiang L, Hang R, Wu J. Stacked Sparse Autoencoder (SSAE) based framework for nuclei patch classification on breast cancer histopathology. IEEE International Symposium on Biomedical Imaging. 2014 999-1002
38. Xu J, Xiang L, Liu Q, Gilmore H, Wu J, Tang J, Madabhushi A. Stacked Sparse Autoencoder (SSAE) for Nuclei Detection on Breast Cancer Histopathology images. IEEE Transactions on Medical Imaging. 2016;35(1):119-130
39. Lyons J, Dehzangi A, Heffernan R, Sharma A, Paliwal K, Sattar A, Zhou Y, Yang Y. Predicting backbone Cα angles and dihedrals from protein sequences by stacked sparse auto-encoder deep neural network. Journal of Computational Chemistry. 2014;35(28):2040-2046
40. Xu J, Xiang L, Liu Q, Gilmore H, Wu J, Tang J, Madabhushi A. Stacked Sparse Autoencoder (SSAE) for Nuclei Detection on Breast Cancer Histopathology images. IEEE Transactions on Medical Imaging. 2016;35(1):119
41. Hinton G, Deng L, Yu D, Dahl GE, Mohamed AR, Jaitly N, Senior A, Vanhoucke V, Nguyen P, Sainath TN. Deep Neural Networks for Acoustic Modeling in Speech Recognition: The Shared Views of Four Research Groups. IEEE Signal Processing Magazine. 2012;29(6):82-97
42. Andrew AM. An Introduction to Support Vector Machines and Other Kernel-based Learning Methods. Kybernetes. 2001;32(1):1-28
43. Bishop CM, Tipping ME, Nh CC. Variational Relevance Vector Machines. Advances in Neural Information Processing Systems. 12: 2000 299-334
44. Wang Y, You Z, Li X, Chen X, Jiang T, Zhang J. PCVMZM: Using the Probabilistic Classification Vector Machines Model Combined with a Zernike Moments Descriptor to Predict Protein-Protein Interactions from Protein Sequences. International Journal of Molecular Sciences. 2017
45. Chen H, Tino P, Xin Y. Efficient Probabilistic Classification Vector Machine with Incremental Basis Function Selection. IEEE Transactions on Neural Networks & Learning Systems. 2014;25(2):356-369
46. Chen H, Tino P, Yao X. Probabilistic classification vector machines. IEEE Transactions on Neural Networks. 2009;20(20):901-914
47. Stacy EW. A Generalization of the Gamma Distribution. Annals of Mathematical Statistics. 1962;33(3):1187-1192
48. Fawcett T. An introduction to ROC analysis. Pattern Recognition Letters. 2006;27(8):861-874
49. Dodd LE, Pepe MS. Partial AUC estimation and regression. Biometrics. 2003;59(3):614-623
50. Chang CC, Lin CJ. LIBSVM: A library for support vector machines. Acm Transactions on Intelligent Systems & Technology. 2007;2(article 27):389-396
51. Liu Z, Guo F, Zhang J, Wang J, Lu L, Li D, He F. Proteome-wide Prediction of Self-interacting Proteins Based on Multiple Properties. Molecular & Cellular Proteomics Mcp. 2013;12(6):1689
52. Liu X, Yang S, Li C, Zhang Z, Song J. SPAR: a random forest-based predictor for self-interacting proteins with fine-grained domain information. Amino Acids. 2016;48(7):1655
53. Xin Luo, Mengchu Zhou, Shuai Li, Yunni Xia, Zhuhong You, Qingsheng Zhu, Hareton Leung. Incorporation of Efficient Second-order Solvers into Latent Factor Models for Accurate Prediction of Missing QoS Data. IEEE Trans on Cybernetics. 2017;4:1216-1228 DOI 10.1109/TCYB.2017.2685521
54. Shuai Li, Zhuhong You, Hongliang Guo, Xin Luo, Zhongqiu Zhao. Inverse-free Extreme Learning Machine with Optimal Information Updating. IEEE Trans on Cybernetics. 2016;46(5):1229-1241
55. Xin Luo, Jianpei Sun, Zidong Wang, Shuai Li, Mingsheng Shang. Symmetric and Non-negative Latent Factor Models for Undirected, High Dimensional and Sparse Networks in Industrial Applications. IEEE Trans on Industrial Informatics. 2017;13(6):3098-3107 DOI 10.1109/TII.2017.2724769
56. Di Wu, Xin Luo, Guoyin Wang, Mingsheng Shang, Ye Yuan, Huyong Yan. A Highly-Accurate Framework for Self-Labeled Semi-Supervised Classification in Industrial Applications. IEEE Trans on Industrial Informatics. 2017;14(3):909-920 DOI 10.1109/TII.2017.2737827
57. Xin Luo, Mengchu Zhou, Shuai Li, Zhuhong You, Yunni Xia, Qingsheng Zhu. A Non-negative Latent Factor Model for Large-scale Sparse Matrices in Recommender Systems via Alternating Direction Method. IEEE Trans. on Neural Networks and Learning Systems. 2016;27(3):524-537
58. Yinyan Zhang, Shuai Li, Jie Gui, Xin Luo. Velocity-Level Control with Compliance to Acceleration-Level Constraints: A Novel Scheme for Manipulator Redundancy Resolution. IEEE Trans on Industrial Informatics. 2018;14(3):921-930 DOI 10.1109/TII.2017.2737363
Author contact
![]() Corresponding author: Zhu-Hong You and Li-Ping Li (cs2bioinformaticscom).
Corresponding author: Zhu-Hong You and Li-Ping Li (cs2bioinformaticscom).