Impact Factor ISSN: 1449-2288
- Issue 12; 2026
- Issue 11; 2026
- Issue 10; 2026
- Issue 9; 2026
- Issue 8; 2026
- Volume 22; 2026
- Past Issues
- Advance Articles
- Editorial Board
- Cover Images
- Index & Coverage
- Cover Suggestion
- Special Issues
1. Introduction
2. Materials and Methods
3. Results and Discussion
Acknowledgements
References
Figures
Author biography

 Global reach, higher impact
Int J Biol Sci 2005; 1(3):123-125. doi:10.7150/ijbs.1.123 This issue Cite
Short Research Communication
A new way of describing meiosis that uses fractal dimension to predict metaphase I
Cynthia M. Ross ![]()
Department of Biological Sciences, Thompson Rivers University, Kamloops, BC V2C 5N3, Canada
Received 2005-6-29; Accepted 2005-8-1; Published 2005-8-5
Abstract
Meiosis, the reductive nuclear division, is a continuum, but for purposes of communication, is described in stages. In sexually-reproducing organisms, including the dwarf mistletoe Arceuthobium americanum, prophase I of meiosis is prolonged (8 months for female A. americanum). Conversely, metaphase I, where chromosome pairs line up along a dividing cell's "equator", is relatively brief, difficult to predict, but critical regarding the random distribution of the paternal and maternal chromosomes in sexual organisms. However, descriptions of meiosis as either a continuum or stages are limited to qualitative observations. A quantification of meiosis can provide mathematical descriptors and allow for the prediction of when chromosomes reach the equator; this will not only be useful to researchers of cell division, but also to those requiring a large sample of metaphase I materials. Here, the probability-density function was used to calculate the fractal dimension of A. americanum nuclei undergoing early meiosis, and it predicted the onset of metaphase I by 2 days.
Keywords: chromosomal condensation, dwarf mistletoe, fractal, meiosis, probability-density function, quantification
1. Introduction
The chromosomes of any organism become increasingly condensed as they proceed through leptotene, zygotene, pachytene, diplotene, and diakinesis, the substages of prophase I [1]. Essentially, the chromosomes develop into "patches" in a "nucleoscape" before the metaphase I stage is reached. Therefore, a method used to quantify the patchiness of chromosomal condensation might provide a numerical predictor for metaphase I. The objective of detecting and quantifying spatial pattern, including the degree of patchiness of a landscape, is frequently encountered in ecological studies. Typically, the methods for detection of patchiness are scale-dependent; magnification of a patch results in the loss of the patchy pattern over the landscape [2]. Similarly, magnification with a microscope obscures patterns of patchiness. Therefore, the measure of chromosomal patchiness must not depend on the scale.
Conveniently, the fractal dimension, Df, is scale-independent [3]. In familiar Euclidean space, a line has 1 dimension, a plane has 2, and a cube, 3. However, the dimension of a fractal "line" has value of 1≤ Df ≤ 2 [2, 3]. A Df that approaches 1 implies that the particular object of interest (be it a landscape feature or chromosomal material) is found in patches and is less space-filling, whereas a Df that approaches 2 suggests the measured feature is space-filling and dispersed, so that the overall landscape (or nucleoscape!) is not patchy [4].
It is expected that the Df of nuclei in early prophase I would approach 2, as the chromosomal material would be relatively dispersed. The Df of nuclei progressing through prophase I should decrease and approach 1as the chromosomal material becomes more condensed. Furthermore, some value of Df would likely be a quantitative indicator for the onset of metaphase I.
The megasporocyte in the female flower of Arceuthobium americanum enters prophase I at the end of one summer, goes into a resting period over the winter, and resumes prophase I in the next year's growing season before proceeding into metaphase I and the rest of meiosis [5]. As this prophase I is so prolonged, the ability to predict the initiation of metaphase I within days is a considerable challenge, and hence presents the perfect opportunity to test the ability of Df to do so.
2. Materials and Methods
To assess Df as a metaphase I predictor, daily collections of 40 A. americanum female flowers (Belair, Manitoba, Canada) were made from March 1 (prior to resumption of prophase I) until May 1 (when metaphase I has been reached or surpassed) in 2000 "Year 1" and 2001 "Year 2". Flowers were preserved and megasporocytes harvested [6, 7]. With phase-contrast microscopy and consistent illumination, whole megasporocytes were digitized as binary (pure black and white) raster images with Adobe Photoshop (resolution of 2400 dots per inch). Each image was cropped to include only the nucleus (nucleolus ignored) and exported through NIH Image as a text file (black pixel=1, white pixel=0). A Pascal program calculated the probability-density function for each “nucleoscape” text file; this function has been successfully used in ecological studies to calculate Df and detect spatial pattern in Landsat images [2, 8]. The density function is generated from square sampling pixel windows (LxL) successively placed on each pixel of interest (here, black=1). Within each window, the patch pixels are counted (n), and frequencies expressed as probabilities. The first moment of the probability distribution, M(L), is determined for increasing values of L, so the slope of the plot of log M(L) vs. log (L) represents Df [2, 8, 9].
3. Results and Discussion
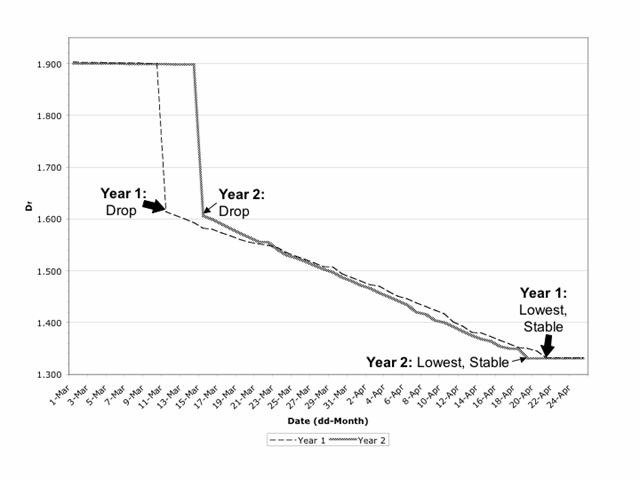
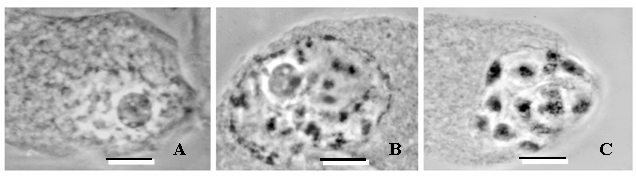
The mean Df for the 40 nucleoscapes from the first date of sampling (March 1) was 1.903 (±0.004) in Year 1 and 1.900 (±0.003) in Year 2 (Fig. 1); these values are not significantly different (p>0.95). Visually, the chromosomal material was relatively dispersed (Fig. 2A), as would be anticipated for a mean Df that approached 2. Mean Df remained constant (±0.003, Year 1 and Year 2 values equivalent, p>95%) over the next 9 days in Year 1 and over the next 13 days in Year 2 (Fig. 1). However, mean Df then made a significant drop (p<5%) to 1.614 (±0.002) on March 11 of Year 1 and 1.606 (±0.003) on March 15 of Year 2 (Fig. 1); the values for Year 1 and Year 2 are equivalent (p>95%), and the drop corresponded with the chromosomal condensation associated with the resumption of prophase I (Fig. 2B). The mean Df continued to decline significantly (p<5%) each day over the next 41 days in Year 1 (until April 21) and next 35 days in Year 2 (until April 19), to reach what would be a low of 1.332 (±0.001) in Year 1 and 1.331 (±0.001) in Year 2 (Fig. 1); values equivalent (p>95%). At this time, the chromosomes were highly condensed but not yet at the equator (Fig. 2C); a Df approaching 1 is consistent with a nucleoscape made patchy with condensing chromosomes. The next day (April 22 in Year 1, April 20 in Year 2), the mean Df was not significantly different (p>95%), and the following day i.e. 2 days after the lowest mean Df was reached, chromosomes could be found along the equator, having achieved metaphase I. In other words, if mean Df remained statistically similar for 2 days, metaphase I would occur on the third day, and furthermore, the lowest and predictive mean Df ranged from 1.330 to 1.333.
Daily value of mean Df from March 1 to April 25 in Year 1 (2000) and Year 2 (2001). Mean Df makes a significant drop (p<5%) to 1.614 (±0.002) on March 11 (Year 1) and 1.606 (±0.003) on March 15 (Year 2), continues to decline significantly (p<5%) each day over the next 41 days in Year 1 (until April 21) and next 35 days in Year 2 (until April 19), to reach a stable low value of 1.332 (±0.001) in Year 1 and 1.331 (±0.001) in Year 2
Phase-contrast light micrographs of meiotic nuclei in the megasporocytes of the dwarf mistletoe, Arceuthobium americanum. A) Nucleus sampled prior to the resumption of prophase I. B) Nucleus sampled when prophase I resumes, chromosomal condensation commences, and the value of the fractal dimension, Df, begins to drop. C) Chromosomes are maximally condensed; Df has reached its lowest value, and metaphase I will occur after 2 days. Scale bar = 10 μm
Not only does Df indicate the relative degree of chromosomal condensation more sensitively and quantitatively than microscopic observation alone, but it also predicts the onset of metaphase I by 2 days. The ability to compare meiotic timing and events amongst different species can be done in a quantitative fashion that will eliminate the subjectivity inherent in qualitative descriptions. The method for harvesting nuclei and extracting Df is quite simple, much more so than embedding and staining tissues, so time may be saved if many metaphase I slides are required. As prophase I is always prolonged relative to metaphase I, regardless of the organism, some value of Df will be predictive in any species examined. The method as described here will work particularly well in other species with relatively long meiotic divisions, such as peonies, genus Paeonia [10]. In commercially important plants such as these, predicting when meiotic events occur can be particularly important and could streamline the culture of zygotic embryos.
Difficulties in applying the method might arise for species with relatively short meiotic divisions. For these species, hourly instead of instead of daily Df measurements would be more informative; however, simply waiting for the event to occur may be easier than making the measurements themselves. Furthermore, the method might not be sensitive enough to predict chromosomal condensation in small cells that have large amounts of nuclear DNA, as the images of what should be “dispersed” material may be misinterpreted by the algorithm as “patchy”, since the chromosomal material would already be somewhat clumped together by the confines of the smaller cell.
Use of this technique should also allow for the quantification of mitosis (the equational nuclear division) along with the prediction of mitotic metaphase. As for meiosis, quantification of mitosis will facilitate objective comparisons of mitotic events amongst cells, tissues, individuals, and species. Notably, a quantification of mitosis could prove considerably valuable for another reason; if Df values can be determined for normal tissues, it is likely that deviations in Df, either in absolute value or rate of change, could signal abnormalities in the cell cycle that might be correlative to precancer events in animals.
Acknowledgements
Cynthia thanks the Natural Sciences and Engineering Research Council (NSERC) of Canada for the two postgraduate scholarships she received for her Ph.D. work. She is also grateful to Dr. M.J. Sumner for his supervision, and fully acknowledges Dr. Norman C. Kenkel and Dr. David J. Walker for their guidance and suggestions with the initial research approach. She thanks Dr. D.R. McQueen for preparation of some of the samples, and Dr. D. Punter for his advice and expertise with the dwarf mistletoes.
Conflict of interest
The author has declared that no conflict of interest exists.
References
1. Page SL, Hawley RS. Chromosome choreography: the meiotic ballet. Science. 2003 ;301:785-789
2. Kenkel NC, Walker DJ. Fractals and ecology. Abst Bot. 1993 ;17:53-70
3. Julien R, Botet R. Aggregation and Fractal Aggregates. Singapore: World Scientific Publishing Co. 1987
4. Sugihara G, May RM. Applications of fractals in ecology. Trends Ecol Evol. 1990 ;5:79-86
5. Hawksworth FG, Wiens D. Dwarf Mistletoes: Biology, Pathology, and Systematics: US. Dep Agric For Serv Handb No 709. Washington: US Government Printing Office. 1996
6. Herr JM Jr. A new clearing-squash technique for the study of ovule development in angiosperms. Amer J Bot. 1971 ;58:785-790
7. Ross CM, Sumner MJ. Development of the unfertilized embryo sac and pollen tubes in the dwarf mistletoe Arceuthobium americanum (Viscaceae). Can J Bot. 2004 ;82:1566-1575
8. Milne BT. Spatial aggregation and neutral models in fractal landscapes. Am Nat. 1992 ;139:32-57
9. Voss RF. Fractals in nature: from characterization to simulation. In: (ed.) Peitgen HO, Saupe D. The Science of Fractal Images. New York: Springer. 1988:21-70
10. Shamrov II. Ovule and seed development in Paeonia lactiflora (Paeoniaceae). Botanich Zh. 1997 ;82(6):24-46
Figures
Author biography
Cynthia M. Ross is an Assistant Professor in the Department of Biological Sciences at Thompson Rivers University, BC, Canada. She obtained B.Sc. (First Class Honours) and Ph.D. from the University of Manitoba, Winnipeg, MB, Canada, where her Ph.D. work was supported by Natural Sciences and Engineering Research Council (NSERC) of Canada. Her interests include reproduction and anatomy of the enigmatic dwarf mistletoes (genus Arceuthobium), and the application of mathematical techniques to plant anatomy.
![]() Corresponding address:
Corresponding address:
Cynthia M. Ross, Assistant Professor. Tel: (250)828-5424 Fax: 828-5450 Email: crossca