Impact Factor ISSN: 1449-2288
- Issue 11; 2026
- Issue 10; 2026
- Issue 9; 2026
- Issue 8; 2026
- Issue 7; 2026
- Volume 22; 2026
- Past Issues
- Advance Articles
- Editorial Board
- Cover Images
- Index & Coverage
- Cover Suggestion
- Special Issues
1. INTRODUCTION
2. MATERIALS AND METHODS
3. RESULTS AND DISCUSSION
4. Conclusion
Note added
Acknowledgements
References

 Global reach, higher impact
Int J Biol Sci 2006; 2(2):32-37. doi:10.7150/ijbs.2.32 This issue Cite
Research Paper
Metaphylogeny of 82 gene families sheds a new light on chordate evolution
Alexandre Vienne, Pierre Pontarotti ![]()
Phylogenomics Laboratory, EA 3781 Evolution Biologique, Université de Provence, 13331 MARSEILLE CEDEX 03, FRANCE
Received 2006-1-15; Accepted 2006-3-31; Published 2006-4-10
Abstract
Achieving a better comprehension of the evolution of species has always been an important matter for evolutionary biologists. The deuterostome phylogeny has been described for many years, and three phyla are distinguishable: Echinodermata (including sea stars, sea urchins, etc…), Hemichordata (including acorn worms and pterobranchs), and Chordata (including urochordates, cephalochordates and extant vertebrates). Inside the Chordata phylum, the position of vertebrate species is quite unanimously accepted. Nonetheless, the position of urochordates in regard with vertebrates is still the subject of debate, and has even been suggested by some authors to be a separate phylum from cephalochordates and vertebrates. It was also the case for agnathans species –myxines and hagfish– for which phylogenetic evidence was recently given for a controversial monophyly. This raises the following question: which one of the cephalochordata or urochordata is the sister group of vertebrates and what are their relationships? In the present work, we analyzed 82 protein families presenting homologs between urochordata and other deuterostomes and focused on two points: 1) testing accurately the position of urochordata and cephalochordata phyla in regard with vertebrates as well as chordates monophyly, 2) performing an estimation of the rate of gene loss in the Ciona intestinalis genome. We showed that the urochordate phyla is the vertebrate sister group and that gene loss played a major role in structuring the urochordate genome.
Keywords: chordate monophyly, evolution, cephalochordate, urochordate, gene loss
1. INTRODUCTION
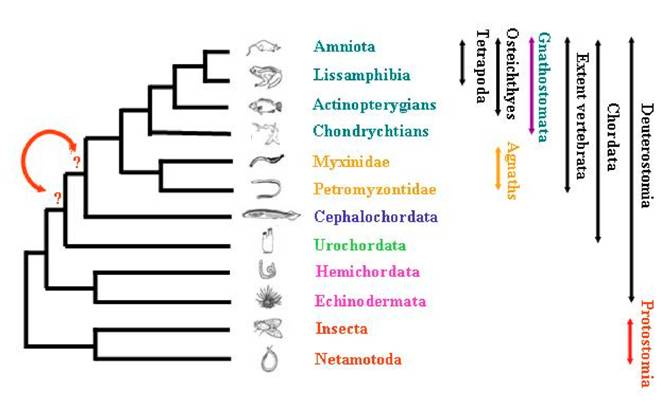
The positioning of species among the deuterostome phylum and the evolution of metazoans has fascinated researchers for decades, and has been the purpose of strong debates. Using for comparisons the morphological as well as the molecular data that are nowadays abundant and available through large number of databases, they all tried to describe as accurately as possible the reality of species evolutionary history. Inside deuterostomians, three major groups are quiet unanimously defined (Figure 1): Echinodermata (including starfish, sea urchins, etc…), Hemichordata (including acorn worms and pterobranchs), and Chordata (including three subphyla: urochordates –composed of more than 3.000 species—, cephalochordates –composed of approximately 29 species—, and the extant vertebrates including hagfishes, lampreys, and jawed vertebrates –composed of approximately 53.000 species—) [1]. The analysis of anatomical data has led to several hypotheses regarding deuterostome phylogeny [2] and the relationships inter and intra-groups are still subject to debates.
Schematic representation of the relationships among tripoblasts.
One of the specificity of chordates is their morphological synapomorphic. These particularities shared between urochordates, cephalochordates and vertebrates are quiet well known–as for example the notochord, the dorsal hollow nerve cord, the tail extending behind the visceral cavity, the thyroid gland (endostyle), and some other features [3].
Nonetheless, controversy is common among evolutionary biologists regarding the kind of data analysed, those data being tested as nucleic or protein sequences, considering them as fast or slow-evolving genes or parts of genes [4]. These latter will give more or less phylogenetic signals from the data sets for recent or deeper events during evolution. Recent studies have led to the re-examination of some species relationships, and echinoderms + hemichordates were shown to constitute a monophyletic group. More recently, relationships of agnathans species –myxine and hagfish—were revisited [5], and this example is the best illustration of discussions. Indeed, strong support was given for the monophyly of jawless vertebrates which are the most basal group of vertebrates, by the analysis of 35 protein coding gene families after years of controversial debates. The concatenation of the different topologies obtained led to the assessment of a monophyletic group. This work can be extended to the present purpose concerning the existing relationships between cephalochordates and urochordates, leading to the following question: which one of cephalochordata or urochordata correspond to the sister group of vertebrates?
Many studies tried to characterise the relationship existing within chordates phylum. Urochordates have been supposed to be a separate phylum from cephalochordates and vertebrates, but they were also described by some others as constituting a monophyletic group with lancelets (cephalochordates) [6]. In order to test the phylogenetic relationships among deuterostomes, the analysis of Large Sub-Unit (LSU) and Small Sub-Unit (SSU) rRNA sequences was performed from 28 taxa [2]. The hypothesis of lancelet being the sister group of vertebrates was supported in the analysis for LSU data, while the combination of these results with SSU data gave ambiguous results about chordate monophyly. A recent analysis based on a supermatrix approach [7] gave more information about this relationship, suggesting that urochordates are more closely related to vertebrates than are cephalochordates.
In order to re-evaluate the closest vertebrate relative –choosing between urochordate and cephalochordate—(Figure 1) and to test as well the chordate monophyly, we revisited a total of 82 protein alignments. The genes were analysed without any a priori about their biological function, neither their localisation in each of the genome of species studied. Phylogenetic reconstructions were performed using three methods and the statistical significance of the topologies obtained was tested. This analysis also allowed to evaluate the rate of gene loss in the ciona lineage.
2. MATERIALS AND METHODS
Databases Screening and Sequences Retrieval
A total of 44 protein sequences alignment were retrieved from the Amphibase database [8], which is an amphioxus sequences database. Additionally, 38 other amphioxus sequences alignments [9] were retrieved, and all the data-sets were revisited.
We used Blastp on the NR data base and Takifugu rubripes predicted proteins database at the National Center for Biotechnology Information (NCBI) [10], as well as on the Ciona intestinalis database [11] in order to identify potential orthologous genes.
Phylogenetic Analysis
Reconstruction Methods
Protein sequences were realigned with ClustalX [12]. Phylogenetic reconstructions were performed using the full-length alignment (without taking into account gaps or ambiguous sites). Three reconstruction methods were used: the Maximum Parsimony in PAUP*4.0 [13], the Maximum Likelihood in Tree Puzzle [14], and the Neighbor-Joining in MEGA2 [15]. The topologies were assessed using the bootstrap proportion [15].
Testing Amino-Acids Composition Bias
In order to avoid possible wrong topological reconstruction induced by an amino-acid composition bias among one or more of the protein sequences, we tested systematically their composition using TreePuzzle [16]. We did not detect any composition bias.
Statistical Tests
Four-Cluster Analysis
In order to test which group –defined as Urochordates and Cephalochordates—is the closest relative to vertebrates, the Four-Cluster Analysis was performed with Phyltest [17]. Indeed, the branch lengths and their variances can be estimated by the least squares method for any topology obtained for a given data-set. Thus the S-values of alternative topologies can be compared and the statistical significance of the difference in S-values examined [18].
Data sets concatenation
The 82 amphioxus sequences were used as query to search through databases. In 18 cases no hit has been found in the Ciona intestinalis genome and 8 of the Ciona Intestinalis sequences were not orthologs to amphioxus or vertebrate genes. They were thus eliminated from further phylogenetic analysis.
The 56 kept data sets were concatenated in order to improve the phylogenetic signal from genes analysed individually as described in [19], corresponding to a supermatrix of 25,202 amino acid positions. Orthologous sequences in eight organisms were kept from the original data sets. In the cases of co-orthology of vertebrate to amphioxus genes, only the most conserved paralog was kept. Only sequences from Homo sapiens, Mus musculus, Gallus gallus, Xenopus laevis, Takifugu rubripes, the genus Branchiostoma (including B. floridae, B. lanceolatum, and B. belcheri), Ciona intestinalis and Drosophila melanogaster were kept because orthologous sequences were most frequently present in all of these organisms. In this concatenated data set, many gaps were observed. Nonetheless, reconstructions were performed using both pairwise and complete deletion, and the results obtained were identical.
3. RESULTS AND DISCUSSION
Are Cephalochordates The Closest Relatives to Vertebrates?
The analysis of 18S rRNA molecule has been usual for the inference of deuterostome phylogeny [20], but quiet controversial [21]. This molecule was indeed shown to be inappropriate to reflect the whole phylogenetic signal [4].As for the ambiguous topologies obtained by [2], the 10 alternative topologies – urochordates closest relative to vertebrates – found in the present analysis could be explained by at least two hypotheses: a more rapid evolution of Ciona intestinalis genes, or a much earlier divergence time compared to chordate groups, this latter leading possibly to a noise due to long-term change.
The analysis of 18S rDNA [22] using three different reconstruction methods –Maximum Parsimony, Maximum Likelihood, and Neighbor-Joining—with 28 deuterostome species and 3 out-groups strongly supported the monophyly of the three following “groups”: (i) vertebrates + cephalochordate, (ii) urochordate, and (iii) echinoderm + hemichordate clades. Differently the analysis of both LSU and SSU rDNA sequences has shown contrasted results [2]. Indeed, the combination of both data did not give a clear result. Furthermore, to give more contradiction about the chordate phylogeny, they observed that SSU sequences do not systematically cluster with other chordates [22].
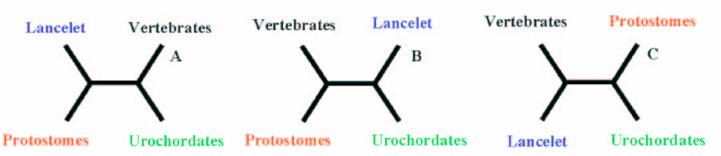
Using the Four-Cluster analysis for 49 sequence alignments with at least one amphioxus sequence, we showed that amphioxus is the closest relative of vertebrates for 24 of the families studied, and amphioxus and ciona constituted a monophyletic group for 15 families (Table 1 and Figure 2). This latter result could be due to the lack of resolution for the studied data sets, the considered nodes being not supported for the corresponding phylogenetic reconstructions (very low bootstrap proportion). Ciona was the closest relative to vertebrates for 10 gene families. The Four-Cluster Analysis gave as a result 49% of the topologies obtained showing cephalochordates being the closest relative of vertebrates, with urochordates attached as a sister group. Cephalochordate and urochordate constituted a monophyletic group for 30.6% of the families, and urochordates were the closest relatives to vertebrates for 20.4%.
Total number and percentage of topologies A, B, and C obtained by the Four-Cluster analysis performed on a total number of 49 protein coding gene families yielding at least one ortholog in the Ciona intestinalis genome.
Hypotheses of the phylogenetic relationship among the deuterostome phylum.
A parallel could be made regarding the discussion of the existence of Coelomata or Ecdysozoa [23]. A more complete analysis consisting in the analysis of more than 500 sets of orthologous proteins was performed by [24], and the results are conclusive with the precedent results using a smaller data set.
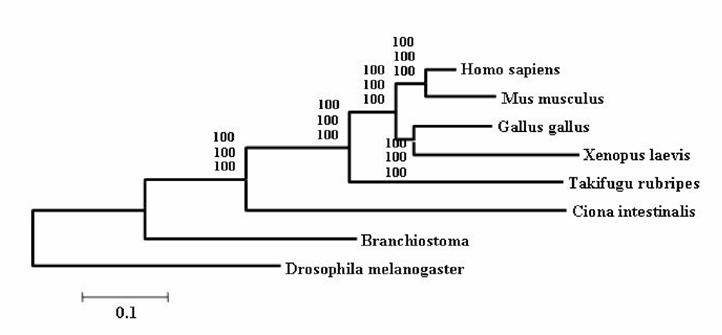
It is widely accepted that cephalochordates are the closest relatives to vertebrates. Indeed individual phylogenetic reconstructions usually gave this topology as result (Figure 3). In order to improve the results obtained using individual phylogenetic reconstructions and the four-cluster analysis (supertree-like), 56 of the gene families (see Material and Methods) were concatenated (supermatrix approach) and the topology obtained using three reconstruction methods was quiet surprising (Figure 4). Indeed, considering the results obtained, urochordates are the closest relative to vertebrates with a bootstrap value of 100% for all the three reconstruction methods used. Also it was very surprising that the bootstrap proportion was so high, the results are in agreement with those obtained by [7].
Example of phylogenetic reconstruction performed for 4 gene families yielding amphioxus as the sister group of vertebrates, which is the most commonly observed topology. Values at nodes are Bootstrap Proportions (BP) values for the Neighbour-Joining reconstruction.
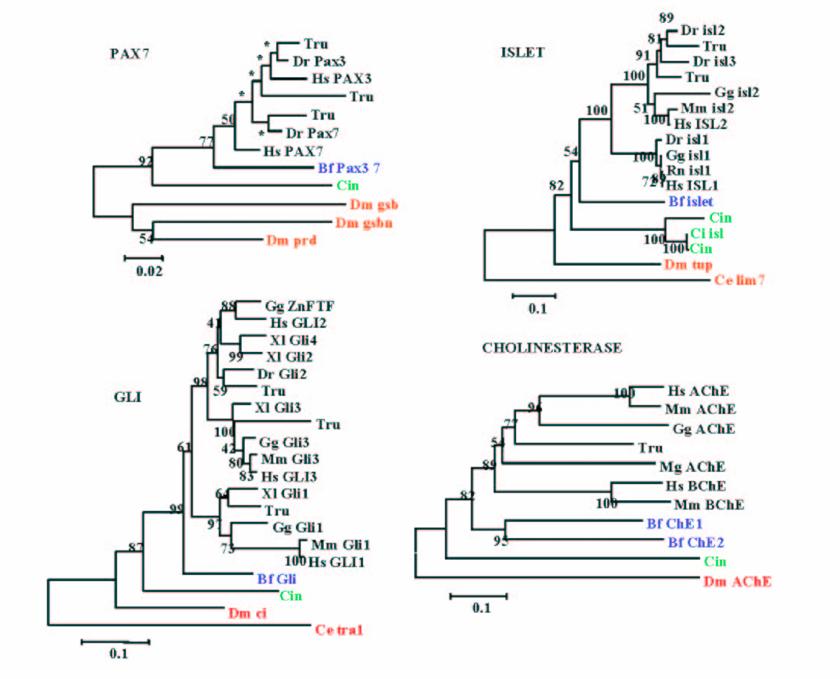
The concatenated phylogenetic tree obtained using 56 gene families. Values at nodes are Bootstrap Proportion – used to assess the topologies (Felsenstein 1985) – for the Neighbor-Joining, the Maximum Parcimony and the Maximum Likelihood method.
The incongruence between the results obtained by the Four-Cluster analysis and the data sets concatenation can be explained. Indeed Rokas et al [19], reported that single gene trees have sampling errors that can be severely misleading. Using genome data from eight yeasts, they show that if we rely on one gene only, one can get the wrong tree with very strong statistical support. By using many genes, the sampling errors inherent to the use of single genes can be counterbalanced, meaning that if we want to really learn something about phylogeny, we have to sample many genes. Some recent claims for lateral gene transfer based on odd branches might be more easily explained by simple sampling errors. At least this factor needs to be taken into account more strongly in the future. Thus, the concatenation of all sequences for a unique phylogenetic reconstruction is supposed to be more strongly supported than individual ones. Furthermore, the fact that percentages are so close – less than 19% difference – could also be explained by a short difference speciation time period between urochordates and cephalochordates.
Gene loss, a recurrent process among lineage
The vertebrate genome is supposed to have undergone large-scale duplications, as it was observed in the human and the house mouse genomes [25]. Paralogous regions, remnants of these regional duplications, are also supposed to be the result of polyploidisation events that would have occurred in the early time of vertebrates' evolution. After these large scale duplications, some paralogs were retained while numerous of them were lost.
Gene loss is indeed a common process and has been previously described in the comparative analysis of Drosophila melanogaster and Anopheles gambiae [26]. This phenomenon is not a particularity of animal kingdom and a large fraction of originally duplicated genes were shown to have returned to a single copy state in the Arabidopsis thaliana genome [27, 28, 29].
Gene loss has also already been described in the ascidian tunicate genome, as for example the case of Hox genes, four of them having been lost during evolution [30]. The absence of these genes seems to have occurred at the base of the tunicate lineage, because they are neither found in the appendicularian Oikopleura genome. In yeasts, differential gene loss after whole genome duplications has been suggested to be responsible for rapid speciation events in the lineage leading to Saccharomyces cerevisiae [31]. Finally, a recent analysis [32] showed that gene losses played an important role during vertebrate evolution independent to the polyploidisation and ancillary loss process. We show in the present analysis (see material and methods) that gene loss took a large role in shaping the Ciona intestinalis genome. Indeed 18 of the 82 gene families studied (corresponding to 22 %) underwent lineage-specific gene loss.
The gene loss observed may be due to a rapid evolution of the Ciona nuclear genome in the same manner than it was observed for the mitochondrial genome. These observations may point in the same direction as those made by Swalla et al [33] who observed long branches while reconstructing the phylogenetic relationships of deuterostomes phyla.
The authors of the Ciona intestinalis genome [34] predicted that the available sequences represent approximately 95 percent of the coding sequences of this genome. It would thus have been expected to find two or three genes missing. Our observation leads to the conclusion that gene loss played a large role in structuring the Ciona intestinalis genome.
4. Conclusion
We showed in this article that the urochordates are the sister groups of the vertebrate and that gene loss played a major role in the structuration of the Ciona genome.
The availability of amphioxus whole genome sequence (that should be released in early 2006) as well as several other urochordate genomes will be important to possibly support these findings.
Note added
While we were revising our papers, a phylogenetic analysis agreeing with ours, showing that Tunicates and not cephalochordates are the closest living relatives of vertebrates has been published [35].
Acknowledgements
We thank Etienne G.J. Danchin, Anthony Levasseur and Michael McDermott for their advices and review of the manuscript.
Pierre Pontarotti is a Directeur de Recherche from the Centre National de la Recherche Scientifique.
Conflict of interests
The authors have declared that no conflict of interest exists.
References
1. Hedges SB. The origin and evolution of model organism. Nature Reviews Genetics. 2003 ;3:838-849
2. Winchell CJ, Sullivan J, Cameron CB. et al. Evaluating hypotheses of deuterostome phylogeny and chordate evolution with new LSU and SSU ribosomal DNA data. Mol Biol Evol. 2002 ;19:762-776
3. Brusca RC, Brusca GJ. Invertebrates. Sunderland, Massachusetts: Sinauer. 1990
4. Abouheif E, Zardoya R, Meyer A. Limitations of metazoans 18S rRNA sequence data: implications for reconstructiong a phylogeny the animal kingdom and inferring the reality of the Cambrian explosion. J Mol Evol. 1998 ;47:394-405
5. Takezaki N, Figueroa F, Zaleska-Rutczynska Z. et al. Molecular phylogeny of early vertebrates: Monophyly of the Agnathans as revealed by sequences of 35 genes. Mol Biol Evol. 2003 ;20:287-292
6. Jollie MJ. The origin of chordates. Acta Zool. 1973 ;54:81-100
7. Philippe H, Lartillot N, Brinkmann H. Multigene analyses of bilaterian animals corroborate the monophyly of Ecdysozoa, Lophotrochozoa and Protostomia. Mol Biol Evol. 2005 ;22:1246- 1253
8. Link to the amphibase database in which 44 sequence alignments were retrieved and re-analysed. http://www.biology.wustl.edu/faculty/gibsonbrown/curated/index.html
9. Abi-Rached L, Gilles A, Shiina T. et al. Evidence of en bloc duplication in vertebrate genomes. Nature Genetics. 2002 ;31:100-105
10. NCBI. http://www.ncbi.nlm.nih.gov/sutils/genom_table.cgi?database=31033
11. Link to the Ciona intestinalis genome database at the Joint Genome Institute. http://genome.jgi-psf.org/ciona4/ciona4.home.html
12. Thompson JD, Gibson TJ, Plewniak F. et al. The ClustalX windows interface: flexible strategies for multiple sequence alignment aided by quality analysis tools. Nucleic Acids Research. 1997 ;24:4876-4882
13. Swofford DL. PAUP*. Phylogenetic Analysis Using Parsimony (*and other Methods), version 4. Sunderland, Massachusetts: Sinauer Associates. 2000
14. Strimmer K, Haeseler A. Quartet puzzling: A quartet maximum likelihood method for reconstructing tree topologies. Mol Biol Evol. 1996 ;13:964-969
15. Kumar S, Tamura K, Jakobsen IB. et al. MEGA2: Molecular Evolutionary Genetics Analysis software. Bioinformatics. 2001 ;17:1244-1245
16. Felsenstein J. Confidence limits on phylogenies: an approach using the bootstrap. Evolution. 1985 ;39:783-791
17. Kumar S. PHYLTEST: a program for testing phylogenetic hypotheses. University Park: Pennsylvania State University. 1996
18. Rzhetsky A, Kumar S, Nei M. Four-cluster analysis: a simple method to test phylogenetic hypotheses. Mol Biol Evol. 1995 ;12:163-167
19. Rokas A, Williams BL, King N. et al. Genome-scale approaches to resolving incongruence in molecular phylogenies. Nature. 2003 ;425:798-804
20. McClintock Turbeville J, Shulz JR, Raff RA. Deuterostome Phylogeny and the Sister Group of the Chordates: Evidence from Molecules and Morphology. Mol Biol Evol. 1994 ;11:648-655
21. Giribet G. Current advances in the phylogenetic reconstruction of metazoan evolution. A new paradigm for the Cambrian explosion? Mol Phyl Evol. 2002 ;24:345-357
22. Cameron CB, Garey JR, Swalla BJ. Evolution of the chordate body plan: new insights from phylogenetic analyses of deuterostome phyla. PNAS. 2000 ;97:4469-4474
23. Blair JE, Ikeo K, Gobojori T. et al. The evolutionary position of nematodes. BMC Evolutionary Biology. 2002 ;8:2-7
24. Wolf YI, Rogozin IB, Koonin EV. Coelomata and not Ecdysozoa: Evidence from genome-wide phylogenetic analysis. Genome Research. 2004 ;14:29-36
25. Lundin LG. Evolution of the vertebrate genome as reflected in paralogous chromosomal regions in man and the house mouse. Genomics. 1993 ;16:1-19
26. Zdobnov EM von Mering C, Letunic I. et al. Comparative genome and proteome analysis of Anopheles gambiae and Drosophila melanogaster. Science. 2002 ;298:149-159
27. Arabidopsis Genome Initiative. Analysis of the genome sequence of the flowering plant Arabidopsis thaliana. Nature. 2000 ;408:796-815
28. Blanc G, Barakat A, Guyot R. et al. Extensive duplication and reshuffling in the Arabidopsis genome. Plant Cell. 2000 ;12:1093-1101
29. Vision TJ, Brown DG, Tanksley SD. The origins of genomic duplications in Arabidopsis. Science. 2000 ;290:2114-2117
30. Holland LZ, Gibson-Brown JJ. The Ciona intestinalis genome: when the constraints are off. BioEssays. 2003 ;25:529-32
31. Scannell DR, Byrne KP, Gordon JL, Wong S, Wolfe KH. Multiple rounds of speciation associated with reciprocal gene loss in polyploid yeasts. Nature. 2006 ;440:341-5
32. Danchin EGJ, Gouret P, Pontarotti P. Eleven ancestral gene families lost in mammals and vertebrates while otherwise universally conserved in animals. BMC Evolutionary Biology. 2006 ;6:5
33. Swalla BJ. Phylogeny of the urochordates: implications for chordate evolution. In: (ed.) SAWADA H, LAMBERT C. Biology of ascidians-Proceedings of the First International Symposium on the Biology of Ascidians. Tokyo: Springer Verlag. 2001
34. Dehal P, Satou Y, Campbell RK. et al. The draft genome of Ciona intestinalis: insights into chordate and vertebrate origins. Science. 2002 ;298:2157-67
35. Delsuc F, Brinkmann H, Chourrout D, Philippe H. Tunicates and not cephalochordates are the closest living relatives of vertebrates. Nature. 2006 ;439:965-8
Author contact
![]() Corresponding address:
Corresponding address: